Nomenclature
h: Heat transfer coefficient (W/m2·K)
hstat: Static enthalpy (J/kg)
htot: Specific total enthalpy (J/kg)
k: Turbulence kinetic energy per unit mass (W/kg)
p: Pressure (Pa, N/m2)
T: Temperature (K)
V: Volume (m3)
ρ: Density (kg/m3)
μt: Turbulent viscosity (m2/s)
SE: Energy source
SM: Momentum source
U: Vector of velocity Ux,y,z
u: Velocity component in turbulent flow
λ: Thermal conductivity (W/m·K)
τ: Molecular stress tensor
pγt: Turbulent Prantl number (Cpμt/λt)
1. Introduction
The decline in Arctic glaciers caused by global warming has made the development of shipping routes by countries adjacent to the Arctic more feasible, resulting in a growing demand for ice-class ships for developing maritime energy and resources in the Arctic. Ships navigating the Arctic ocean are exposed to extreme environments characterized by high wind speeds and low atmospheric temperatures. Therefore, sea spray and atmospheric moisture generated during navigation leading to icing on the external surfaces and deck equipment of the ship. As shown in
Fig. 1, water droplets coming into contact with the external chilled surfaces of the ship in these extreme conditions cause icing. The rate of icing and ice density vary depending on external conditions (Rashid, 2016).
The formed ice poses risks to human safety while also negatively impacting the working conditions and equipment performance on deck passages, workspaces, and superstructures. Hence, the International Maritime Organization (IMO) has established international regulatory requirements for ice-class criteria and winterization notation, aiming to ensure the safety of ships and protection in extreme environments, considering the anticipated operating conditions and risks that ships may encounter in polar waters (
IMO, 2015). Classification societies from various countries also define low-temperature designs and anti-icing treatments. The Norwegian Classification Society (Det Norske Veritas, DNV) broadly categorizes winterization technologies for ship equipment into Categories I and II. Category I covers issues related to anti-icing designs for navigation, steering and propulsion, anchoring, life-saving, and escape routes, while Category II focuses on winterization design technologies related to decks and superstructures, helidecks, handrails, and cargo deck areas (
DNV, 2005).
In South Korea, development projects, such as ‘Development of Safe Navigation Technologies in Polar Routes and Evaluation Methods for Extreme Low-Temperature Ice Performance for Ice-Class Ships (
KRISO, 2013)’ and ‘Development of Evaluation Technologies for Low-Temperature Design and Anti-Icing Treatment (Winterization) (
Ministry of Knowledge Economy, 2012)’ have been implemented, utilizing heating coils as the method to prevent icing on ice-class ships. However, issues with the efficiency of power consumption required to maintain this method and the lack of stability due to partial circuit disconnection have recently led to the research and development of the surface heating element method based on carbon nanotubes (CNT).
The CNT-based surface heating element method offers the advantages of improved energy consumption efficiency, durability, and flexibility, making it applicable to a broader range of equipment (B.P.
Technology Transaction, 2017). However, there is a lack of quantitative research evaluating the anti-icing performance of the surface heating element method compared to the conventional heating coil method.
In this study, numerical analyses were conducted by referencing the heated walkway—a ship equipment application that employs the CNT-based surface heating element method developed by
Yu et al. (2022)—to verify its efficiency against the conventional heating coil method. Calibration was performed based on numerical analysis results at ambient temperature using the heating coil method developed by
Lee et al. (2012). Parameters such as heat flux were determined, with the results validated based on the results of the conducted laboratory experiments and numerical analysis. This study was verified that the heat flux derived from the surface heating element method is more efficient compared to that of the existing heating coil method.
2. CNT-based Surface Heating Element Method
2.1 Overview of the Surface Heating Element Method
The existing methods using heating coils suffer from energy loss issues, such as heat generated by the heating coils being transferred by convective air currents, reducing efficiency over time, and failing to maintain stable temperatures. Furthermore, the heating coil can disconnect or deform owing to rapid temperature rise or high temperature, significantly compromising its performance (B.P.
Technology Transaction, 2017).
In contrast, the surface heating element method involves installing metal electrodes at both ends of a thin, conductive, carbon-based surface heating element, and then insulating it. A rated voltage is then applied to the metal electrodes, inducing heat across the entire surface. Nano heating elements are new heat-generating materials that contain a mix of various metallic compounds of tin oxide and various minerals crushed into nano-sized particles. This method is 50–60% more efficient than existing nichrome wire methods, offers a faster response time, can heat from low temperatures to above 500 °C, and is flexible in design and application, allowing for a wide range of shapes and materials. It has the advantages of excellent fire resistance, moisture resistance, and wear resistance. Moreover, it maintains its efficiency over the long term (B.P.
Technology Transaction, 2017).
Specifically, the CNT-based surface heating element method utilizes the electrical properties of carbon, converting electrical energy to thermal energy through resistance. This method is easy to manufacture, allows for convenient temperature control, and offers uniform heat distribution, reducing temperature variations.
Fig. 2 illustrates the thermal diffusion and emission characteristics of conventional heating coil methods and surface heating element methods, highlighting the advantages of the latter in terms of heat distribution and energy consumption efficiency.
The surface heating element method applied in this study is shown in
Fig. 2(b). Using a multi-layer structure, it aims for thermal diffusion and distribution, considering conduction up to the top layer, achieving a uniform temperature distribution and offering thermal advantages, such as higher heat energy diffusion and efficiency compared to the heating coil method shown in
Fig. 2(a).
2.2 Heated Walkways for Polar Route Vessels
In this study, the surface heating element method were applied to the heated walkway prototype developed by
Yu et al. (2022). The design ensures that the anti-icing performance is maintained even in extreme environmental conditions of −62 °C for the vessels operating in Arctic ocean. The purpose of the heated walkway is to prevent safety incidents in advance by preventing icing on the upper decks of ships navigating icy waters, thereby ensuring safe operation for workers and equipment.
The CNT-based surface heating element method designed for this heated walkway is illustrated in
Fig. 3. It is composed of a CNT-based heating film at the center. For anti-icing, the upper layer includes a steel plate and a heat-dissipating silicone pad considering the conduction phenomena. The sides and bottom are designed with insulating foam silicone pads, VIP insulating materials, and aluminum side and bottom covers to minimize heat loss and ensure product stability (
Yu et al., 2022).
To evaluate the performance of the heated walkway prototype using the CNT-based heating film, winterization performance tests were conducted in ambient and low-temperature environments at the Korea Research Institute of Ship & Ocean Engineering (KRISO) polar environment testing facility. The performance through computational fluid dynamics(CFD)-based numerical analyses were also simulated. Additionally, the efficiency of the surface heating element method was verified by comparing and validating the temperature distribution results of the heated walkways and heated stairs in ambient and low-temperature experiments with numerical analysis results (
Park et al., 2023).
3. Numerical Analysis Methods and Process
3.1 Governing Equations
To numerically simulate the CNT-based surface heating element method used for anti-icing, thermal heat flow was considered based on wind speed and temperature conditions in extreme environments. The analysis considered conjugate heat transfer for considering conduction phenomena through the heat source (heat flux) in the heating film to the upper solid layers of the heated walkway, as shown in
Fig. 3. For this analysis, the CFX tool in the ANSYS was used and the unsteady Reynolds-averaged Navier–Stokes equation as the governing equation was applied. The continuity equation and momentum equation are defined as
Eqs. (1) and
(2), respectively.
In
Eq. (2), τ represents the molecular stress tensor, which includes normal and shear components.
SM signifies the momentum term, representing the force acting per unit volume on the fluid. Additionally,
ρuiuj¯ denotes Reynolds stresses, which refer to the turbulent flow term added to the molecular diffusion flow (
ANSYS Inc., 2017). Another turbulence model, the
k–
ω shear stress transport (SST) model, was used to accurately represent the heat transfer phenomena on the surface of the heating element (
Lee et al., 2012). Through this, the Reynolds-averaged energy equation is defined in
Eq. (3), where
SE refers to the energy source term (
ANSYS Inc., 2017).
where
λ, htot, hstat, and
k represent the thermal conductivity coefficient, total enthalpy, and turbulent kinetic energy, respectively, as defined in
Eqs. (4)–
(5) (
ANSYS Inc., 2017).
Furthermore, considering the multi-layered structural characteristics between the materials of the heated walkway, the heat transfer phenomena between solids, known as conduction (
Qconv, solid–solid interface) were considered, which is defined in
Eq. (6) (
ANSYS Inc., 2017).
where
h denotes the heat transfer coefficient,
Ap represents the contact area between parts, and
Tp and
Tg indicate the temperatures between solids based on the conduction phenomenon.
3.2 Numerical Analysis Method and Boundary Conditions
The laboratory tests setup at KRISO were used for the numerical analysis and modeled the internal structural components, including a cold chamber and wind generation device (air inlet), identical to those used by
Lee et al. (2012). The schematic is shown in
Fig. 4(a). For the numerical analysis involving the surface heating element, the heating coil model from
Lee et al. (2012) with the surface heating element was replaced. The schematic is as shown in
Fig. 4(b). Any desks that did not directly impact the heat transfer phenomena in the heated walkway were considered fully insulated.
Additionally, in the design and performance testing of the prototype, the side structural components (plates and brackets) of the surface heating element and aluminum cover at the bottom were designed to be fully insulated, setting the boundary conditions as fully insulated. Each part and model generated within the CFX tool are shown in
Fig. 5(a). The air inlet, corresponding to the wind generation device, is represented by the green area. To improve the accuracy and time-efficiency of the analysis, a volumetric growth ratio of 1.2 was applied to the grid in areas closely related to the boundaries, based on a criterion of 0.1E−3 m (
Kim et al., 2011). The mesh of the entire model, including the cold chamber, is shown in
Fig. 5(b). It consists of approximately 860,000 elements and 240,000 nodes.
In this numerical analysis, the heat flux applied as a thermal boundary condition was identical to that used in the heating coil method by
Lee et al. (2012). The heat flux is shown in
Table 1; it is a converted value based on the power specifications used in the laboratory experiments and numerical analysis of the original heating coil method.
Lee et al. (2012) showed the average temperature results based on wind speed and heating coil conditions in their research. By comparing these laboratory experimental and numerical analysis results, a reliability in the proposed model and numerical analysis methods was established, indicated by an average temperature difference of ±1–3 °C.
In this numerical analysis, the heat flux was applied as a thermal boundary condition to the areas of the two silicone pads that are in direct contact with the heating film. The applied heat flux represents the thermal energy per unit area, and by multiplying it by the area of the heating film, the thermal energy (W) can be calculated.
Previous numerical results from studies using the heating coil method indicated that the air flow generated by the wind generation device caused substantial and rapid heat transfer phenomena owing to vortex formation and high wind speeds, depending on the shape of the heated walkway. Because the overall temperature distribution could appear asymmetric or irregular, the two-equation SST model, a turbulence model, was applied (
Lee et al., 2012).
3.3 Applied Physical Properties for Numerical Analysis
As the properties of air change with temperature, the density and thermal properties of air at low temperatures, as listed in
Table 2, were applied. This was necessary to account for the temperature-dependent properties of air, considering the turbulent flow caused by the high wind speed from the wind generation device and the potential laminar flow due to the shape of the heated walkway (
Jung and Seo, 2015).
Moreover, in the heated walkway method, solid-to-solid heat conduction occurs through a CNT-based heating film located at the center. To account for this, the material-specific density and thermal properties, such as specific heat and thermal conductivity, were applied, as listed in
Table 3, while the patterned steel plate used the standard properties of SS400 (
Park et al., 2023).
The insulation design on the sides and bottom of the heated walkway does not affect the primary outcome of the numerical analysis, which is the average temperature on the surface of the surface heating element. Therefore, additional structures, like the aluminum cover (AL6061), side structures, and bolts, were not considered in the numerical modeling. The CNT-based heating film was manufactured to have a thickness within 1 mm using compression equipment and was not considered in the modeling; instead, it was applied to the numerical analysis as a thermal boundary condition based on the contact area between materials.
4. Verification of Numerical Analysis Techniques
To validate the reliability of the numerical analysis techniques employed in this study, we referred to the study of
Lee et al. (2012), which applied the heating coil method in ambient and low-temperature environments, and the laboratory experimental results from KRISO (2012).
The cases for verifying the numerical analysis technique using the surface heating element method are listed in
Table 4. These are cases that
Lee et al. (2012) investigated by comparing laboratory experiments and numerical analysis results for heated walkways that utilized the heating coil method. The results of the cases showed an average temperature difference of ±1–3 °C depending on air temperature conditions, thus ensuring the reliability of the proposed model and numerical analysis technique.
In this study, numerical analysis techniques were verified by comparing it to the laboratory experimental and numerical analysis results of heated walkways using the heating coil method by
Lee et al. (2012), as shown in
Table 5.
Table 5 presents the average temperature results of numerical analysis using the heating coil method at an ambient temperature of 10 °C, where cases are determined based on external wind speed, coil interval, and heat flux.
Table 6 provides the numerical analysis results for the surface heating element method, corresponding to the average temperature results of the cases derived in
Table 5. The heat flux for the surface heating element method was identified to have an average temperature difference within a maximum range of 0.2 °C when compared to the heating coil method.
The numerical analysis for the surface heating element method applied the same boundary conditions for wind speed and air temperature as those in the laboratory experiments and numerical analyses in the existing heating coil method. The heat flux derived for the surface heating element method was significantly lower than that for the heating coil method.
Furthermore, by comparing the differences in heat flux magnitudes applied in the heating coil and surface heating element methods, the efficiency of the surface heating element method was found depending to the coil interval and heat flux to be between 80.17% and 56.65% at an external wind speed of 2 m/s and between 76.20% and 56.74% at 5 m/s.
Next, additional verification was conducted by applying the heat flux derived at an ambient temperature of 10 °C for the surface heating element method in
Table 6 to the cases in
Table 4 and compared the average temperature results of numerical analysis to the laboratory experiments and numerical analysis of the heating coil method. This is detailed in
Tables 7,
–
10. Compared to the ±1–3 °C average temperature difference observed in the numerical analysis of the heating coil method based on air temperature conditions, the surface heating element method showed a smaller average temperature difference of ±0.8–2 °C compared to the laboratory experimental results. This confirms that the numerical analysis model and techniques proposed in this study are reliable.
5. Numerical Analysis Results and Discussion
Building on the validation of numerical techniques in Chapter 4, the numerical analyses of the CNT-based surface heating element method under the same analysis conditions as
Lee et al. (2012) were conducted.
Fig. 6 displays a subset of these numerical analysis results. Among the numerical analysis results,
Fig. 6(a) shows the temperature distribution at the top surface of the heated walkway and the air flow field in the air inlet of the wind generation device.
Fig. 6(b) reveals that the surface temperature of the surface heating element method relatively drops owing to the influence of thermal heat flow, especially near the wind generation device affected by the external wind speed conditions.
To represent the thermal energy efficiency of the surface heating element method,
Tables 11,
–
13 present the average temperature results of the heated walkways under the lowest air temperature condition of −30 °C based on the heat flux conditions of the heating coil method. These results indicate that under extreme air temperature conditions, some cases fail to meet the anti-icing requirements, showing negative average temperatures on the heated walkway. Therefore, it suggests that heated walkways using the existing heating coil method require more thermal energy and heat flux to satisfy anti-icing technology requirements.
To demonstrate the performance of the CNT-based surface heating element method, the external environmental conditions and heat flux of the heating coil were applied, which failed to meet the anti-icing technology requirements in the previous heating coil method, to the numerical analysis. Then, the average temperature results of the heated walkway accordingly were displayed.
Fig. 7 shows that at the lowest air temperature of −30 °C, the results ranged from 34.97 °C at 7 m/s to 129.2 °C at 1 m/s, depending on the wind speed generated by the wind generation device. The average temperature results, derived from applying the minimum heat flux of the coil to the CNT-based heating film, were higher than the results for the case applying the maximum heat flux of the coil. Although the smallest heat source value from the heating coil method was used, the surface heating element method exceeded the anti-icing technology requirements even under extreme external environmental conditions.
Park et al. (2023) state that current ice-class ships require winterization technology at lower air temperatures than those of extreme conditions applied in the existing heating coil method.
Table 14 shows the average temperature results of the heated walkway under the external wind speed conditions, applying the heat flux of the existing heating coil method at an air temperature of −45 °C.
Fig. 8 displays the temperature distribution at the top of the heated walkway under the strongest wind speed condition of 7 m/s from analysis conditions of
Table 14. Although the average temperature of the heated walkway was lower than that under the previous −30 °C ambient condition, the heated walkway maintained the positive temperature, thus satisfying the anti-icing conditions.
However, applying the same heat source from the existing heating coil method to the surface heating element method seems excessive and inefficient from an energy efficiency standpoint. To address this, it seems necessary to derive and apply the optimal heat flux needed to maintain room temperature under varying external environmental conditions for anti-icing, similar to those shown in
Table 6 derived to validate the numerical analysis technique in Chapter 4.
6. Conclusions
In this study, the conventional heating coil method with the surface heating element method for the anti-icing and winterization design of heated walkways located on the upper deck of ice-class ships were compared and analyzed. The analysis was performed through heat transfer and computational fluid dynamics numerical analysis. The findings can be summarized as follows.
The numerical analysis of the CNT-based surface heating element method considered forced convection from a wind generation device and turbulence characteristics in forced specimens. Various factors, such as numerical analysis tools, turbulence models, and heat transfer characteristics, were applied.
To validate the efficiency of the surface heating element method in contrast to the conventional heating coil method, the heated walkway—a CNT-based surface heating element for shipping equipment developed by Yu et al. (2022) was referenced—for our numerical analysis. The parameters were determined based on the numerical analysis results of Lee et al. (2012) under positive temperature conditions and validated through laboratory experiments results and additional numerical analysis.
The average temperature results of the heated walkways for verification demonstrated that the surface heating element method yielded results similar to laboratory experiment outcomes than the conventional heating coil method, with the efficiency derived from the difference in heat flux between the two methods. The surface heating element method displayed high efficiency, ranging from a minimum of 56.65% to a maximum of 80.17%, depending on the coil interval and heat flux conditions of the heating coil method.
The surface heating element method was applied in the numerical analysis as a substitute in certain cases where the conventional heating coil method failed to meet anti-icing conditions. The average temperature of the heated walkways satisfied the minimum anti-icing condition of 34.97 °C when the same heat flux was applied. Additionally, the heated walkways maintained positive temperature for anti-icing even in conditions as low as −45 °C, which is lower than the conventional air temperature conditions.
In this study, the numerical analyses were conducted using a CNT-based surface heating element method verified against the conventional heating coil method. The findings suggest the need to derive and apply the optimal heat flux for heating films in various external environmental conditions to achieve a more economical and efficient design than the conventional heating coil method.
Conflict of Interest
The authors declare that they have no conflict of interests.
Funding
This research was conducted with the support of the Ministry of Education and the National Research Foundation of Korea as part of Leading University Industry-University Cooperation 3.0 (LINC 3.0).
Fig. 1.
Schematic of sea spray icing on ice class ships in cold region
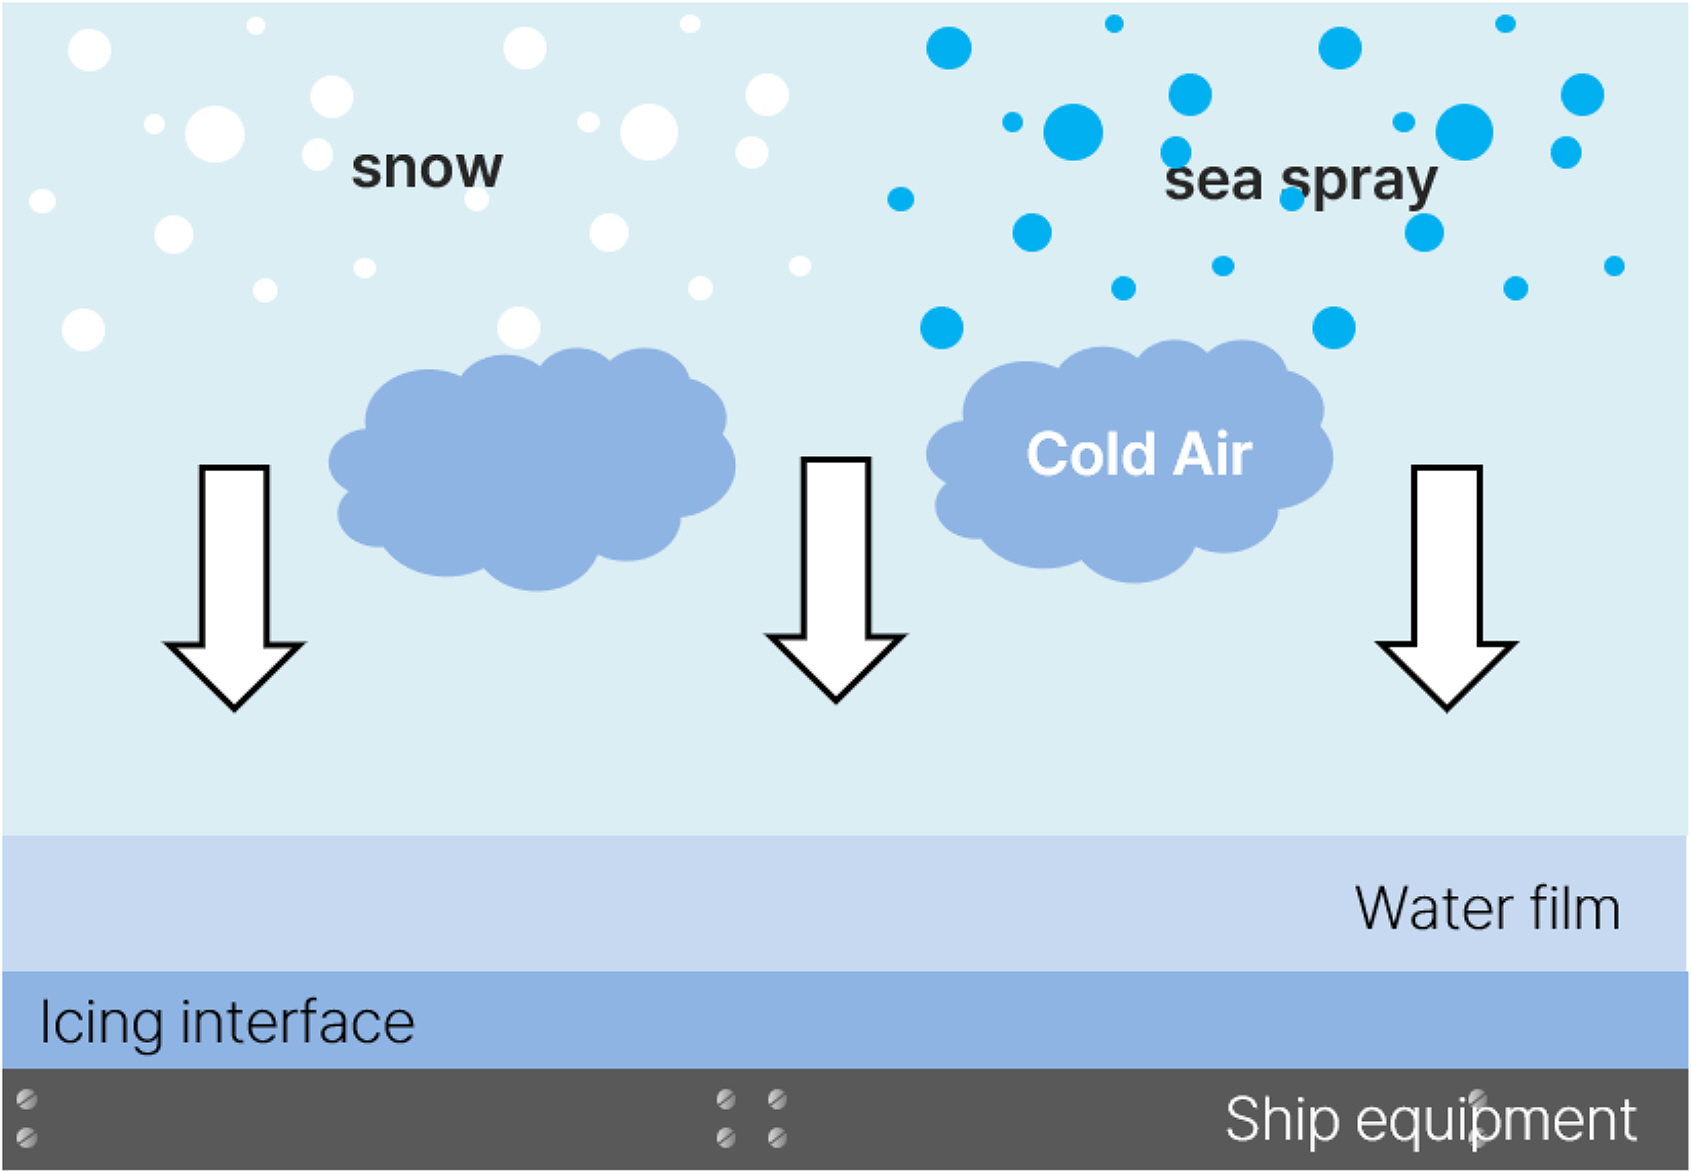
Fig. 2.
Comparison of the thermal diffusion of different heating methods: (a) Heating coil and (b) Surface heating element
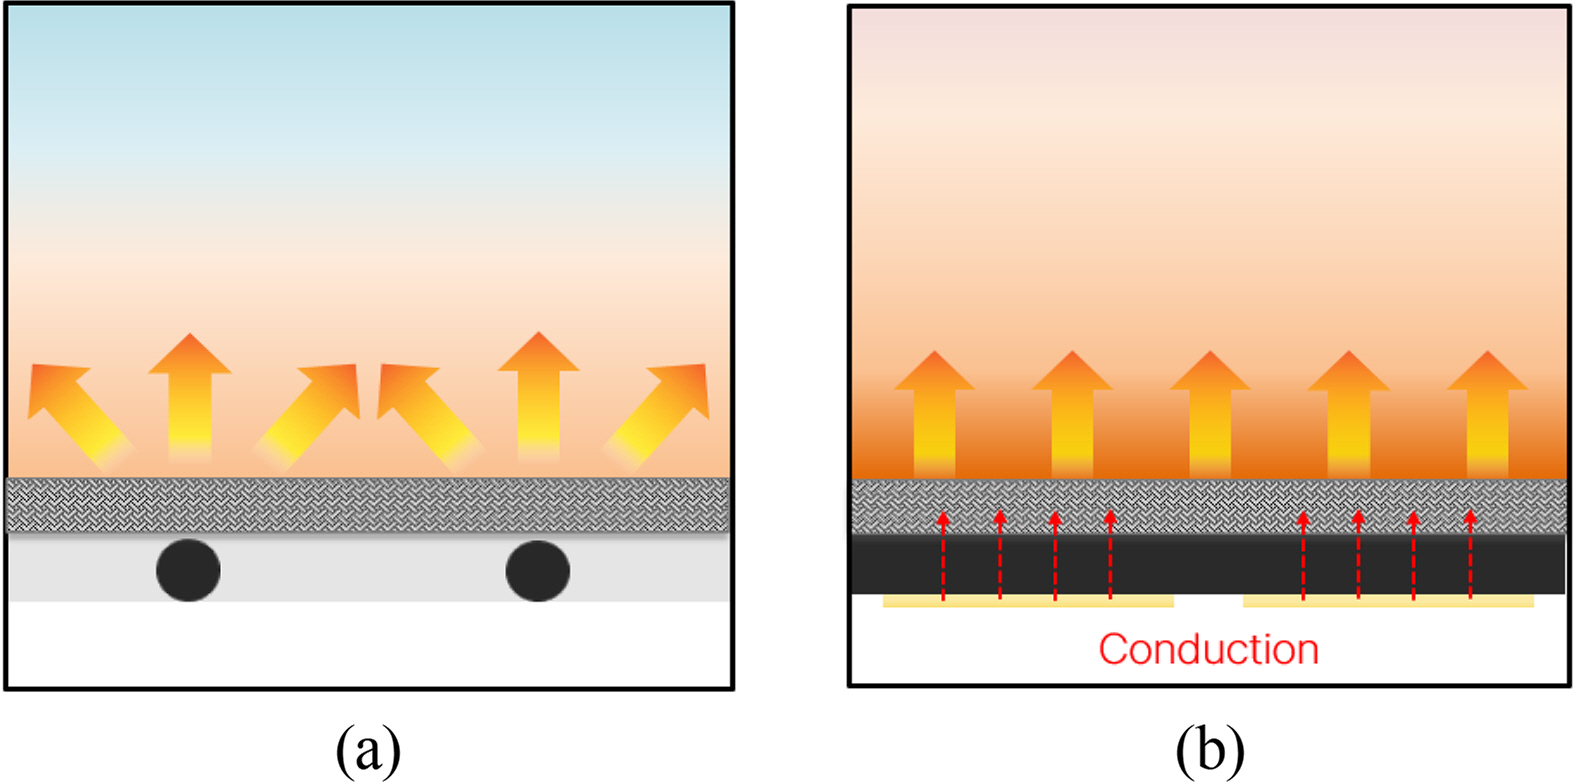
Fig. 3.
Schematic of the surface heating element in the walkway
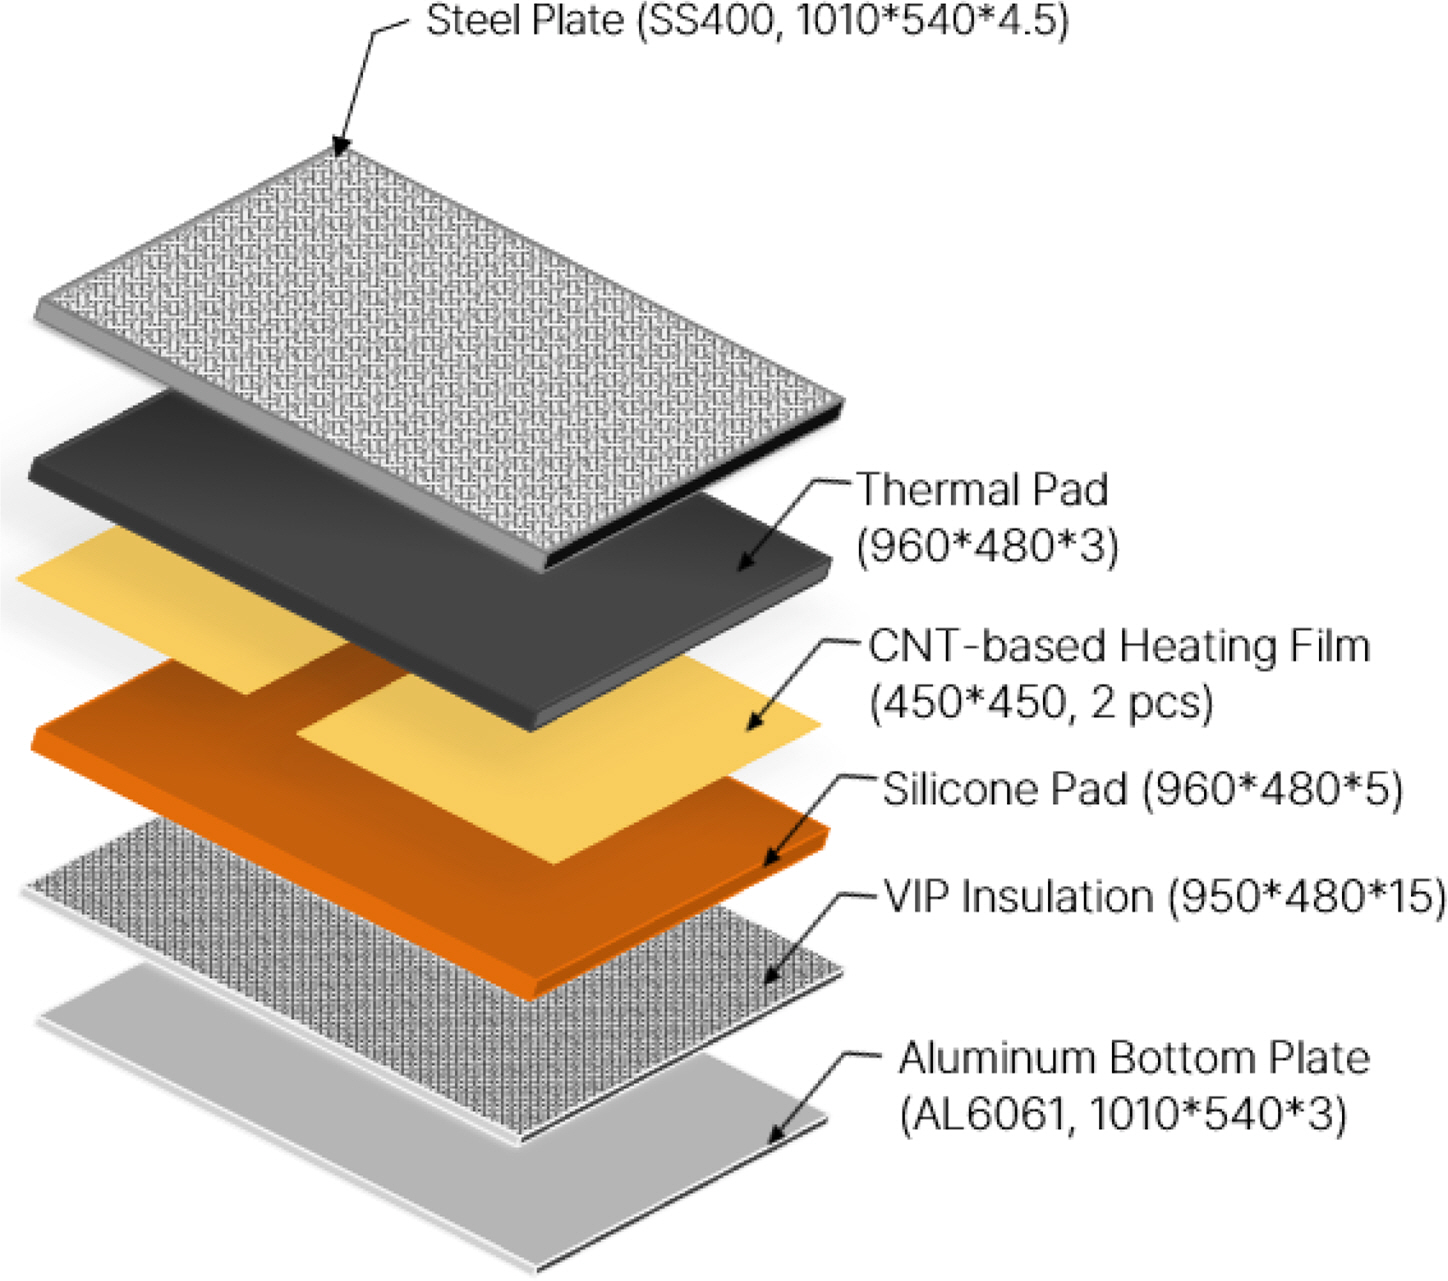
Fig. 4.
Conceptual diagram of numerical analysis: (a) heating coil (
Lee et al., 2012) and (b) surface heating element

Fig. 5.
Modeling in ANSYS CFX: (a) geometry and (b) mesh
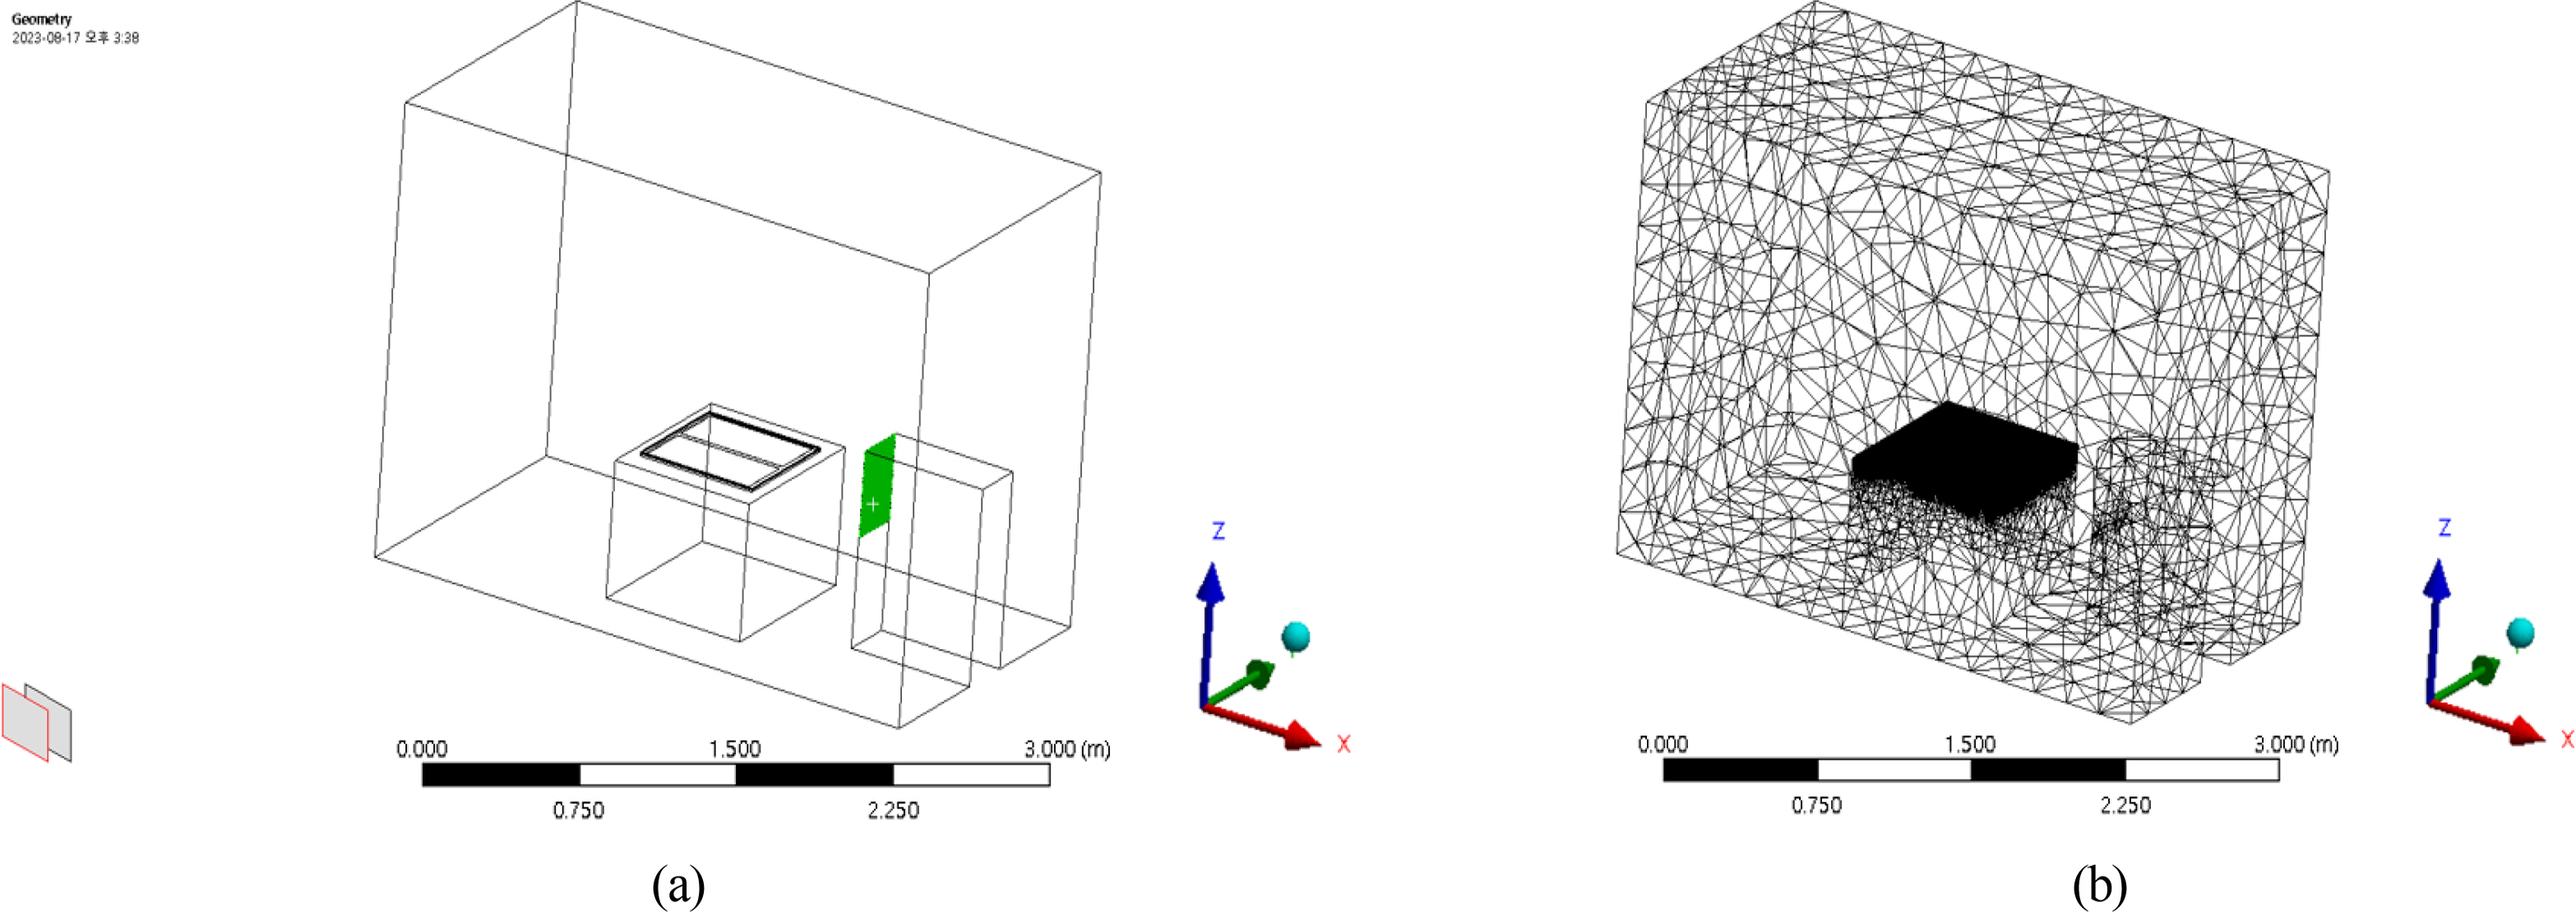
Fig. 6.
Contour cut of numerical analysis results: (a) 3D view and (b) XY plane
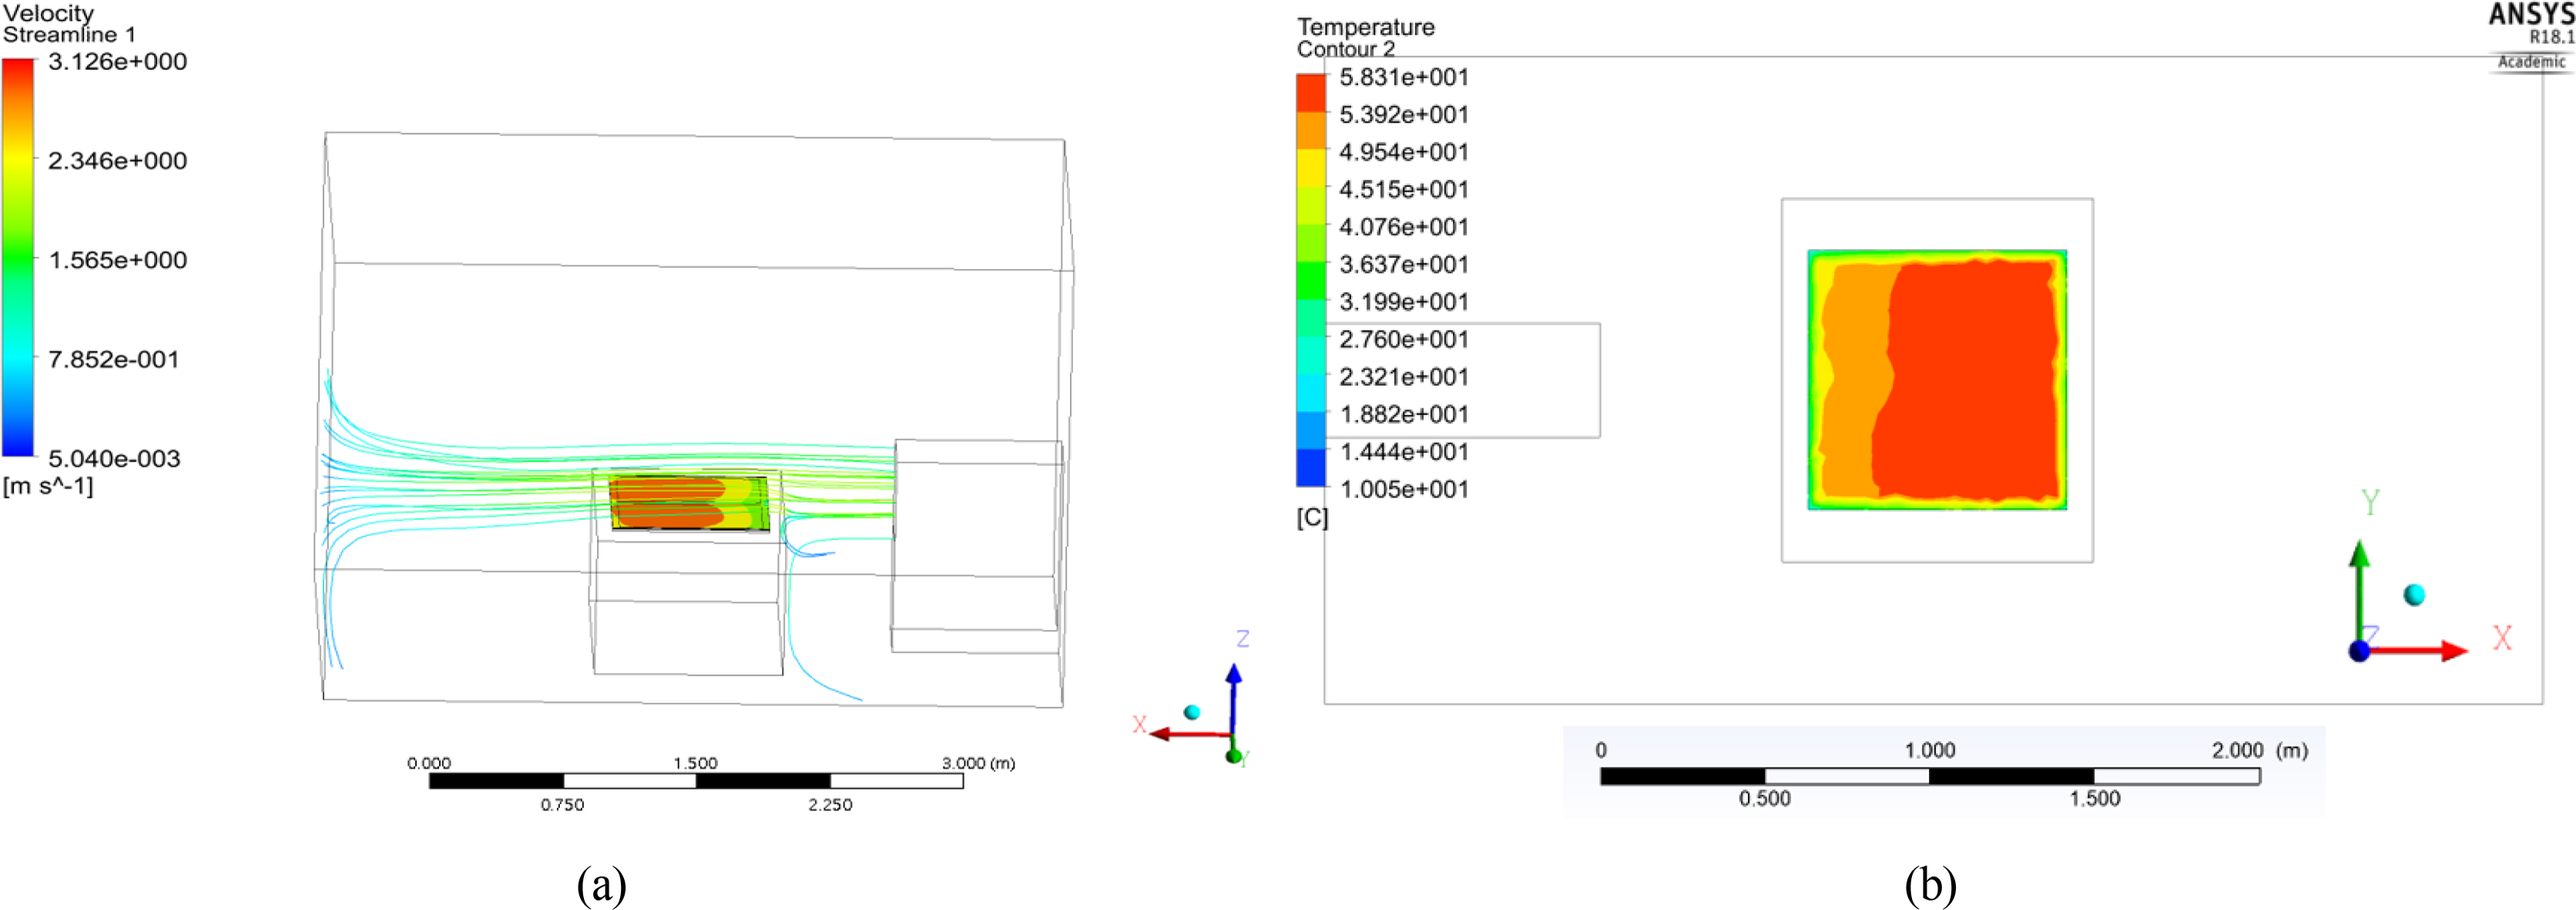
Fig. 7.
Comparison of the average temperature of the heating coil and surface heating element on each air inlet (−30 °C)
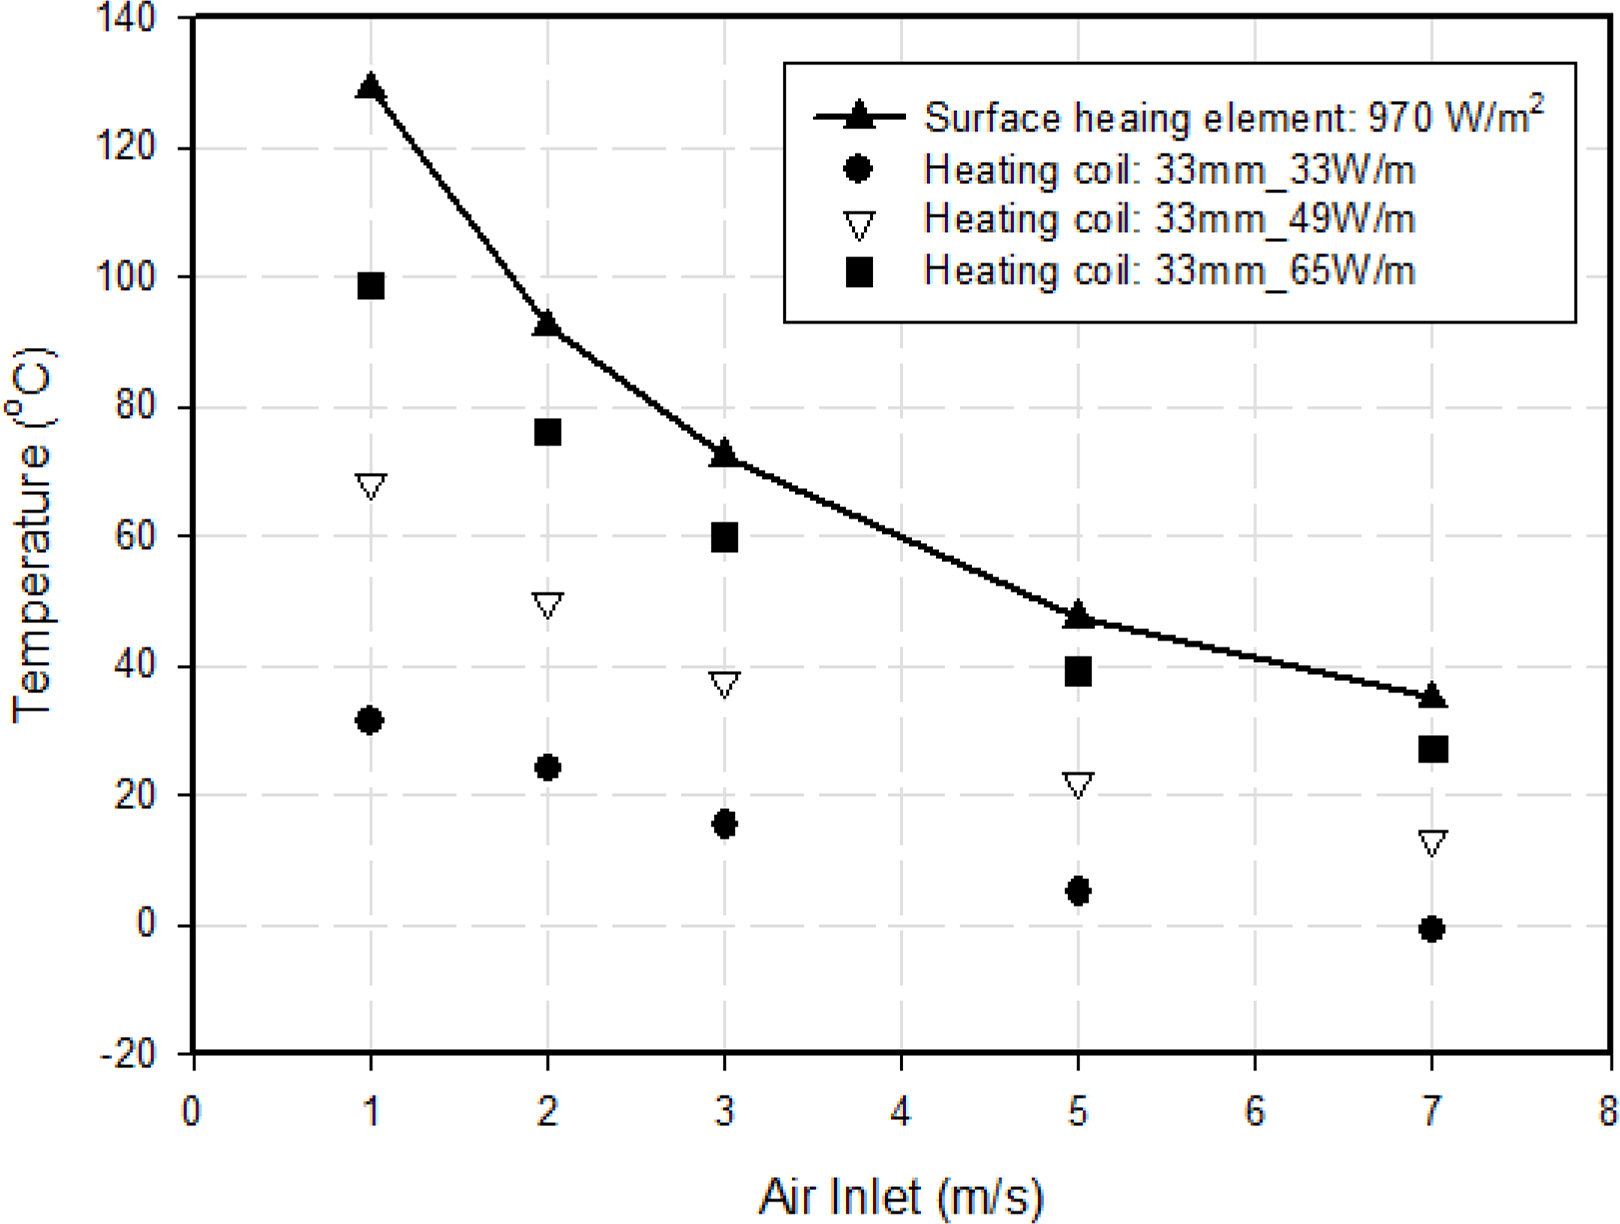
Fig. 8.
Temperature distribution of numerical analysis results (case conditions: −45 °C, 7 m/s): (a) 970 W/m2, (b) 1441.17 W/m2, and (c) 1911.76 W/m2

Table 1.
|
Heating cable product |
Nominal electric power output (W/m at 10 °C) |
Heat flux (W/m2) |
|
10XTV_CT |
33 |
970.00 |
|
15XTV_CT |
49 |
1441.17 |
|
20XTV_CT |
65 |
1911.76 |
Table 2.
|
Temperature (°C) |
Density (kg/m3) |
Specific heat capacity (J/kg·K) |
Thermal conductivity (W/m·K) |
Expansion coefficient (1/K) |
Dynamic viscosity (kg/m·s) |
|
20 |
1.204 |
1.006 |
0.026 |
0.0034 |
1.83E-5 |
|
10 |
1.246 |
1.005 |
0.025 |
0.0036 |
1.78E-5 |
|
0 |
1.292 |
1.005 |
0.024 |
0.0037 |
1.73E-5 |
|
−15 |
1.341 |
1.005 |
0.023 |
0.0039 |
1.66E-5 |
|
−30 |
1.394 |
1.005 |
0.022 |
0.0041 |
1.58E-5 |
|
−45 |
1.547 |
1.005 |
0.021 |
0.0044 |
1.50E-5 |
Table 3.
|
Material |
Density (kg/m3) |
Specific heat capacity (J/kg·K) |
Thermal conductivity (W/m·K) |
|
Steel (SS400) |
7850 |
480 |
60.5 |
|
Thermal pad (3T) |
2100 |
1000 |
2.25 |
|
Silicone pad (5T) |
650 |
1400 |
0.570 |
|
VIP insulation |
210 |
850 |
0.0043 |
Table 4.
|
Case |
Wind speed (m/s) |
Interval (mm) |
Heat flux (W/m2) |
|
Case 2–5 |
2 |
65 |
1441.17 |
|
Case 2–7 |
110 |
970 |
|
Case 4–5 |
5 |
65 |
1441.17 |
|
Case 4–7 |
110 |
970 |
Table 5.
Numerical analysis of average temperature in the heating coil: Case 2, 4 (air temperature: 10 °C)
|
Wind speed (m/s) |
2 |
|
|
Case No. |
2-1 |
2-2 |
2-3 |
2-4 |
2-5 |
2-6 |
2-7 |
2-8 |
2-9 |
|
Interval (mm) |
|
33 |
|
|
65 |
|
|
110 |
|
|
Heat flux (W/m2) |
970.00 |
1441.17 |
1911.76 |
970.00 |
1441.17 |
1911.76 |
970.00 |
1441.17 |
1911.76 |
|
Heating coil temperature (°C) |
62.2 |
87.7 |
112 |
40.8 |
56.2 |
56.8 |
37.7 |
51.1 |
73.6 |
|
|
Wind speed (m/s) |
5 |
|
|
Case No. |
4-1 |
4-2 |
4-3 |
4-4 |
4-5 |
4-6 |
4-7 |
4-8 |
4-9 |
|
Interval (mm) |
|
33 |
|
|
65 |
|
|
110 |
|
|
Heat flux (W/m2) |
970.00 |
1441.17 |
1911.76 |
970.00 |
1441.17 |
1911.76 |
970.00 |
1441.17 |
1911.76 |
|
Heating coil temperature (°C) |
44.6 |
61.4 |
80.1 |
30.4 |
40.0 |
51.2 |
29.6 |
39.0 |
52.6 |
Table 6.
Numerical analysis of average temperature in the surface heating element: Case 2, 4 (air temperature: 10 °C)
|
Wind speed (m/s) |
2 |
|
|
Case No. |
2-1 |
2-2 |
2-3 |
2-4 |
2-5 |
2-6 |
2-7 |
2-8 |
2-9 |
|
Average temperature (°C) |
62.19 |
87.68 |
112.2 |
40.78 |
56.15 |
56.77 |
37.66 |
51.19 |
73.55 |
|
Heat flux (W/m2) |
420.2 |
624.7 |
821.8 |
249.2 |
373.3 |
379 |
223 |
333.7 |
1911.76 |
|
Efficiency (%) |
56.68 |
56.65 |
57.01 |
74.31 |
74.10 |
80.17 |
77.01 |
76.85 |
73.6 |
|
|
Wind speed (m/s) |
5 |
|
|
Case No. |
4-1 |
4-2 |
4-3 |
4-4 |
4-5 |
4-6 |
4-7 |
4-8 |
4-9 |
|
Average temperature (°C) |
44.78 |
61.30 |
80.11 |
30.27 |
40.11 |
51.22 |
29.68 |
39.08 |
52.69 |
|
Heat flux (W/m2) |
407.5 |
605 |
827 |
238.8 |
354.8 |
485.4 |
232 |
343 |
504.5 |
|
Efficiency (%) |
57.99 |
58.02 |
56.74 |
75.38 |
75.38 |
74.61 |
76.08 |
76.20 |
73.61 |
Table 7.
Numerical analysis and experimental results: Case 2-5
|
Air temperature (°C) |
Results |
|
|
Heating coil (Interval: 65 mm) |
Surface heating element |
|
|
Experiments (KRISO, 2012) |
Numerical analysis (Lee et al., 2012) |
Present study (Numerical analysis) |
|
10 |
53.2 |
56.2 |
56.15 |
|
0 |
46.3 |
48.7 |
46.13 |
|
−10 |
37.2 |
37.1 |
36.99 |
|
−20 |
27.8 |
26.9 |
26.99 |
|
−30 |
18.2 |
16.7 |
17.79 |
Table 8.
Numerical analysis and experimental results: Case 2-7
|
Air temperature (°C) |
Results |
|
|
Heating coil (Interval: 110mm) |
Surface heating element |
|
|
Experiments (KRISO, 2012) |
Numerical analysis (Lee et al., 2012) |
Present study (Numerical analysis) |
|
10 |
36.4 |
37.7 |
37.66 |
|
0 |
26.7 |
28.2 |
27.53 |
|
−10 |
17.0 |
19.0 |
17.53 |
|
−20 |
10.5 |
9.5 |
10.53 |
|
−30 |
−2.0 |
−0.4 |
−1.98 |
Table 9.
Numerical analysis and experimental results: Case 4-5
|
Air temperature (°C) |
Results |
|
|
Heating coil (Interval: 65mm) |
Surface heating element |
|
|
Experiments (KRISO, 2012) |
Numerical analysis (Lee et al., 2012) |
Present study (Numerical analysis) |
|
10 |
37.8 |
40.0 |
40.11 |
|
0 |
28.7 |
31.7 |
30.08 |
|
−10 |
21.2 |
21.5 |
21.09 |
|
−20 |
11.3 |
10.7 |
11.08 |
|
−30 |
2.1 |
0.54 |
1.89 |
Table 10.
Numerical analysis and experimental results: Case 4-7
|
Air temperature (°C) |
Results |
|
|
Heating coil (Interval: 110mm) |
Surface heating element |
|
|
Experiments (KRISO, 2012) |
Numerical analysis (Lee et al., 2012) |
Present study (Numerical analysis) |
|
10 |
27.2 |
29.6 |
29.68 |
|
0 |
20.5 |
19.8 |
20.67 |
|
−10 |
10.0 |
9.9 |
10.17 |
|
−20 |
0.0 |
0.1 |
0.175 |
|
−30 |
−10 |
−9.7 |
−10.23 |
Table 11.
Numerical analysis of the average temperature at −30 °C, 33 W/m (
Lee et al., 2012)
|
Interval (mm) |
Wind speed (m/s) |
|
|
1 |
2 |
3 |
5 |
7 |
|
33 |
31.4 |
24.0 |
15.5 |
5 |
−0.9 |
|
65 |
15.8 |
1.6 |
−3.5 |
−9.4 |
−12.6 |
|
110 |
9.1 |
−0.4 |
−3.9 |
−9.7 |
−13.0 |
Table 12.
Numerical analysis of the average temperature at −30 °C, 49 W/m (
Lee et al., 2012)
|
Interval (mm) |
Wind speed (m/s) |
|
|
1 |
2 |
3 |
5 |
7 |
|
33 |
68.3 |
49.9 |
37.7 |
22.2 |
13.3 |
|
65 |
28.34 |
16.7 |
9.9 |
0.5 |
−2.2 |
|
110 |
22.4 |
13.9 |
8.5 |
1.0 |
−4.7 |
Table 13.
Numerical analysis of the average temperature at −30 °C, 65 W/m (
Lee et al., 2012)
|
Interval (mm) |
Wind speed (m/s) |
|
|
1 |
2 |
3 |
5 |
7 |
|
33 |
98.8 |
76.1 |
59.9 |
39.2 |
27.3 |
|
65 |
49.5 |
39.5 |
28.2 |
15.6 |
6.1 |
|
110 |
46.9 |
31.2 |
23.3 |
11.8 |
4.2 |
Table 14.
Numerical analysis of the average temperature at −45 °C (surface heating element)
|
Heat flux (W/m2) |
Wind speed (m/s) |
|
|
1 |
2 |
3 |
5 |
7 |
|
970 |
114.5 |
77.48 |
57.33 |
32.49 |
19.97 |
|
1441.17 |
189.6 |
137.3 |
107.4 |
70.20 |
51.53 |
|
1911.76 |
265.2 |
196.8 |
157.6 |
107.9 |
83.05 |
References
ANSYS Inc. (2017). ANSYS CFX-Solver theory guide (Release 18.1), ANSYS Inc.
B. P. Technology Transaction. (2017). Surface heating element (center on CNT), Interesting Media, Inc.
Det Norske Veritas (DNV). (2005). DNV rules for classification of ships, DNV.
International Maritime Organization (IMO). (2015). International code of safety for ships operating in polar waters (Polar code), A.1024(26)..
Jung, Y. J., & Seo, Y. K. (2015). A study on the de-icing performance evaluation and design guide for ice class louver of the vessels operating in cold region.
Journal of the Society of Naval Architects of Korea,
52(4), 323-329.
https://doi.org/10.3744/SNAK.2015.52.4.323

Kim, Y. K., Yang, J. S., Kim, K. C., & Ji, H. S. (2011). Numerical study on the performance assessment for defrost and de-icing modes.
Transactions of the Korean Society of Mechanical Engineers B,
35(2), 161-168.
https://doi.org/10.3795/KSME-B.2011.35.2.161
Lee, J. C., Seo, Y. K., & Lee, C. J. (2012). A study on the anti-icing performance evaluating and design uide by Heating Coil for Upper Deck of Icebreaking Vessels.
Journal of the Society of Naval Architects of Korea,
49(6), 541-549.
https://doi.org/10.3744/SNAK.2012.49.6.541
Korea Research Institute of Ships & Ocean Engineering (KRISO). (2013). Development of Polar Route Safety Operation Technology and Cryogenic Ice Performance Test Evaluation Techniques for Ice Class Ships, (TRKO201500009099)..
Ministry of Knowledge Economy. (2012). Cold region design specification and winterization, (PNS133C)..
Park, W. J., Park, D. S., Shin, M. B., & Seo, Y. K. (2023). Evaluation of surface heating element performance installed under the walkway through the numerical analysis. the 2023 Joint Academic Conference of The Korean Association of Ocean Science and Technology Societies.
Vargaftic, N. B. (1972). Handbook Thermophysical Properties of Gases and Liquids. Nauka Publishing House.
Yu, S. H., Kim, T. S., & Kim, S. H. (2022). Machined surface texture monitoring using acoustic emission signals in micro milling process. Proceedings of the 10th International Conference of Manufacturing Technology Engineers (ICMTE).


