1. Introduction
A tsunami is a phenomenon triggered by the displacement of the seafloor or the release of energy from an undersea earthquake or volcanic eruption. This event leads to alterations in water levels that propagate over great distances, eventually impacting coastlines with considerable force and causing extensive flooding in coastal areas. As the tsunamis advance, they carry coastal debris, which can collide with structures and inflict substantial damage. Factors such as flow velocity, debris collision, and scour cumulatively affect structures in the tsunami's path (Charvet et al., 2015). Consequently, isolating the damage caused by drifting objects during post-tsunami assessments is challenging. While studies have shown that debris collision can result in structural damage and elevate the risk of building collapse, these collision forces have not been extensively incorporated into structural design considerations (Naito et al., 2014). Moreover, a numerical analysis by Ma et al. (2021) that modeled typical wooden buildings in coastal areas found that including remnants of collapsed structures in their simulations led to a remarkable 150% increase in building failures due to tsunami forces.
Charvet et al. (2015) conducted a vulnerability analysis, concluding that the impact force exerted by floating objects during a tsunami is a crucial determinant of structural collapse risk. Similarly, Palermo et al. (2013) conducted a field investigation of the 2010 Chile Tsunami, finding that impact forces generated by large drifting objects could devastate most structures, especially critical load-bearing components like columns. In the 2011 Tohoku Tsunami, numerous structures succumbed to collision damage from floating debris, including drifting objects (Naito et al., 2014). Furthermore, instances of collision damage involving drifting objects such as storage tanks, trucks, and ships was documented during the 2018 Sunda Strait Tsunami (Stolle et al., 2020).
To understand secondary disaster aspects of tsunamis, such as the collision risks posed by drifting objects, it's essential to first study the behavior of these objects in fluid motion. In this context, Kim et al. (2023) utilized an OpenCV library-based red-green-blue (RGB) analysis approach to track the position of a drifting container affected by a solitary wave cresting over a revetment. This method remains effective even when the drifting objects are overturned as long as the RGB values for the object's side or bottom fall within a predefined range. However, the approach has limitations: it can only track the center of a recognized object, making it less effective at monitoring spinning objects or tracking multiple drifting objects simultaneously.
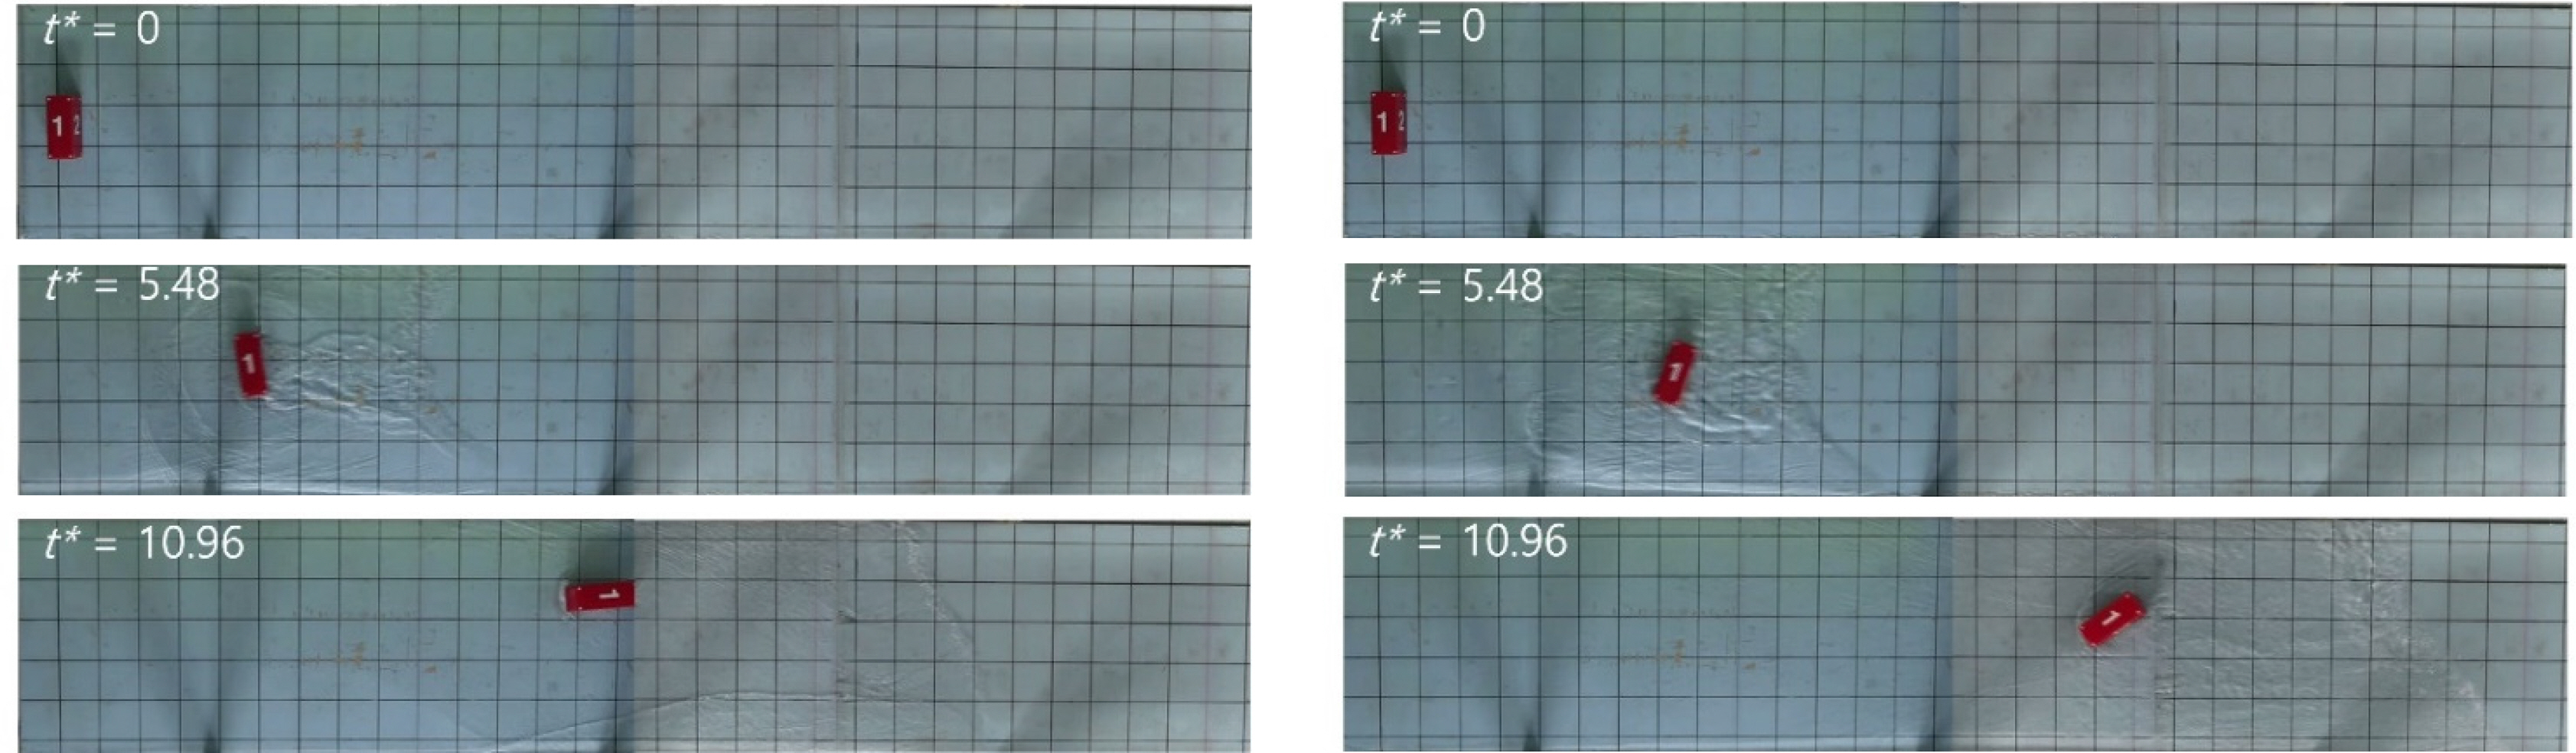
To overcome these limitations, this study employs the motion analysis program digital image post-processing motion (DIPP-Motion) to track the position of a drifting container affected by solitary waves. We used images from a laboratory experiment conducted by Kim et al. (2023) for this purpose. Five markers were placed on the container: one at each of its four corners and one at the top center. The positions of the drifting objects were then tracked, considering the scale of the solitary wave and the object's weight. This method also allowed for a detailed examination of object behaviors, such as rotation.
2. Method
2.1 Laboratory Experiment
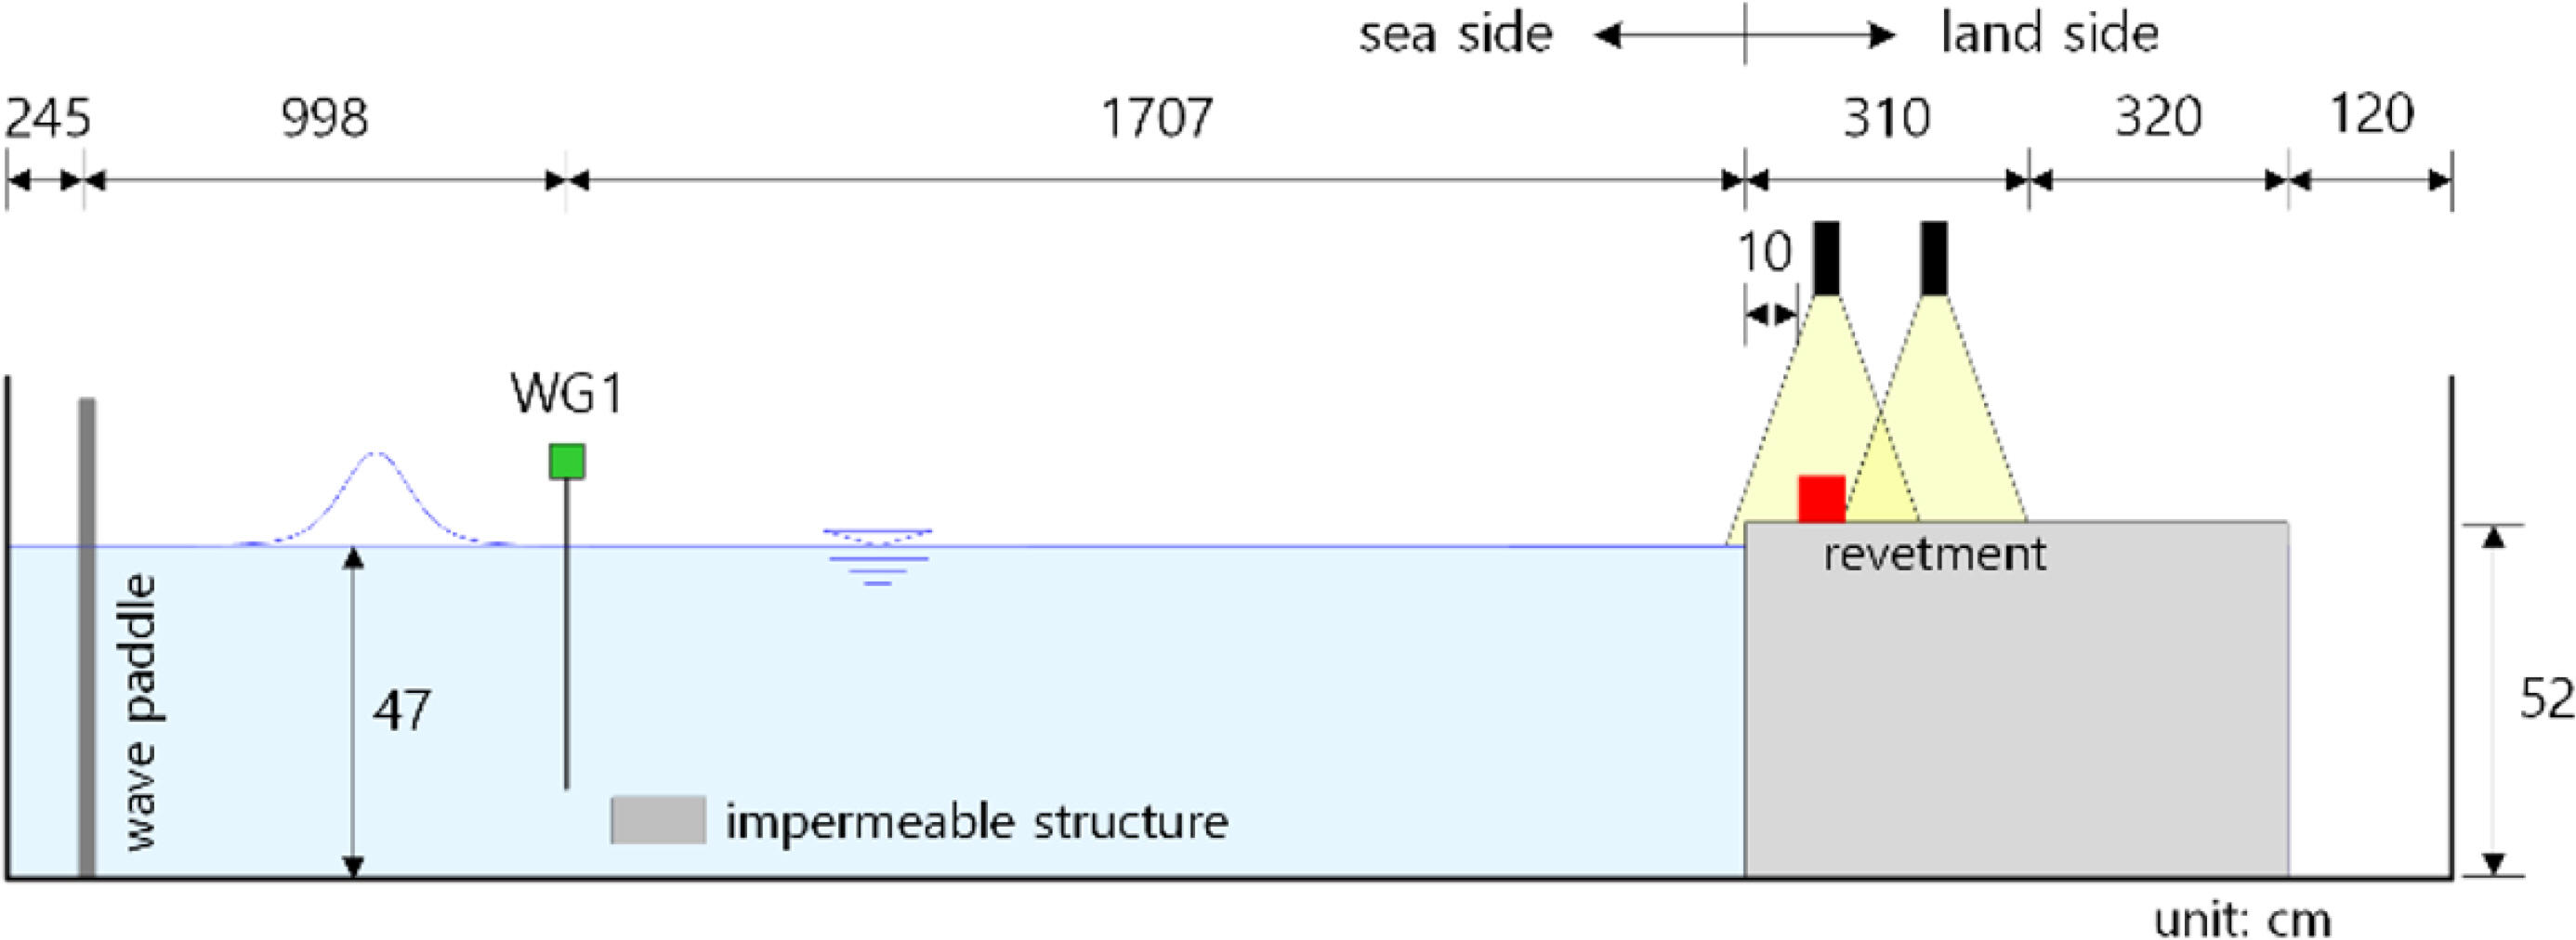
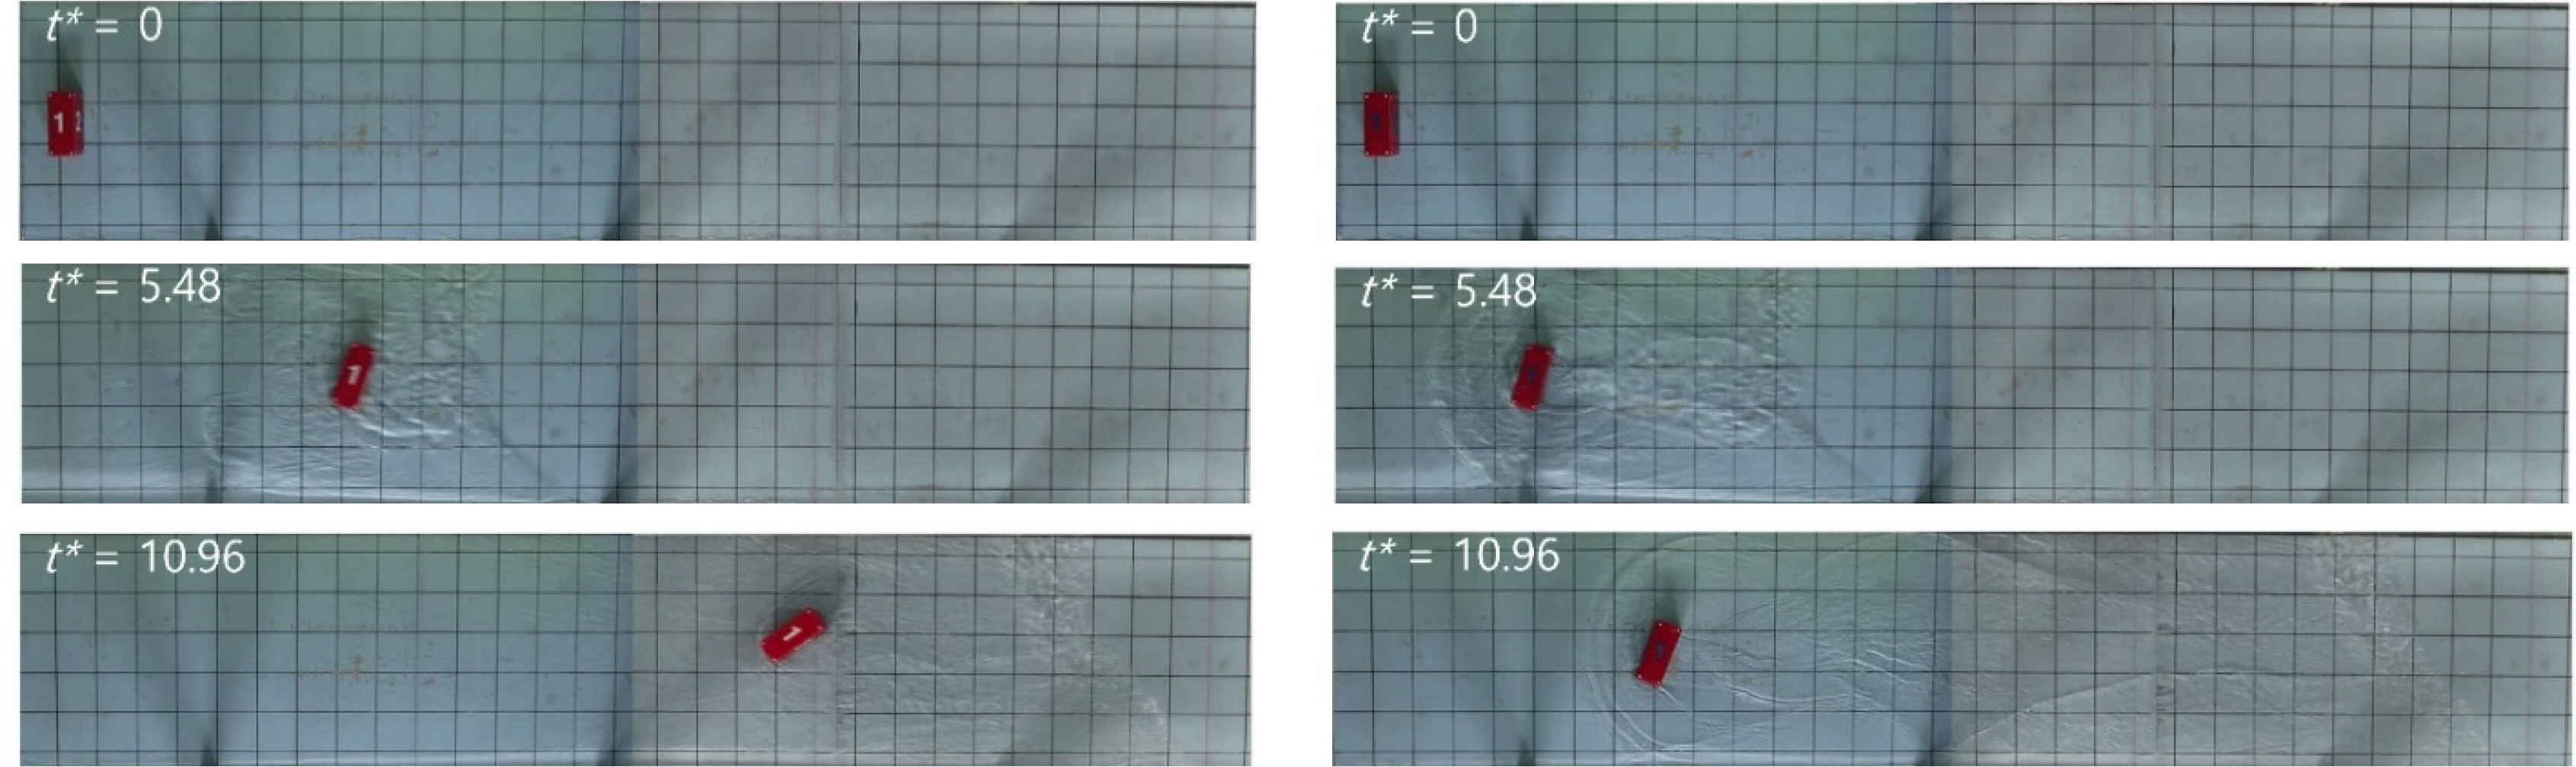
Kim et al. (2023) captured images of containers in motion within a two-dimensional wave tank measuring 37 m in length, 0.6 m in width, 1 m in height, and a water depth (h) of 47 cm. In this experiment, a freeboard (Fb) with a surface height of 5 cm and a total height of 52 cm ―constructed from waterproof plywood―is positioned 27.05 m away from the wave paddle, as depicted in Fig. 1. The average roughness of the painted revetment's vertical walls and the land area floor is 0.56 mm. As detailed in Table 1, 1/40-scale container models situated 10 cm from the vertical wall are categorized into two types: half-full (Model-A; Wtotal =W0 +Wmax/2) and full models (Model-B; Wtotal =W0 +Wmax). These acrylic container models were fabricated according to International Organization for Standardization (ISO) specifications. Table 2 outlines the experimental conditions related to solitary wave heights (A) employed by Kim et al. (2023).
Two cameras were mounted on the revetment to capture a 310-cm section. The images were taken at approximately 0.0167 s intervals, equating to 60 frames per second (fps). Grids were marked on the revetment at 10 cm intervals for drift distance measurement and camera calibration, as shown in Fig. 2.
2.2 DIPP-Motion
In this study, DIPP-Motion (DITECT, 2023), a motion analysis program, was used to assess the drifting behavior of containers affected by solitary waves. The program tracks specified markers by converting the analysis region into grayscale. Using a 10 cm × 10 cm grid scale projected onto the floor of the land area, the distance per pixel can be estimated. Subsequently, a total of five markers are set: one at the center point on the container's upper surface and one at each of its four corners. The program then tracks the container as it drifts due to the solitary wave, as shown in Fig. 2. Velocity and acceleration are calculated based on the markers' initial location and subsequent positions in each frame, factoring in the time interval between the captured image frames.
3. Results
3.1 Effect of Solitary Wave Scale
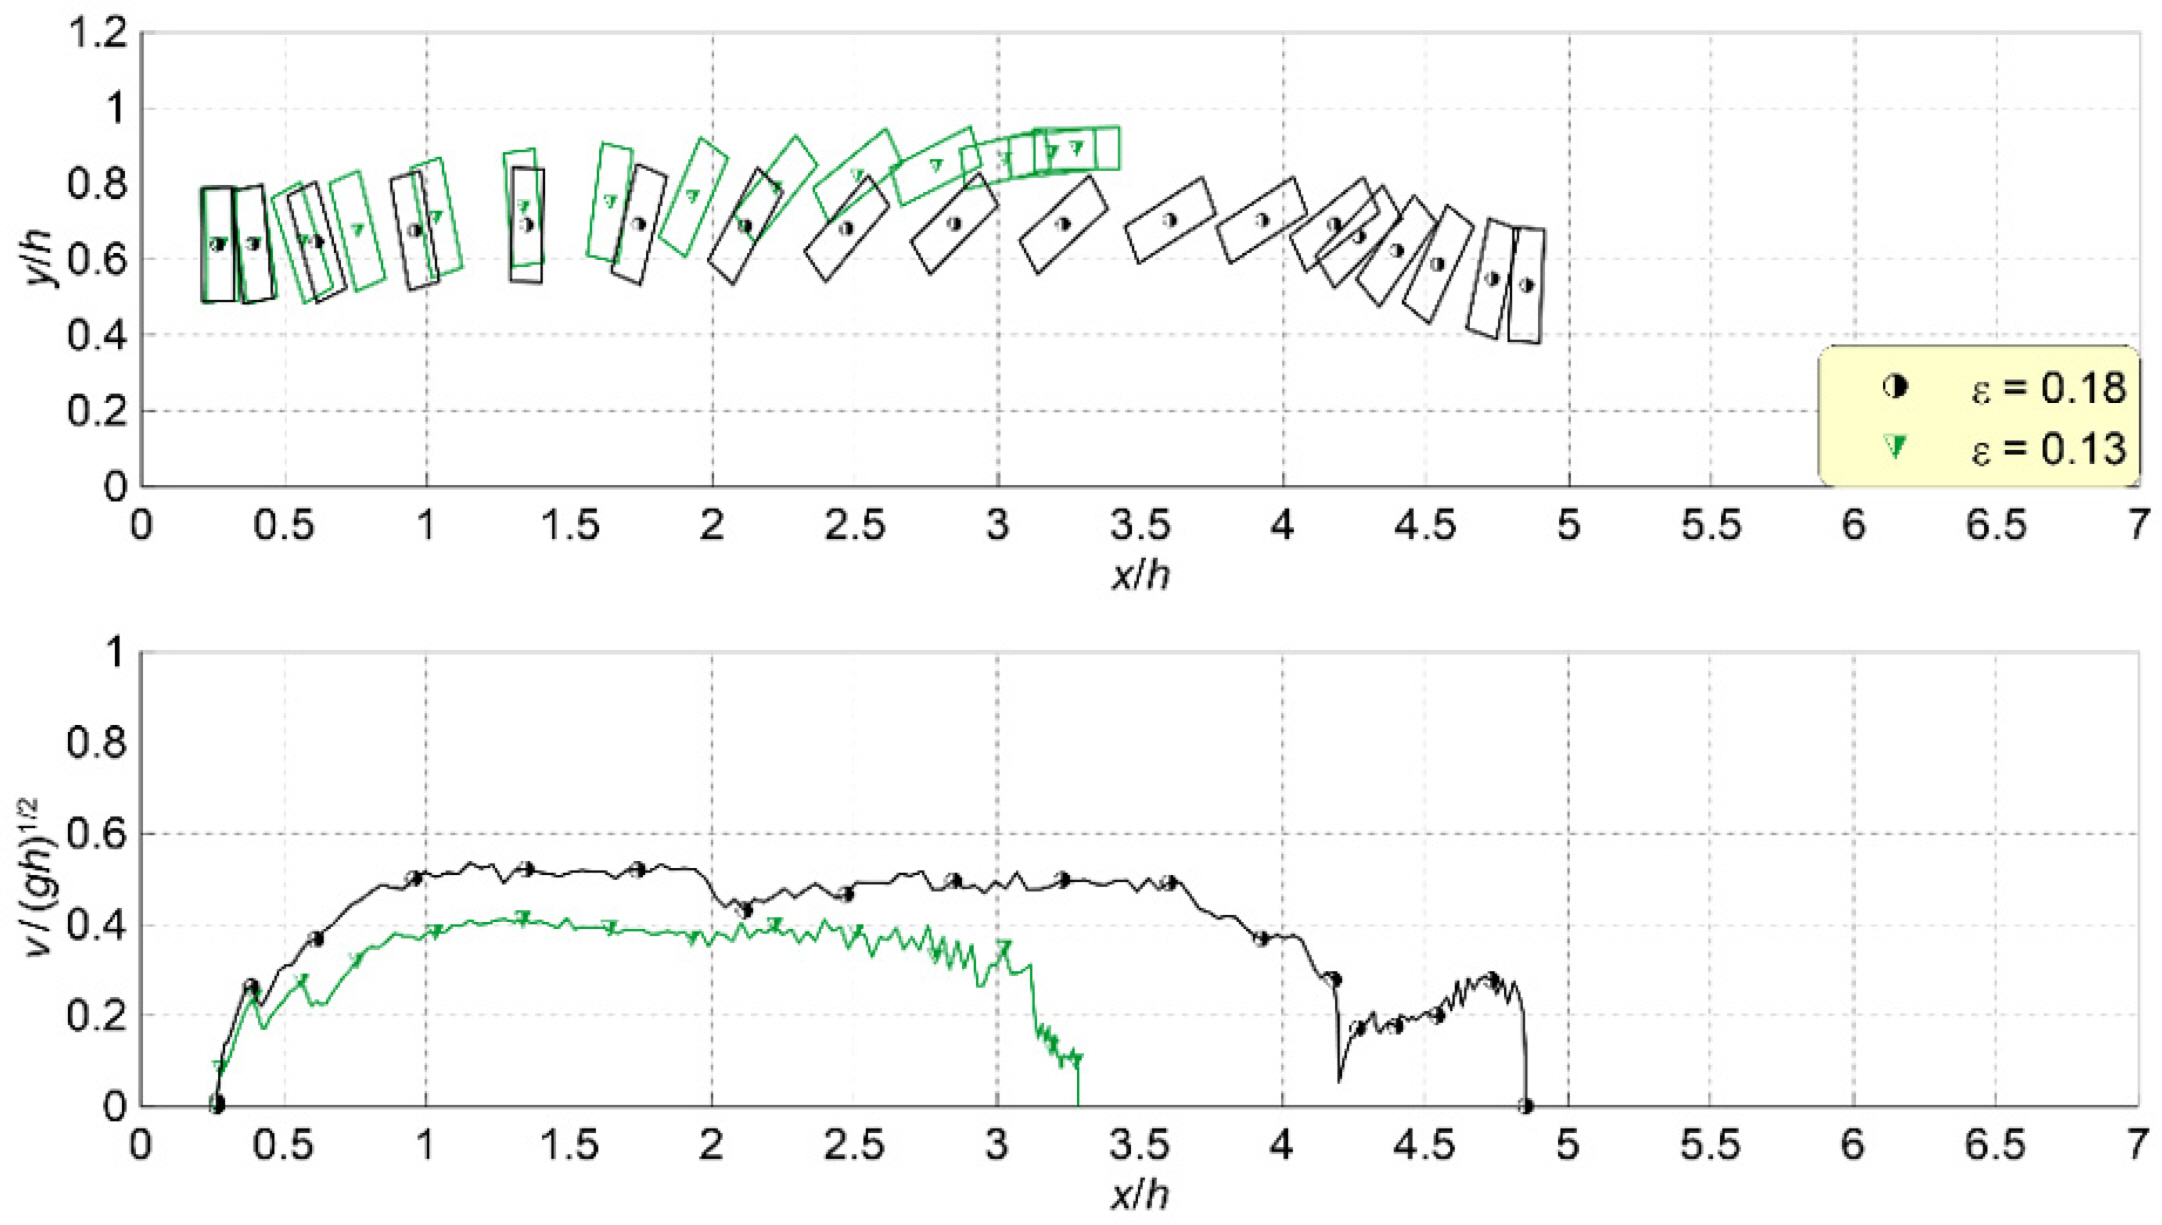
The scale of the solitary wave is represented by its height. Fig. 3 compares the drift behavior under two different incident solitary wave conditions, specifically ∊ = 0.13 and ∊ = 0.18. Fig. 4 illustrates the spatial distribution of the moving trajectory and velocity of the drifting container under these solitary wave conditions. In Fig. 3, the container model's initial point of drift (t0) is the reference for the dimensionless time variable,
t * = ( t − t 0 ) g / h g / h
The data presented in Fig. 3 demonstrate that the container's moving velocity is higher at ∊ = 0.18 than at ∊ = 0.13, and the drift distance over the same period is also greater when the solitary wave scale is high. According to Lee et al. (2022a), a larger solitary wave scale leads to increased rates of overtopping, and as per Lee et al. (2022b), this results in greater inundation depths in the land area. Consequently, the buoyant force acting on the container increases, reducing floor friction. Furthermore, Fig. 4 reveals that at ∊ = 0.18, the initial acceleration of the drifting container is substantial, the acceleration phase is extended, and the maximum drifting velocity also increases.
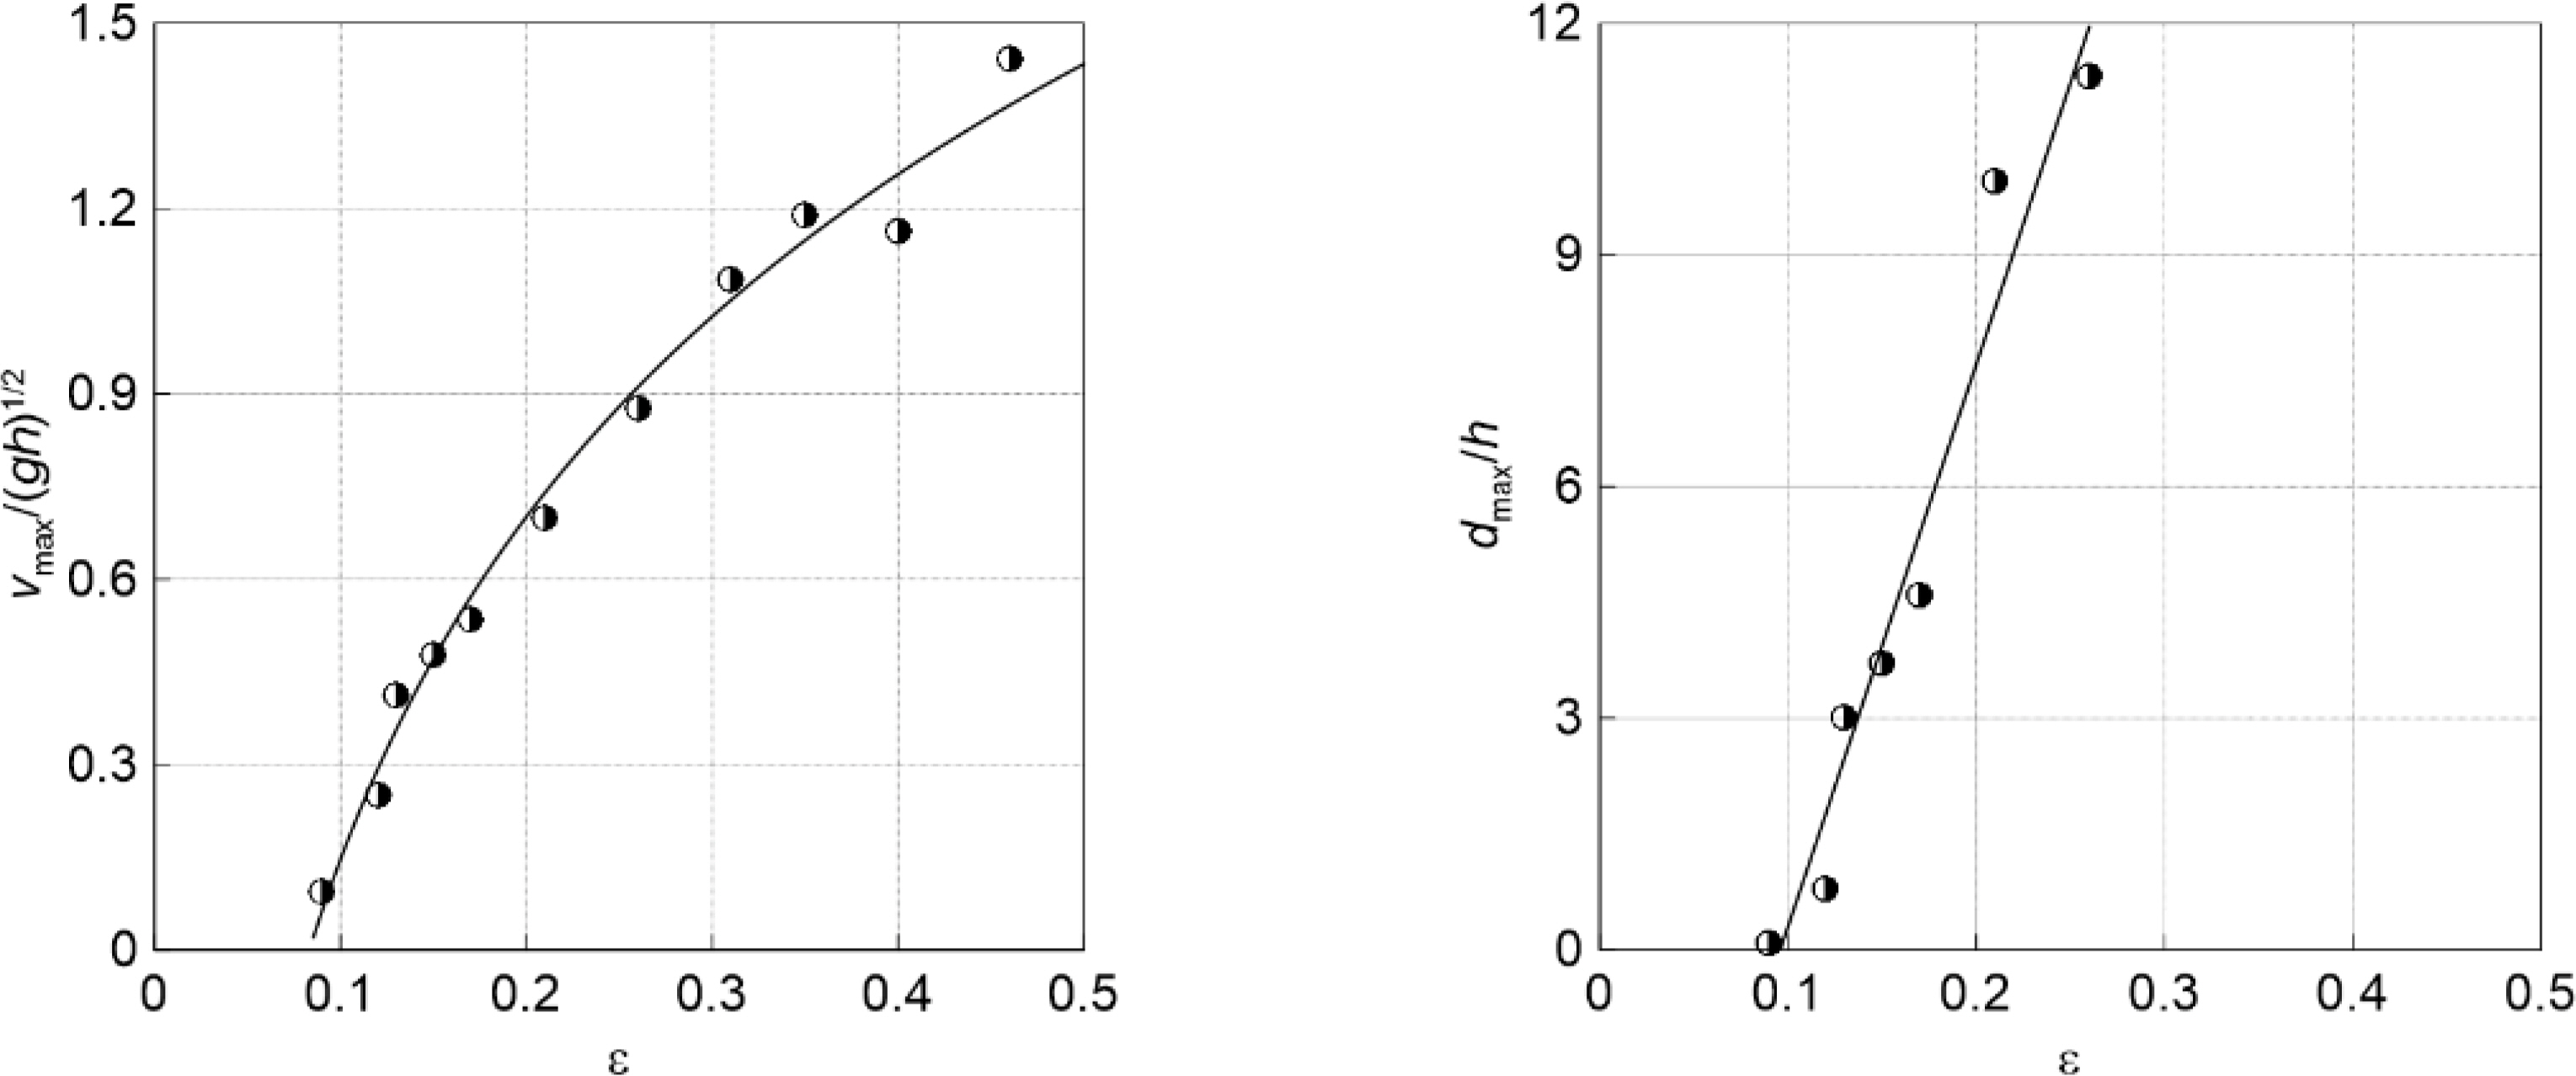
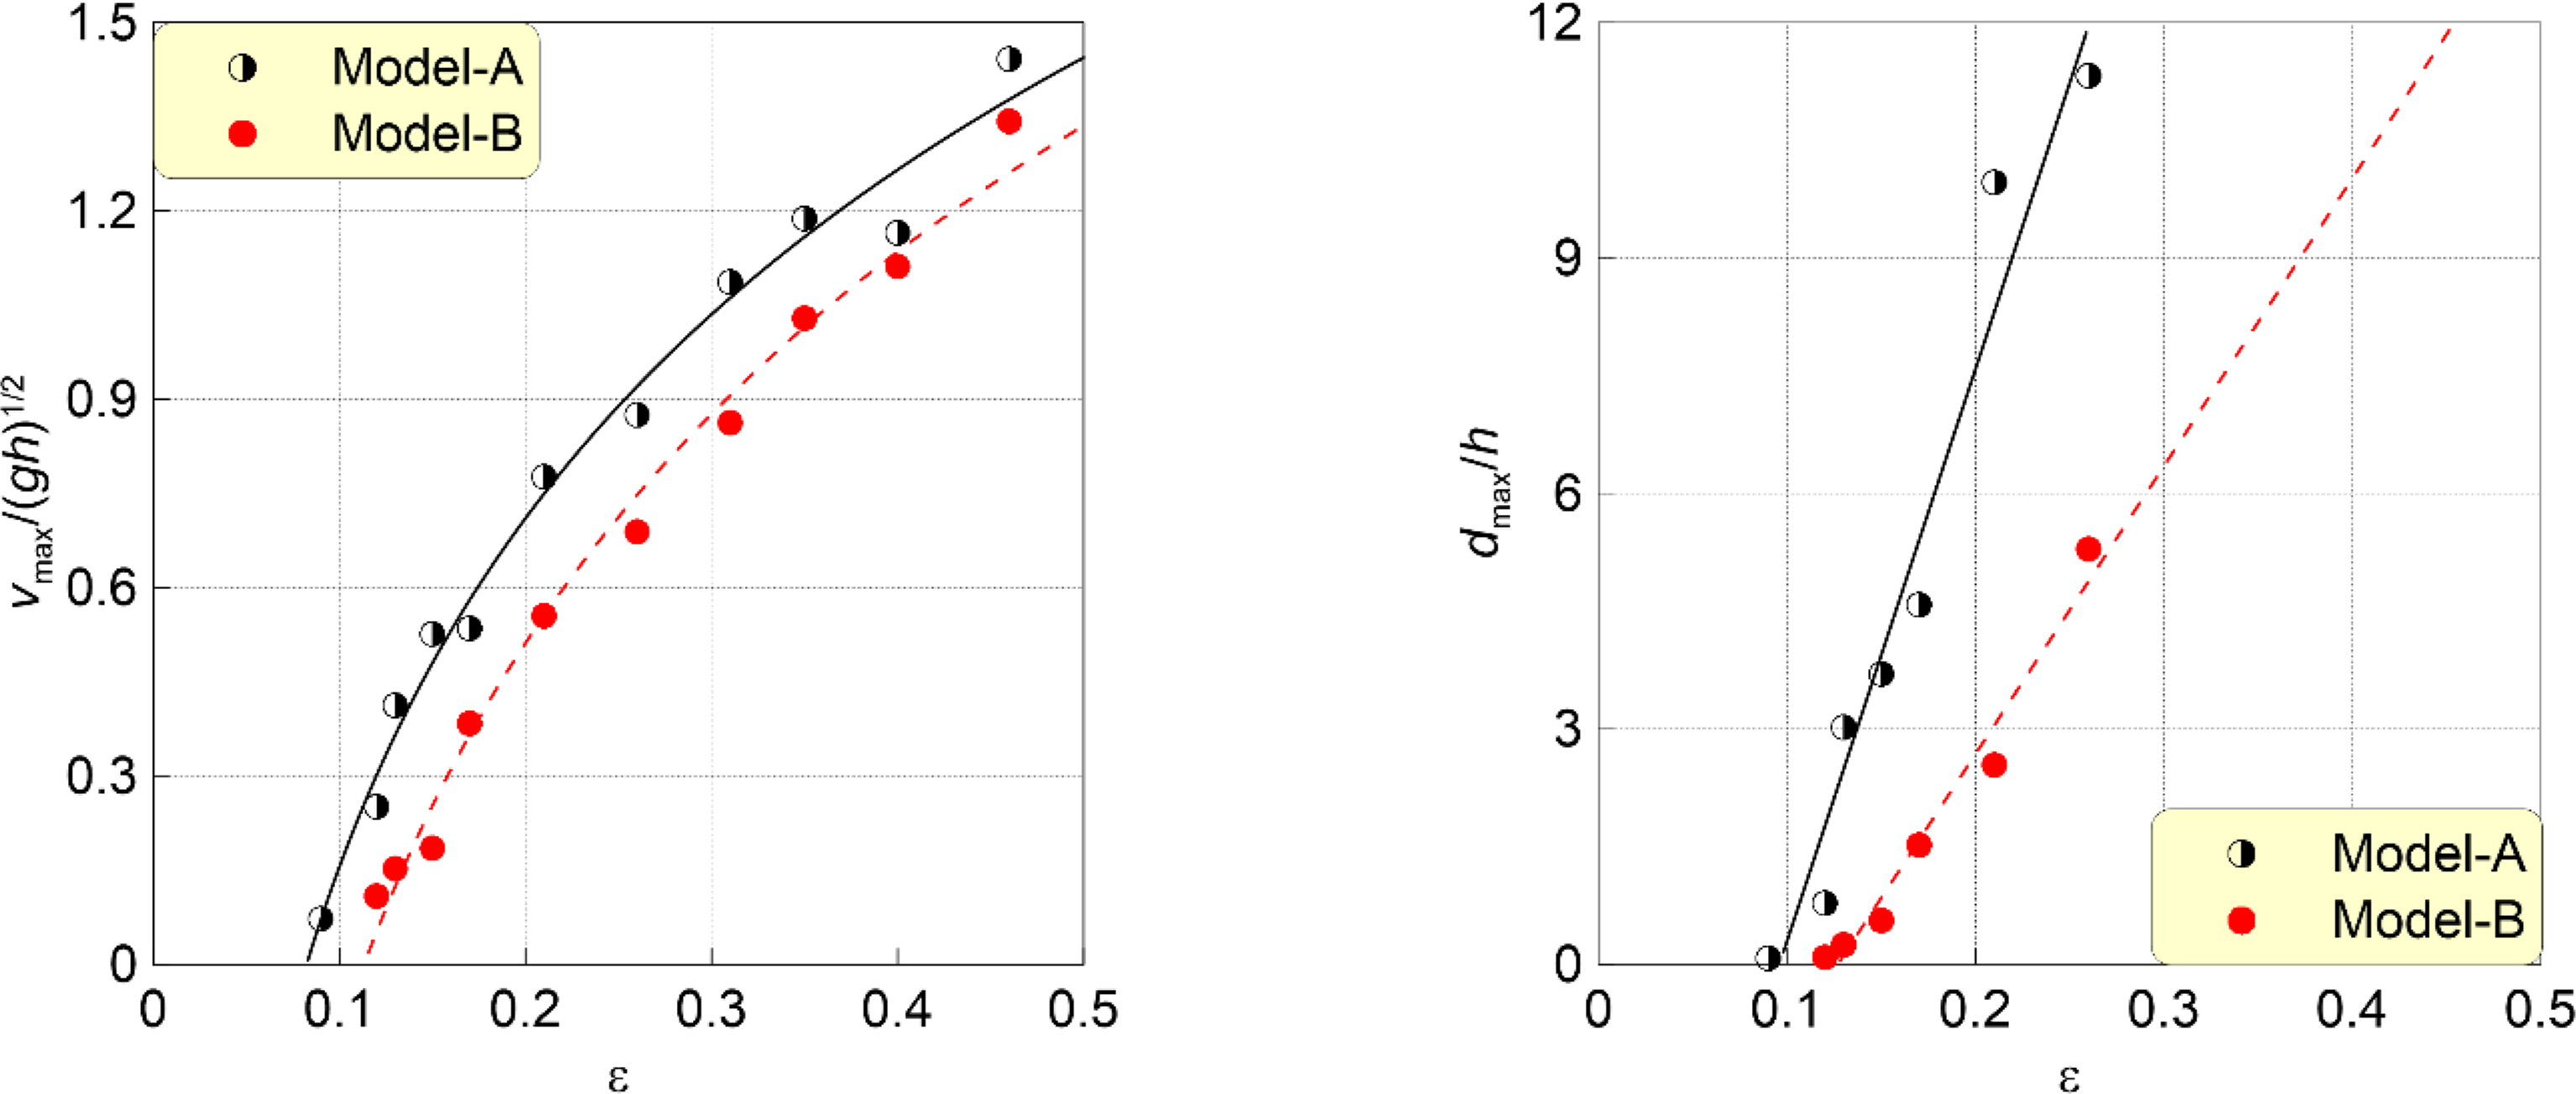
Fig. 5 shows the container's maximum drifting velocity (Vmax) and maximum drifting distance (dmax) in dimensionless terms, normalized by the wave speed (
g / h
The ratio
V max / g h
3.2 Effect of Container Weigt
Fig. 6 shows the drifting behavior of the container, emphasizing the influence of cargo weight under the solitary wave condition characterized of ∊ = 0.18. Meanwhile, Fig. 7 depicts the movement trajectory and velocity. Models A and B possess weights (Wtotal) of W0 +Wmax/2 and W0 +Wmax, respectively. Here, W represents the combined weight of the empty container and the maximum loaded cargo.
As suggested in Figs. 6 and 7, the difference in the location of the drifting containers, Model-A and Model-B, increases over time under the influence of the solitary wave. Model-B, despite its heavier weight, exhibits lower initial acceleration, moving velocity, and drifting distance compared to Model-A. In the same solitary wave scenario, the buoyant force acts differently based on the container model's weight, leading to this observed trend. Specifically, Model-A, being relatively lighter, experiences better buoyancy at the same depth of immersion, which in turn reduces floor friction. As a result, when comparing
V max / g h V max / g h
4. Discussion
In this study, the drifting characteristics of containers influenced by solitary waves, as determined through DIPP-Motion, closely align with the findings of Kim et al. (2023), who utilized an OpenCV library-based RGB analysis technique. Nevertheless, the present investigation allowed for discernment of the container's rotation during drifting and pinpointing the final stationary position of the container―observations that were elusive in the study by Kim et al. (2023). Additionally, despite the experiment's two-dimensional cross-sectional nature, the container exhibited a deviation angle relative to the y-direction center. This might be attributed to inconsistent floor friction or the possibility that the solitary wave did not apply a uniformly distributed load on the container. A positioning technology that can integrate real-time geometric information of drifting objects is essential to fully understand and capture this behavior.
When drifting objects become overturned, DIPP-Motion's location tracking struggles to detect predefined markers. However, our approach has an advantage in that it can concurrently monitor the positions of multiple drifting objects, given its capability to handle several markers simultaneously.
5. Conclusions
This study seeks to explore the drifting behavior of containers influenced by solitary waves, utilizing DIPP-Motion as the motion analysis tool. The overarching aim is to understand tsunamis' secondary disaster characteristics better, focusing on collisions involving drifting objects. Through DIPP-Motion analysis, we examined how the behavior of drifting containers varies with the solitary wave's scale and the container's weight.
As the solitary wave scale grows, both the traveling velocity of the wave and the displacement of the drifting container see a corresponding increase. This behavior can be attributed to larger solitary wave heights resulting in increased immersion depths. This increased depth subsequently diminishes bottom friction and amplifies buoyancy effects. Furthermore, the research indicates that lighter containers, while maintaining a consistent submerged depth, drift at faster velocities and traverse greater distances compared to their heavier counterparts, largely owing to decreased floor friction.
The analytical results related to the drifting behavior of containers propelled by solitary waves emphasize that the scope of secondary disaster damage from collisions is likely to increase with larger tsunami or storm surge scales. Lighter drifting objects are prone to higher velocities, which could affect collision dynamics. However, objects with lower weights generally exert weaker collision forces. As a result, the findings from this study alone make it difficult to precisely quantify the degree of collision damage and to fully understand the complex interplay between the movement velocity and weight of drifting objects.
To further investigate this matter, a follow-up study will conduct hydraulic experiments and computational analyses to examine collision forces. These explorations will focus on determining the relationships between the weight of drifting objects and their collision velocities.