1. Introduction
An ordinary link chain used in industry consists of several steel rings. A link chain is used to transport heavy goods by connecting them to machinery such as cranes and winches and fixing heavy objects in designated positions. The wire diameter of a load chain, which is a representative type of link chain, is selected based on the required load capacity. However, a steel chain has a disadvantage of its weight increasing in proportion to the working load and wire diameter, which significantly reduces the workability and limits the scope of application. Therefore, industrial sites that directly use chains demand a steel chain that is lightweight with high usability, and marine engineering research is underway to develop new products that use fiber as a modified material. Operations involving chains reveal that the tensile force is the most important product specification factor, and it is necessary to study design technology for a fiber chain that can meet the required specifications.
Steel is mostly used in industrial applications, but synthetic fiber has been used for a long time in mooring systems for ships and offshore structures. Among synthetic fiber chains used for lifting large loads, synthetic fiber ropes were first proposed for use as mooring lines in the 1960s, and since then, extensive studies have been conducted for their practical use (Banfield and Casey, 1998). Del Vecchio (1992) was the first to carry out systematic research on the mechanical behavior of polyester ropes. The dynamic stiffness, creep, and fatigue behavior of polyester ropes were examined as essential characteristics for application of polyester ropes in deepwater moorings. Petruska et al. (2010) installed the first offshore polyester mooring system in the Campos Basin, Brazil.
Over time, polyester ropes have become the preferred option of mooring line installation up to a depth of 1500 m. However, with increasing number of natural resources being discovered at increasing water depths, it remains to be explored whether polyester ropes can be utilized at these depths and whether they can provide sufficient stiffness to maintain adequate platform offsets (Davies et al., 2002). As offshore oil and gas surveys move to deep seas, mooring with polyester ropes has faced two challenges. The first problem is the size and weight of polyester ropes that are often considerably thick and long, which may exceed the allowable capacity of anchor handling boats and cause problems in installation (Chi et al., 2009; Det Norske Veritas, 2018). The second problem is that polyester ropes can have large elongations, which may lead to horizontal offsets exceeding the riser limit at depths of >2000 m (Fernandes et al., 1999).
To address these limitations, ultra-high-molecular-weight polyethylene (UHMWPE) was developed. Also known as high-modulus polyethylene (HMPE), it has been widely applied as the most suitable material for deep-sea mooring lines. HMPE ropes are lighter than polyester ropes under equivalent minimum breaking load conditions and have smaller diameters and higher stiffnesses. Thus, HMPE ropes have technical as well as operational advantages over traditional polyester ropes for applications in deep-sea mooring (Peter et al., 2011; Davies et al., 2015). HMPE mooring systems with high stiffness are better for risers in terms of offset than polyester mooring lines, and HMPE ropes typically break at 2–2.5% elongation after use, while polyester ropes break at 12–15% elongation.
While the positions of offshore structures are held static, the waves apply a cyclic load on the mooring lines, which changes the fiber elongation, so the mooring line is subjected to an extension-retraction fatigue load. In one study, an HMPE rope showed a longer fatigue life than a polyester rope with the same structure, and its axial compression fatigue properties were not inferior to those of an aramid fiber sample (Garrity and Fronzaglia, 2008, Leite and Boesten, 2011). A hybrid rope prepared with a combination of HMPE and polyester has been proposed for mooring systems located in areas with risk of storms and hurricanes, where rope stiffness and elasticity are required at the same time. Theoretical and numerical studies of polyester mooring lines have been conducted for coupled dynamic analysis with deep-sea floating platforms (Bunsell et al., 2009, Leite et al., 2011, Tahar and Kim, 2008).
The mechanical behavior of synthetic fiber ropes directly impacts mooring responses (Weller et al., 2014). Berryman et al. (2002) examined the residual strength of HMPE ropes for use in mooring lines of mobile offshore drilling units (MODUs) for 110 days and showed that the HMPE rope was still in good condition compared to the initial state. Williams et al. (2002) performed small-scale static tensile testing using polyester elements and sub-rope components to examine damaged ropes. Ward et al. (2006) tested the length-to- diameter ratio’s effects on polyester ropes used for mooring to determine the effect of damage on their residual strengths and developed guidelines for mitigating damage in polyester rope mooring lines. Da Costa Mattos and Chimisso (2011) modeled creep tests of HMPE fibers used in ultra-deep-sea mooring ropes and compared the expected lifetime and elongation (%) of the test specimens at various load levels and temperatures. Cédric et al. (2020) analyzed the extension load sensitivity characteristics of HMPE ropes according to the initial load change, and Gen et al. (2021) conducted an experimental study on the dynamic stiffness of full-size HMPE ropes under long-term cyclic loading conditions.
Several studies have proposed polyester and HMPE as suitable materials for preparing synthetic fiber ropes for mooring and examined their applications. With a fiber chain, strength and durability similar to those of mooring ropes are required to transport heavy objects, but their usage and required characteristics vary from those of mooring ropes. Kim et al. (2021) analyzed the quasi-static stiffness and durability change characteristics of HMPE and liquid crystal polymer (LCP) materials to select fiber materials suitable for a fiber chain. HMPE DM20 material showed excellent dynamic stiffness and high breaking strength in the same lifetime. However, there have been few studies on the strength design of fiber chains using synthetic fiber materials. Therefore, in this study, a fiber chain was designed to meet tensile force requirements using HMPE DM20 material, and the design variables were analyzed to improve the breaking strength.
2. Component Design
2.1 Design Geometry
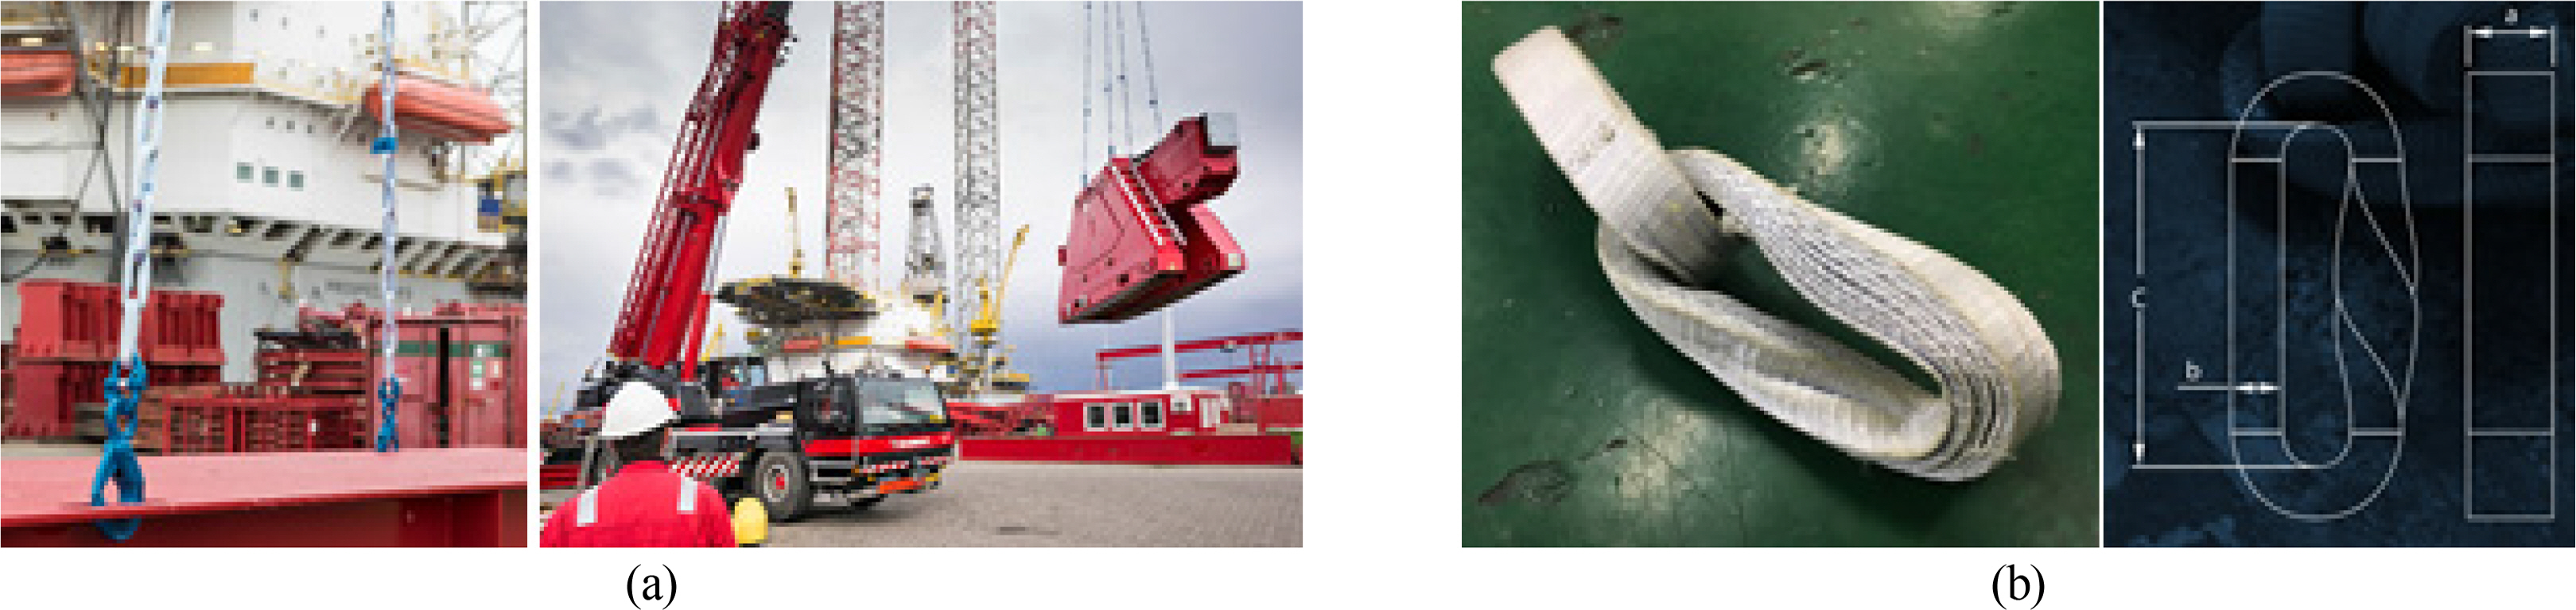
Each link in a fiber chain is made by repeatedly winding fiber fabric to form a belt shape with a constant inner diameter and fixing the fabric using separate stitches. Many such links are connected to realize the chain length, and the product is completed by adding a shackle at the end of the chain. A fiber chain can be used with a crane or winch for heavy-duty lifting. Fig. 1 shows examples of its application by Green Pin® and the geometry of a fiber chain link. The main design variables of a link are the fabric width, inner diameter length, and number of times that the fabric is repeatedly wound to form a link.
2.2 Basic Design
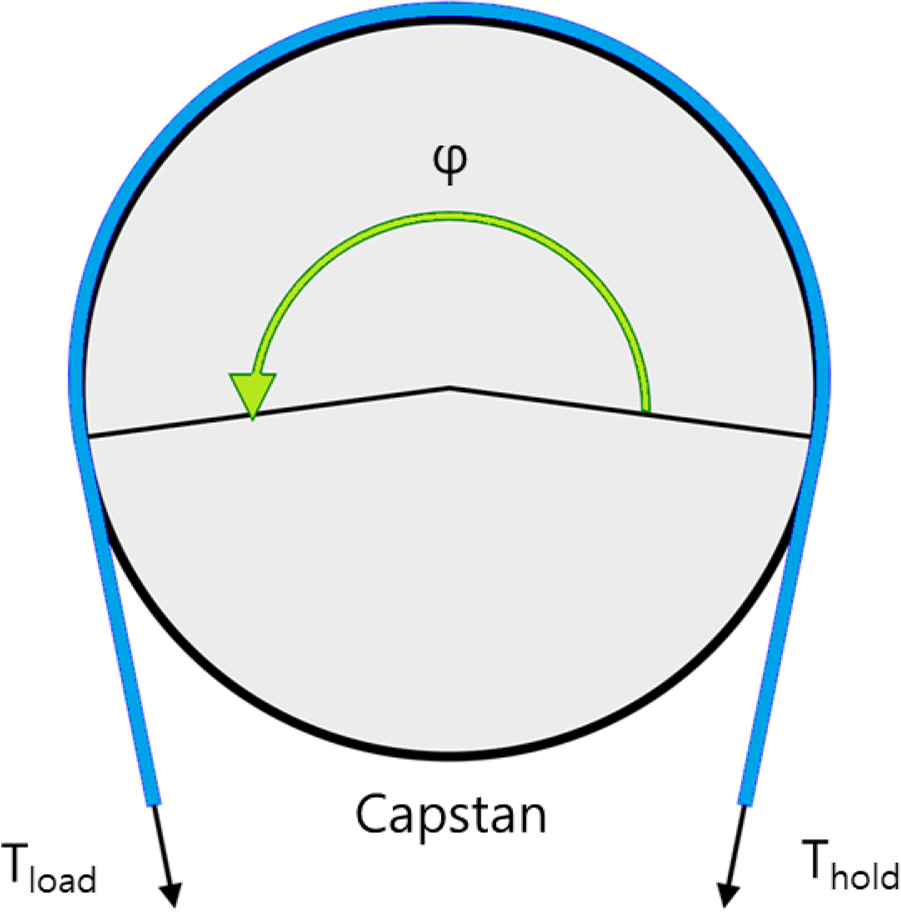
The capstan equation was used for the fundamental design of the fiber chain in consideration of the load gradient:
where, Tload represents the tension applied on the line, Thold represents the resulting force exerted at the opposite side of the cylinder, μ is the coefficient of friction between the line and cylinder material, and ϕ is the total angle swept by all the turns of the line. The capstan equation is also known as Eytelwein’s formula and relates the holding force of a flexible line to the loading force when the line is wound around a cylinder. Because of the interaction between frictional forces and tension forces, the tension on the line around the cylinder may differ from one side of the cylinder to the other. A small holding force applied on one side of the cylinder may exhibit a much larger loading force on the opposite side, depending on the wrapping count. This is how a capstan-type device operates. A fiber chain is configured using the wrapping count at a constant inner diameter, so a foundation design with a gradual load was developed using the capstan equation. Tthe layout of the equation is provided in Fig. 2.
The load according to the wrapping count can be calculated at the design breaking strength of 32 t based on the use of HMPE DM20 and assuming that the coefficient of friction is 0.1 and a wrapping count of 10, as provided in Table 1. When the wrapping count was set at its maximum of 10, the load applied to the outermost fabric of the fiber chain was calculated as 0.06 t, which is within the allowed range of the design standard.
2.3 Fabric Design
The manufacturing process for the fiber chain involved braiding yarn to produce the fiber chain fabric and loading the braid onto a loom to weave the fabric in the form of webbing. The woven fabric was then wound to produce chain links. The webbed fabric took the form of a strip, and the fabric was woven according to the pick count. The pick count is the number of intersection points for the wrap and weft contained in 25.4 mm, which affects the shape stability of the fabric and tensile performance until failure. Thus, different pick counts were used to analyze the tensile strength characteristics.
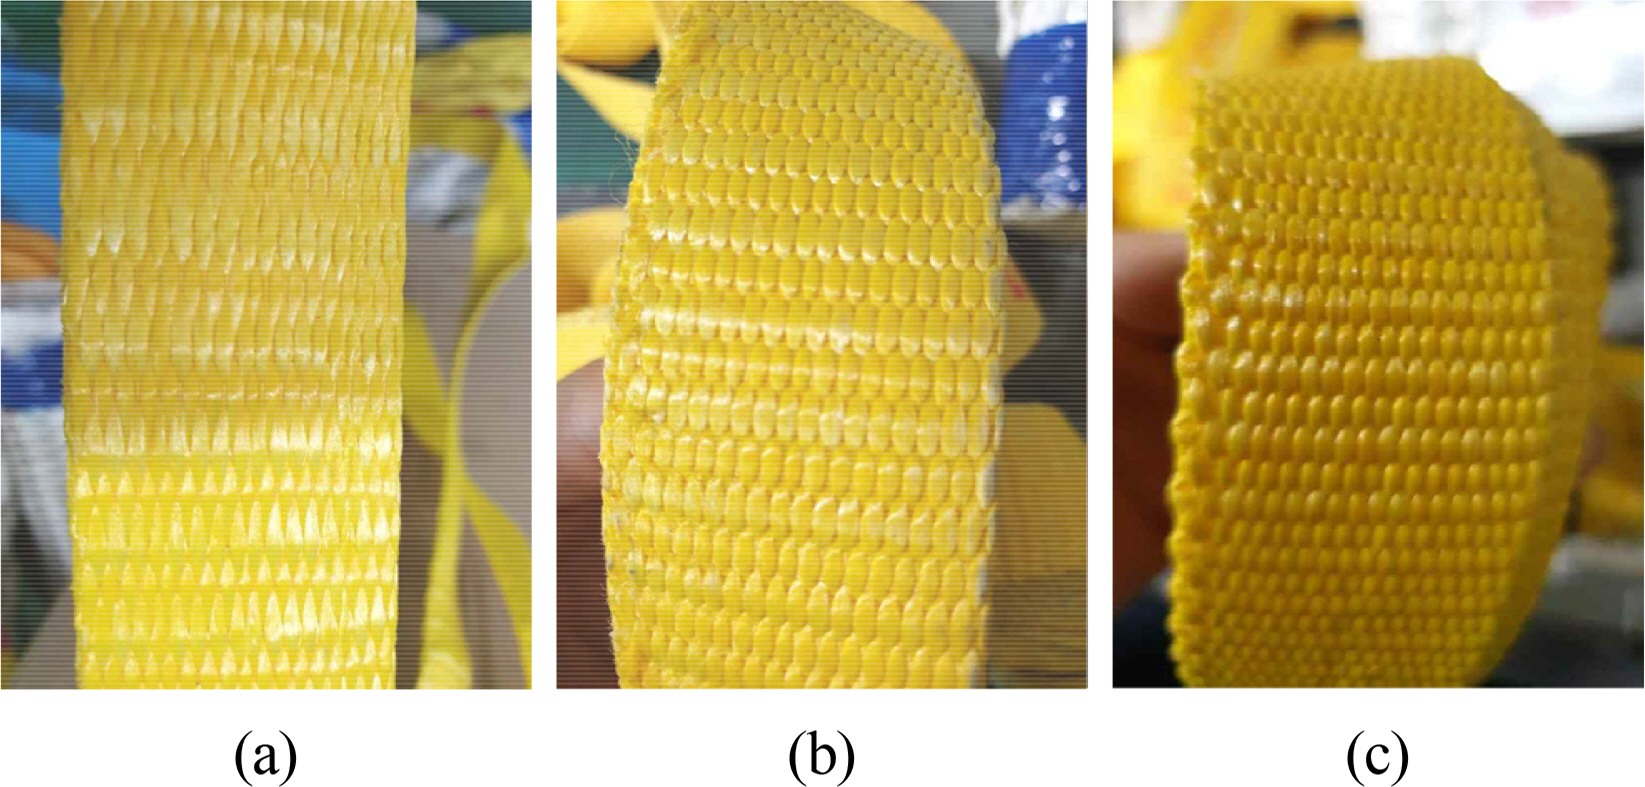
The shape of the webbing fabric woven with a 30 mm width is shown in Fig. 3. The pick count values used in the fabric webbing were 10.7, 13.7, and 14.7, and a tensile strength test (ISO 2307- Fiber ropes, 2019) was performed on the woven fabric. The breaking strength results according to the pick count are provided in Table 2. As revealed by the breaking strength values, a smaller pick count resulted in a higher breaking strength for the woven fabric. Breaking strengths of 52.1 and 42.4 kN were observed for pick counts of 10.7 and 14.7, respectively. Because the fiber chain fabric was subjected to a tensile load in the weft direction, a lower pick count resulted in better tensile strength, and a larger pick count produced a larger fiber density, which improved the shape stability and increased the elongation. It can be seen that the shape stability and the breaking strength are parameters to consider in the design of the fiber chain.
3. Experiment Method
3.1 Range of Design Variables
The breaking strength is the primary performance factor to consider for a fiber chain. Because a fiber chain should be designed to satisfy a target strength, an experimental design method was applied to analyze the influences of the design factors on the breaking strength and derive the optimal combination of factors. During the manufacture of a fiber chain, the valid design variables include the pick count, wrapping count, and inner length. Therefore, a factorial experiment design with these design variables was conducted, and their correlations to the breaking strength were analyzed. The ranges of the design variables are provided in Table 3. The inner length is the minimum length to start wrapping the fabric. For each design variable, the variance range was set by employing one upper level and one lower level from the reference model.
3.2 Factorial Design
The design of experiments method was used to minimize the number of experiments conducted by designing an apparatus on a statistical basis. An analysis of the results based on a statistical evaluation of the hypothesis made it possible to define the relationship between the input and output variables as a function and provide the maximum amount of information with minimum experimentation and cost. In this study, an orthogonal array with three factors was adopted to analyze the relationship between the input parameters (design variables) and an output parameter (breaking strength) through experiments.
3.3 Breaking Test Method
The fiber chain specimens were fabricated, and tensile strength tests were conducted with various values for the design variables: the pick count, wrapping count, and inner length. Rope tensile-strength test equipment with 150 t capacity at DSR Corp. was used to apply loading conditions to the fiber chain. This test equipment and the experiment are shown in Fig. 4. ISO 2307 standards were used in the tests.
4. Results and Discussion
4.1 Pre-tension for Fiber Chain
A synthetic fiber rope is subjected to pre-tension due to the uneven torsional stress and torsional strength of the inner lower rope. This pre-tension improves the shape stability of the synthetic fiber rope. The effect of pre-tension on the tensile strength of the fiber chain was analyzed prior to the complete experiment because a fiber chain shares many similarities in the material and manufacturing process with a synthetic fiber rope. Generally, the pre-tension of a synthetic fiber rope is within 60% of the breaking load. When more than 85% of the breaking load is applied, the rope core may undergo plastic deformation, which significantly decreases the elastic modulus despite the increased elongation. Because of this risk of a decreased elastic modulus, a load within 60% of the breaking load is applied. Therefore, the fiber chain was prepared with pre-tension equivalent to 50% of the breaking load, and the effect was analyzed.
Fiber chain samples with a width of 30 mm were produced and used in strength tests with and without pre-tension. As summarized in the test results in Table 4, the fiber chain without pre-tension showed a breaking strength of 239.8 kN and elongation of 41.5%, while the fiber chain with pre-tension demonstrated a breaking strength of 286 kN and elongation of 14.5%. The breaking strength was the average value of three tests, and the deviations from the mean in test results were 5.41 and 8.34, respectively. The pre-tension effect caused a 16% difference in the breaking strength and a 27% difference in the elongation.
The yarn of the fiber chain gained residual tensile strength in the spinning process with torsional stress produced in the twisting and weaving processes. The residual tensile stress and torsional stress were major factors affecting the structural elongation of the fiber chain. Because the imposition of pre-tension could partially or completely eliminate the residual tensile strength and torsional stress, the increased breaking strength under the pre-tension effect was postulated to be due to the increase in the elastic modulus of the fiber chain. In addition, the fabric structure of the fiber chain became denser as a result of the pre-tension, and the elongation rate decreased.
4.2 Test Results
The results of the breaking strength experiments with various design variable values are presented using an orthogonal array in Table 5. The analysis of variance (ANOVA) results for the breaking strength in relation to the pick count, wrapping count, and inner length are shown in Table 6. The ANOVA results indicate the degree of freedom (DF), sum of the adjusted squared deviation (Adj SS), sum of the adjusted mean square (Adj MS), standard error of the regression (S), coefficient of the determination (R2), F-statistic, and P-value for each term in the model. The variance (the sum of the deviation squared) determines the magnitude of the change with respect to the measurement. The sum of the deviation squared divided by the degree of freedom is the sum of the mean squared (unbiased variance). The F-statistics refer to the ratio of variances, and the P-value is the expected value of variance. An evaluation of a variable was conducted using the F-statistic and P-value, while the P-value was used in this experiment.
The Adj SS values for the pick count, wrapping count, and inner length were 1548.83, 532.04, and 151.0, respectively, as shown in Table 6. The variations in the breaking strength due to the pick count and wrapping count were greater than those of the inner length. This occurred because the density of the warp and weft constituting the cross-sectional layer of the fiber chain were direct factors in the breaking strength, and the wrapping count affected the capstan effect. The ANOVA of the breaking strength showed that the F-value was 21.66 for the pick count and 7.44 for the wrapping count, and the expected variance P-value was less than or equal to 0.05 for both variables. Therefore, it was concluded that the pick count and wrapping count were the main factors influencing the breaking strength at a significance level of 5%.
4.3 Main Effect Analysis
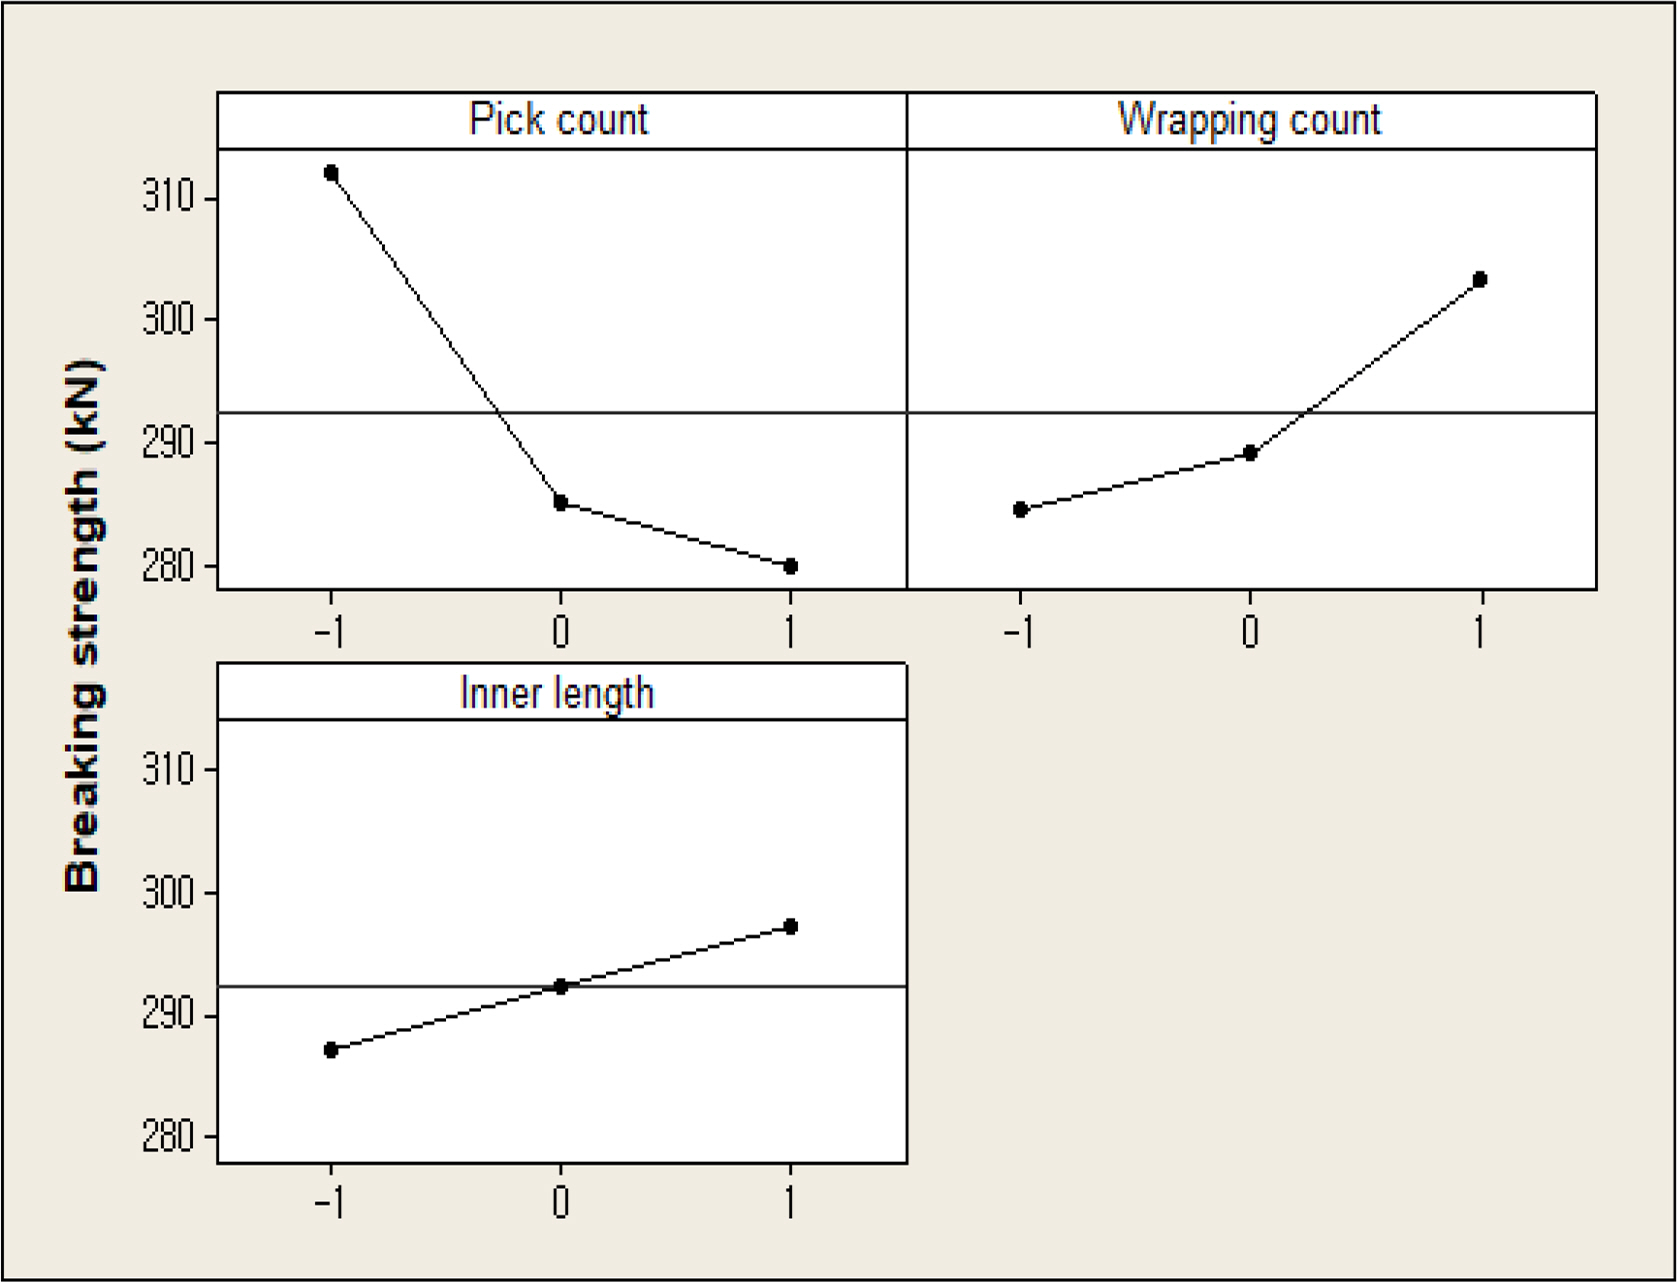
Fig. 5 displays the main effects of the pick count, wrapping count, and inner length on the breaking strength. In the main effect plot, the dotted line in the middle represents the total average of the breaking strengths, and each dot corresponds to the average value at a specific level. The breaking strength appeared larger-the-better characteristics with respect to the changes in the design variables. The main effect plots for the changes in the levels of the design variables in Fig. 5 reveal that the breaking strength increased as the pick count decreased, the wrapping count increased, and the inner length increased.
The sensitivity of each design variable to the breaking strength was determined using the delta values (difference between the maximum and minimum values) of the objective function, which are summarized in Table 7. The variable with the highest sensitivity was determined to be the pick count with a delta value of 32.1, followed by the wrapping count and inner length. The analysis revealed that the level changes in the pick count resulted in a change of up to 11.8% for the breaking strength, while changes in the wrapping count and inner length caused 6.7% and 3.5% changes, respectively. A large strength variance was observed in the pick count range from −1 to 0 and in the wrapping count range from 0 to 1.
4.4 Contour Plot Analysis
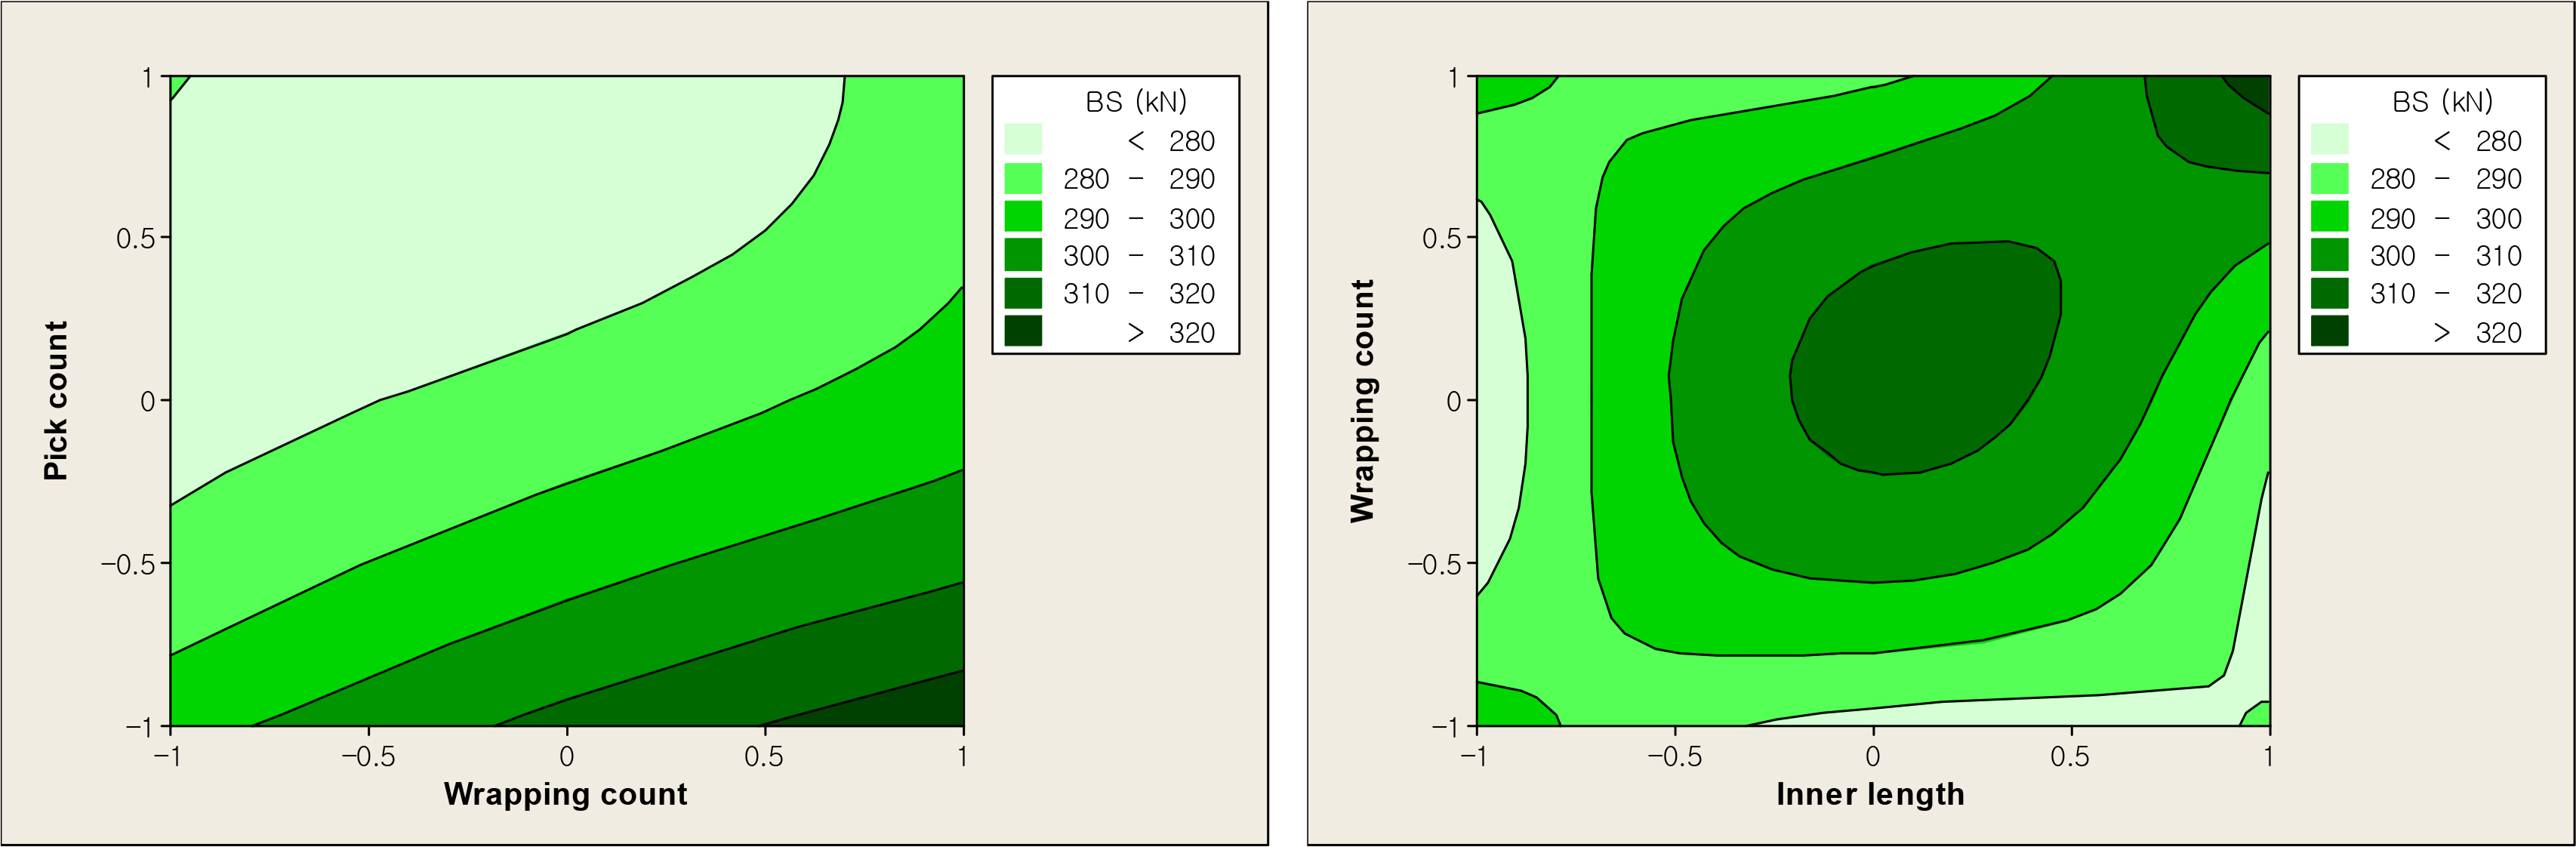
A contour plot represents the response curve for a combination of design variables, and the value of an objective function is constant on each contour line. The contour lines for the pick count and wrapping count with respect to the breaking strength are plotted in Fig. 6. The maximum breaking strength is observed at a wrapping count of 1 and a pick count of −1 in Fig. 5, and the figure displays the contour lines under the same conditions. Using the results of the contour plot analysis, the breaking strength can be estimated to be greater than 300 kN when the wrapping count is fixed at 1, the pick count is less than −0.65, and the inner length is greater than 0.38. The combination of design variables made it possible to identify the region of optimal conditions that satisfy the target strength. Through additional experimentation and analysis, the derivation of a optimal design-variable combination is expected.
5. Conclusions
A fiber chain satisfying a target strength requirement was designed using HMPE DM20 to develop a replacement for a steel chain. The strength characteristics of the fiber chain in relation to the design variables were analyzed. The results of the study are summarized as follows. For the fundamental design of a fiber chain in consideration of the load gradient, the tensile force in relation to the wrapping count was calculated using the capstan equation. The load applied on the outermost fabric with a wrapping count of 10 was calculated to be 0.06 tons, which was within the allowed range. For the fabrication design of the fiber chain, the strength characteristics in relation to the pick count were analyzed. The trend of an increase in the breaking strength with decreasing pick count was observed in the chain fabric. As the pick count increased, the fabric density increased, which improved the shape stability and increased the elongation rate.
The effect of pre-tension accounting for 50% of the design strength was analyzed. The presence of pre-tension produced differences of approximately 16% in the breaking strength and 27% in the elongation. The relationships between the design variables and breaking strength were analyzed by conducting experiments using an orthogonal array. The results of the main effect analysis determined that the breaking strength increased with a decrease in the pick count, an increase in the wrapping count, and an increase in the inner length.
The sensitivity of the breaking strength to the design variables was analyzed using the delta values. Level changes in the pick count, wrapping count, and inner length produced maximum changes of 11.8%. 6.7%, and 3.5% in the breaking strength, respectively. The contour lines of the pick count and wrapping count were plotted with respect to the breaking strength. With the wrapping count fixed at 1, a pick count less than −0.65, and an inner length greater than 0.38, the breaking strength was calculated to be greater than 300 kN. The design variable characteristics of the analyzed fiber chain are expected to be utilized as important factors when deriving an optimal combination of design variables that satisfy target strength requirements.