1. Introduction
Recently, interest in the relative wave elevation around offshore structures is increasing as oil field development moves from shallow waters to the deep sea and offshore platforms are installed in harsher environments. In 1995, a wave known as the New Year Wave occurred near the Daupner offshore platform in the North Sea, rising to 25.6 m, even though the significant wave height of sea state was 12 m, and causing a great deal of damage to the platform. In 2015, a large wave caused the significant damage to the portside column of the COSL Innovator, which is a semi-submersible drilling rig, and causing one fatality and four injuries. In addition, 29 accidents due to high wave elevation around offshore platforms were officially reported from 2000 to 2017 (
Kvitrud and Loland, 2018). Thus, many classification societies provides the guideline and rules regarding the prediction of relative wave elevation around offshore structures (
ABS, 2018;
DNVGL, 2019), and these documents are used when declaring deck clearance in the design stage of offshore structures.
It is well known from experimental and numerical studies that the nonlinear components account for 30% or more in wave elevation around column type structures under some extreme sea states(
Kriebel, 1992). That being so, predictions for relative wave elevation based on conventional linear theories have limitations, and to estimate and predict the relative wave elevation near offshore structures, it should be analyzed with computational fluid dynamics (CFD) simulations or model tests that can include nonlinear components. These analyses are particularly necessary around the columns of structures, because these areas exhibit strong nonlinearity. As the studies using CFD simulations,
Iwanowski et al. (2009) and
Matsumto et al. (2010) analyze the relative wave elevation around semi-submersible platform using the commercial software ComFLOW under regular waves and compared their results with experimental results. And
Lee et al. (2014) analyzed the relative wave elevation under irregular waves with 100-year return period. However, for such CFD simulations, the reliability and accuracy should be verified; thus, model tests must be performed. To reduce the time cost of simulations, researchers have proposed simple methods for predicting relative wave elevation that consider the nonlinearity of wave elevation by multiplying an asymmetric factor to the linear theory-based results(
Stansberg, 2014;
Pessoa et al., 2018). However, classification society requires the verification of the asymmetric factors for new types of offshore structures through model tests (
DNVGL, 2019). For these reason, model tests provide a standard of verification for relative wave elevation analysis; therefore, accurate measurements are necessary for understanding the characteristics of relative wave elevation.
In model tests, measurement for relative wave elevation are performed using a wave probe that is attached to a platform hull with a jig. The wave probes that are mainly used in model tests can be divided according to their measurement principles into the resistance type and the capacitance type, and the characteristics of the two types differ. Through various model test, we found that the measured values differ according to the differences in the wave-probe properties even when waves are measured under the same physical phenomenon, but no previous reports on this topic have been found. Even in the guidelines for offshore structure model tests provided by the
ITTC (2017), there are no recommendations regarding this topic. Guidance documents for relative wave elevation of classification society also do not provide any standards regarding the properties of model test measurement devices (
ABS, 2018;
DNVGL, 2019). The difference in measurements, which are caused by the probes’ measurement principles, are an important problem in analyzing physical phenomena; therefore, in-depth research on this topic is needed.
In this study, the differences of analysis results for the relative wave elevation around semi-submersible platforms due to the characteristics of the wave probes were examined through the model test. First, wave probe comparison experiments were performed in a two-dimensional (2D) wave tank, with consideration of the effect of wave probe’s measurement principle on the measured value in the same physical phenomenon. Then, two types of wave probes were installed in model tests of semi-submersible platform, and the relative wave elevation were measured. The differences between results of the probe for relative wave elevation were analyzed using guideline provided by classification society. In the relative wave elevation analysis, the asymmetric factors and upwell extreme values were calculated. In addition, the upwelling phenomenon were photographed using high-speed camera, and the cause of the differences in the measured value was discussed.
2. Wave Probe Characteristic Comparison Experiments
Before the model tests, experiments were conducted to compare the wave probe characteristics. These experiments were performed in the 2D wave tank of Korea Research Institute of Ships and Ocean engineering (KRISO). The objective of the experiments was to examine the differences in the measured wave height according to the measurement principles of the wave probes. Resistance- and capacitance-type probes were selected to measure wave height.
Fig. 1 and
Table 1 present the wave probes that were used in the wave probe characteristic comparison experiments, as well as their specifications. The wave probes consisted of a detector line and an amplifier. The resistance-type wave probe was manufactured using a Type 874 amplifier made by MARIN and a steel line. For the capacitance-type wave probe, an off-the-shelf product made by KENEK was used. The RW (relative wave elevation) probe is a capacitance-type wave probe that is mainly used to measure the relative wave elevation in model tests. A Teflon line was used as the detector line, and the amplifier is prototype product. To compare the measured value and the real value in physical phenomena, a grid was drawn on the 2D wave tank wall, and high-speed camera photography was performed. The wave probes were installed so that they did not interfere with each other, and they were installed in a straight line from the side.
Fig. 2 shows the experimental setup.
Fig. 3 shows the measured wave signal from each wave-probe and high-speed camera photographs of the wave crests depending on the wave conditions. The measurement results for the resistance- and capacitance-type wave probes were similar in the case of a steep wave condition. However, when the slope increased and a breaking wave occurred, the measured value of the capacitance-type wave probe at the wave crest was larger than that of the resistance-type wave probe. When the wave crest was examined by the high-speed camera, the water surface (including bubbles) was at approximately 0.15 m, which is close to the measured value for the capacitance-type wave probe. However, the water surface without bubbles was at approximately 0.09 m, which is close to the meausred value for the resistance-type wave probe. The difference in the measurement values is attributed to the difference in measurement principles. For the resistance-type wave probe, a circuit is formed between two conductive wires below the water plane, and the wave elevation is measured according to the difference in resistance. In contrast, for the capacitance-type wave probe, a wire in which the axis line is a conductor is placed in the water, and the wave elevation is measured according to the change in capacitance. Therefore, when a breaking wave is generated, the resistance-type wave probe cannot properly form a circuit below the water plane, and the bubbles have little effect on the measured value, whereas for the capacitance-type wave probe, there is a change in the surrounding capacitance depending on the amount of water in the bubbles, which is measured as the wave elevation. Owing to this difference in the measurement principles, the measurement results differed even for the same physical phenomenon.
3. Model Test Setup
Next, model test of semi-submersible platform were performed. The objective of the tests was to measure the relative wave elevation and slamming pressure in front of the column of the offshore platform, and this study focused on analyzing the relative wave elevation. The model tests were performed in the ocean engineering basin of Korea Research Institute of Ships & Ocean Engineering, and the model was a KRISO standard semi-submersible platform called K-SEMI. The model scale was determined to be 1/50, considering the possible range at which waves could be generated in the ocean engineering basin. The model tests were performed under survival draught conditions, and the main dimension of model are presented in
Table 2. The measurement items consisted of the motion with six degrees of freedom, relative wave elevation, and mooring-line tension. The mooring system was a four-point soft spring system.
Fig. 4 shows the shape of the K-SEMI model and a photograph of the model tests being performed.
Fig. 5 shows the points at which the relative wave elevation was measured. The measurement locations were the front of the column (RW01-RW02), the rear of the pontoon (RW03-RW04), and the front and bottom of the deck (RW05-RW12). The relative wave elevation measurement location on the front of the column was set as 3 m from the column wall (RW02) as suggested in DNVGL, to prevent the measurements from being affected by localized wave run-up flowing along the column wall. In addition, a relative wave elevation probe was installed 6 m in front of the column (RW01)—slightly farther away than RW02—for comparison of the measurement trends. To compare the measured value according to wave-probe characteristic, capacitance-type wave probes (RW) and resistance-type wave probes (R-RW) were installed at 2-m intervals on the front of the column along the width direction. The capacitance- and resistance-type wave probes were manufactured and used in the same way as the RW wave probe and the Type 874 probe manufactured by MARIN, respectively, that were employed in the wave probe characteristic comparison experiments described in Chapter 2.
The wave conditions consisted of white-noise wave and irregular waves, as shown in
Table 3. The white-noise wave was used to analyze response amplitude operator (RAO) of platform motion and relative wave elevation, and waves with a period of 10–25 s was generated.
Fig. 6(a) shows the spectrum of the generated white-noise wave. The irregular waves were selected from the range suggested by
DNVGL (2019) and
DNV (2014), in which the relative wave elevation and slamming pressure may be large, and 3 h of waves at the real scale were generated with the JONSWAP spectrum. In addition, for each sea states, waves were generated on 16 seeds with the same spectrum but different time series. This was done to satisfy the reproducibility conditions set by DNVGL for calculating the slamming pressure and estimating the extreme values of the relative wave elevation.
Figs. 6(b) and 6(c) show the IRW01 and IRW02 spectra for one seed among the 16 seeds. These experiments were conducted under head-sea conditions (a wave direction of 180°).
4. Model Test Results
Before analyzing the relative wave elevation, the response of platform motion and relative wave elevation were analyzed. First, motion response obtained from a white-noise test was compared with the numerical analysis results. These numerical analysis results were used to estimate the asymmetric factor in the relative wave elevation analysis. The numerical analysis was performed using WADAM, which is a commercial software program developed at DNVGL. WADAM is a frequency-domain analysis program based on potential flow, and it solves diffraction/radiation problems by distributing a wave green function on the structure. Details regarding the relevant theory were presented by
Lee (1995). Additionally, for a semi-submersible platform, it is possible to estimate the motion response around the cancellation period in which the heave-motion wave excitation force disappears only if the drag force is included in the heave motion; therefore, a Morison model was used in the analysis.
Fig. 7 presents the heave and pitch motion, which were vertical motion. The solid lines indicate the results of the numerical analysis using WADAM, and the symbols indicate the results extracted from the white-noise test. As shown, the results of the numerical model agreed well with the experimental results. In the case of the heave motion, the numerical results was calculated similarly to that in the model test via the Morison model around the cancellation period at approximately 19 s. In the case of the pitch motion, the numerical results are calculated slightly larger than the model test results after 15 s, but the difference was not large; therefore, these numerical analysis results are used to analyze the relative wave elevation.
Fig. 8 presents the RAO of the relative wave elevation at the front of the column. The relative wave elevation response was calculated with consideration of the diffracted wave elevation and the platform motion. As shown, for the relative wave elevation response, the numerical results agreed well with the experimental results overall. The relative wave elevation was high at approximately 21 s when the heave motion was large. Furthermore, the motion of the structure reduced the relative wave elevation at 15 s, where the vertical motion had the opposite phase difference to the waves. In the longwave region, the relative wave elevation response converge at 0 owing to the semi-submersible platform’s property of riding waves and moving together with them. In the shortwave region, the motion response of the offshore structure was small but had a value of approximately 2 owing to the diffracted and radiated waves. A comparison of the values for the capacitance- and resistance-type wave probes revealed that the numerical analysis results and the experimental results agreed well, and there was almost no difference in the response RAO between the two wave probes.
5. Relative Wave Elevation Analysis Method
An analysis of relative wave elevation was performed according to the
DNVLG (2019) guidelines, and the asymmetric factor and the extreme upwell were calculated. First, the relative wave elevation is defined as follows considering the platform motion and the diffracted waves.
Here,
η(
x,
y,
t) and
zp(
x,
y,
t) represent the diffracted wave elevation and the vertical displacement of platform, respectively, at location (
x,
y) and time
t. The wave elevation can be divided into a linear component and a nonlinear component, and the vertical displacement of the structure can be divided into the displacement due to wave frequency, displacement due to low-frequency motion, and mean displacement. In
Eq. (1), the subscripts
L and
NL refer to the linear and nonlinear components, respectively, and
WF and
LF refer to the wave frequency and low frequency, respectively. The wave-frequency vertical displacement can be expressed by
Eq. (2) using the
ith platform motion
ξ at each location, and if the platform motion is small, it can be approximated using the right side of
Eq. (2).
The asymmetric factor is used to express the nonlinearity of the relative wave elevation, and it indicates the ratio of the nonlinear component of the wave elevation to the linear component. The asymmetric factor
α is expressed as follows:
The asymmetric factor is found by matching the 90% percentile extreme value of the model test and numerical analysis result, as indicated by
Eq. (4). The 90% percentile for the experiments is found by performing repeated experiments for several seeds corresponding to each sea state, by fitting the maximum value of the relative wave elevation for each case as a Weibull distribution. The 90% percentile in the numerical analysis is found via the distribution of the wave crests’ maximum values corresponding to each sea state using the relative wave elevation response in
Fig. 8 that was calculated in Chapter 4. For details, refer to
DNVGL (2019).
Next, the extreme values of the upwell were estimated. Upwell refers to the relative wave elevation at a position (RW02) 3m from the column wall. To find the extreme values of the upwell, it is necessary to consider not only the wave frequency component but also the low-frequency displacement and mean displacement caused by the platform motion. The extreme values of the low-frequency displacement caused by the platform motion can be calculated using
Eq. (5), assuming an exponential distribution. In this equation,
σ represents the standard deviation. The standard deviation of the low-frequency displacement can be calculated by solving a secondary problem using a program based on potential flow; however, in this study, the values that were calculated from the model tests were used for an analysis based on the model tests. Mean displacement was also used a value calculated from the model test. Finally, the extreme value of the upwell was calculated using
Eq. (7).
For the wave-frequency and low-frequency components of the relative wave elevation in the model test data used in the aforementioned analysis method, the spectrum density of the relative wave elevation was checked, and each component was extracted via low- and high-frequency pass filters, as shown in
Fig. 9(a). In this study, the data measured in the model tests were divided into low-frequency and wave-frequency components at 0.23 rad/s and analyzed.
Fig. 9(b) presents times series of the raw data and low-frequency and wave-frequency components. As shown, the refined data were used to calculate the asymmetric factor and the extreme upwell via
Eqs. (4) and
(5).
6. Relative Wave Elevation Analysis Results
A comparison of the statistical values of the relative wave elevation that were measured in the model tests was performed.
Table 4 presents the statistical values that were calculated by extracting the maximum values from the 16 seeds for each sea condition. For clarifying the results in
Table 4,
Fig. 10 shows a time series of the relative wave elevation measurements for some seeds and the relative wave elevation wave crest distribution. To compare the typical statistical values at two points, the maximum values for the 16 seeds were fitted to a Weibull distribution, and the relative wave elevation corresponding to the 90% percentile were calculated. The mean and standard deviation of the maximum values were also calculated. A comparison of the R-RW01 and RW01 values in
Table 4 indicates that the capacitance-type wave-probe results exceeded the resistance-type wave-probe results. The two wave probes had similar standard deviations, but the capacitance-type wave probe had a larger 90% percentile relative wave elevation and mean for both sea states. These results indicate that there was a significant difference in the statistical values. When the maximum values on this two wave probes for each seed were compared, the capacitance-type wave probe exhibited larger maximum values than the resistance-type wave probe for all the wave conditions of the 16 seeds. The same result was observed for R-RW02 and RW02 at points 3 m from the structure’s columns, and this can be partially seen in the results of
Fig. 10(b). The difference between the two wave probes’ measurement values was larger at the point 3 m from the column than at the point 6 m from the column. Analysis method from DNVGL uses the distribution of maximum values to analyze the relative wave elevation; therefore, the differences in the measurement values caused by the characteristics of the wave probes could affect the difference in the asymmetric factor calculated using
Eq. (4) and the extreme upwell calculated using
Eq. (7).
Table 5 and
Fig. 11 present the asymmetric factor and extreme upwell, respectively, obtained via the analysis methods presented in Chapter 5. For the asymmetric factor, the difference between the capacitance- and resistance-type probes was clearly observed. As shown in
Fig. 8, even though the RAO for the two types of wave probes were almost identical to the numerical analysis results, the calculated asymmetric factor for the capacitance-type probe was approximately 0.03–0.08 larger than that for the resistance-type probe. DNVGL suggests an asymmetric factor of 1.2 around offshore structures and 1.3 around the columns of structures. These values indicate that the nonlinear component is approximately 20%–30% of the linear component; therefore, the difference of 3%–8% in the asymmetric factor caused by the difference in wave probes cannot be ignored. As shown in
Fig. 11, there was a difference of approximately 0.6–1 m in the extreme upwell at RW02. This was related to the offshore structure’s slamming pressure, which can significantly affect the offshore structure’s design, as it is related to declaring the deck clearance. To clarify the cause of this, the relative wave elevation at the moments when differences in measurement values occurred were captured by a high-speed camera and analyzed.
Fig. 12 presents photographs and a wave time series showing the differences between the capacitance- and resistance-type wave-probe measured value. As indicated by the photographs, many breaking waves occurred around the structure, and waves that caused a run-up phenomenon along the wall bounced back and affected the wave probes. If we discuss this phenomenon in connection with the results of the wave probe comparison test, the water that bounced back may not form a circuit or affect the resistance-type wave probe enough to be measured; however, in the case of the capacitance-type wave probe, this water can be captured as a measured value; therefore, the capacitance-type wave probe shows larger measurement values than the resistance-type wave probe. Also, in breaking wave condition, the measured value of the capcitance-type wave probe was larger than the value of resistance-type.
An analysis of relative wave elevation can be affected by the differences in the results of the model tests that are caused by the measurement principles of the wave probes. As such, these results should be examined in depth. If an study which must includes water bubble effect, a capacitance-type wave probe is appropriate for the model tests. Otherwise, a resistance-type wave probe should be used for the model tests. The results of this study suggest that to select a suitable wave probe for model tests, it is necessary to examine the physical phenomena that must be analyzed.
7. Conclusions
In this study, the differences of analysis results for the relative wave elevation around semi-submersible platforms due to the characteristics of the wave probes were examined through the model test. Wave probe comparison experiments were performed to compare the measured value according to the wave-probe characteristics in a 2D wave tank by the differences in the wave probes’ measurement principles. In addition, the effects of these characteristics differences on the relative wave elevation analysis for semi-submersible platforms were investigated. The analysis of relative wave elevation was performed via semi-submersible platform model tests according to the method suggested by DNVGL, and the measured values of the two types of relative wave elevation wave probes were compared. The following conclusions are drawn.
In the breaking-wave condition in the 2D wave tank experiment, the capacitance-type wave probe’s measurement values are larger than those of the resistance-type wave probe. This was due to the difference in the wave probes’ measurement principles. The resistance-type wave probe measures the wave elevation according to the changes in resistance between conductors below the water plane, and these changes in resistance are not significantly affected by the bubbles of breaking waves. However, the capacitance-type wave probe measures the wave elevation according to the changes in capacitance around a detector line; therefore, the effects of breaking-wave bubbles are included in the measured values, making the values larger.
The capacitance-type probe shows larger relative wave elevation than the resistance-type wave probe in the front of the semi-submersible platform column. Thus, it was found that the capacitance-type wave probe shows larger statistical values, asymmetric factors, and extreme upwell even though the motion response and numerical analysis results were similar for the parts where the two wave probes were installed. The nonlinear component of the asymmetric factor was 3%–8% larger in the capacitance-type wave-probe results than in the resistance-type wave-probe results, and the extreme upwell were approximately 0.6–1.0 m larger. The photographs using a high-speed camera indicated that the relative wave elevation measurement values were affected by the waves breaking around the columns and the waves moving along the columns and bouncing back. And these effects were more significant for the capacitance-type wave probe than for the resistance-type wave probe. The results of this study suggest that to select a suitable wave probe for model tests, it is necessary to examine the physical phenomena that must be analyzed.
Conflict of Interest
No potential conflict of interest relevant to this article was reported.
Funding
This study is funded by the “SHI-KRISO cooperative research program for enhancement of offshore structure design technology (PSI8680)” and the “Development of core technology for computational fluid dynamics analysis of global performance of offshore structures (PES3940)” supported by the Korea Research Institute of Ships and Ocean Engineering. We greatly appreciated all the received support.
Fig. 1.
Wave probes used in the comparative experiment
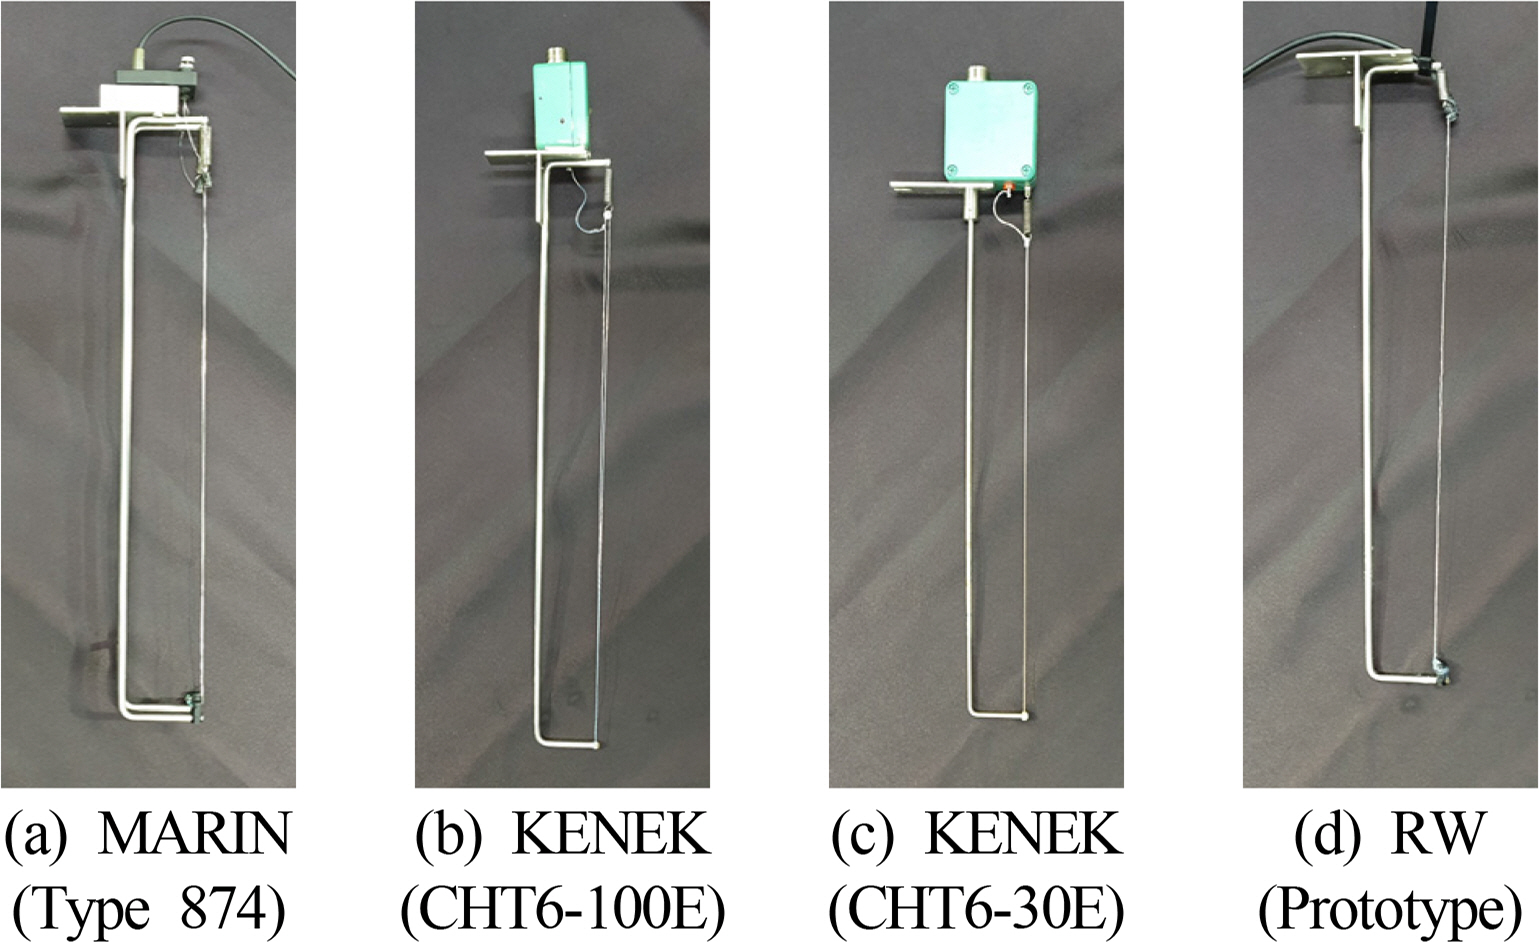
Fig. 2.
Experiment setup for comparison of the wave probes
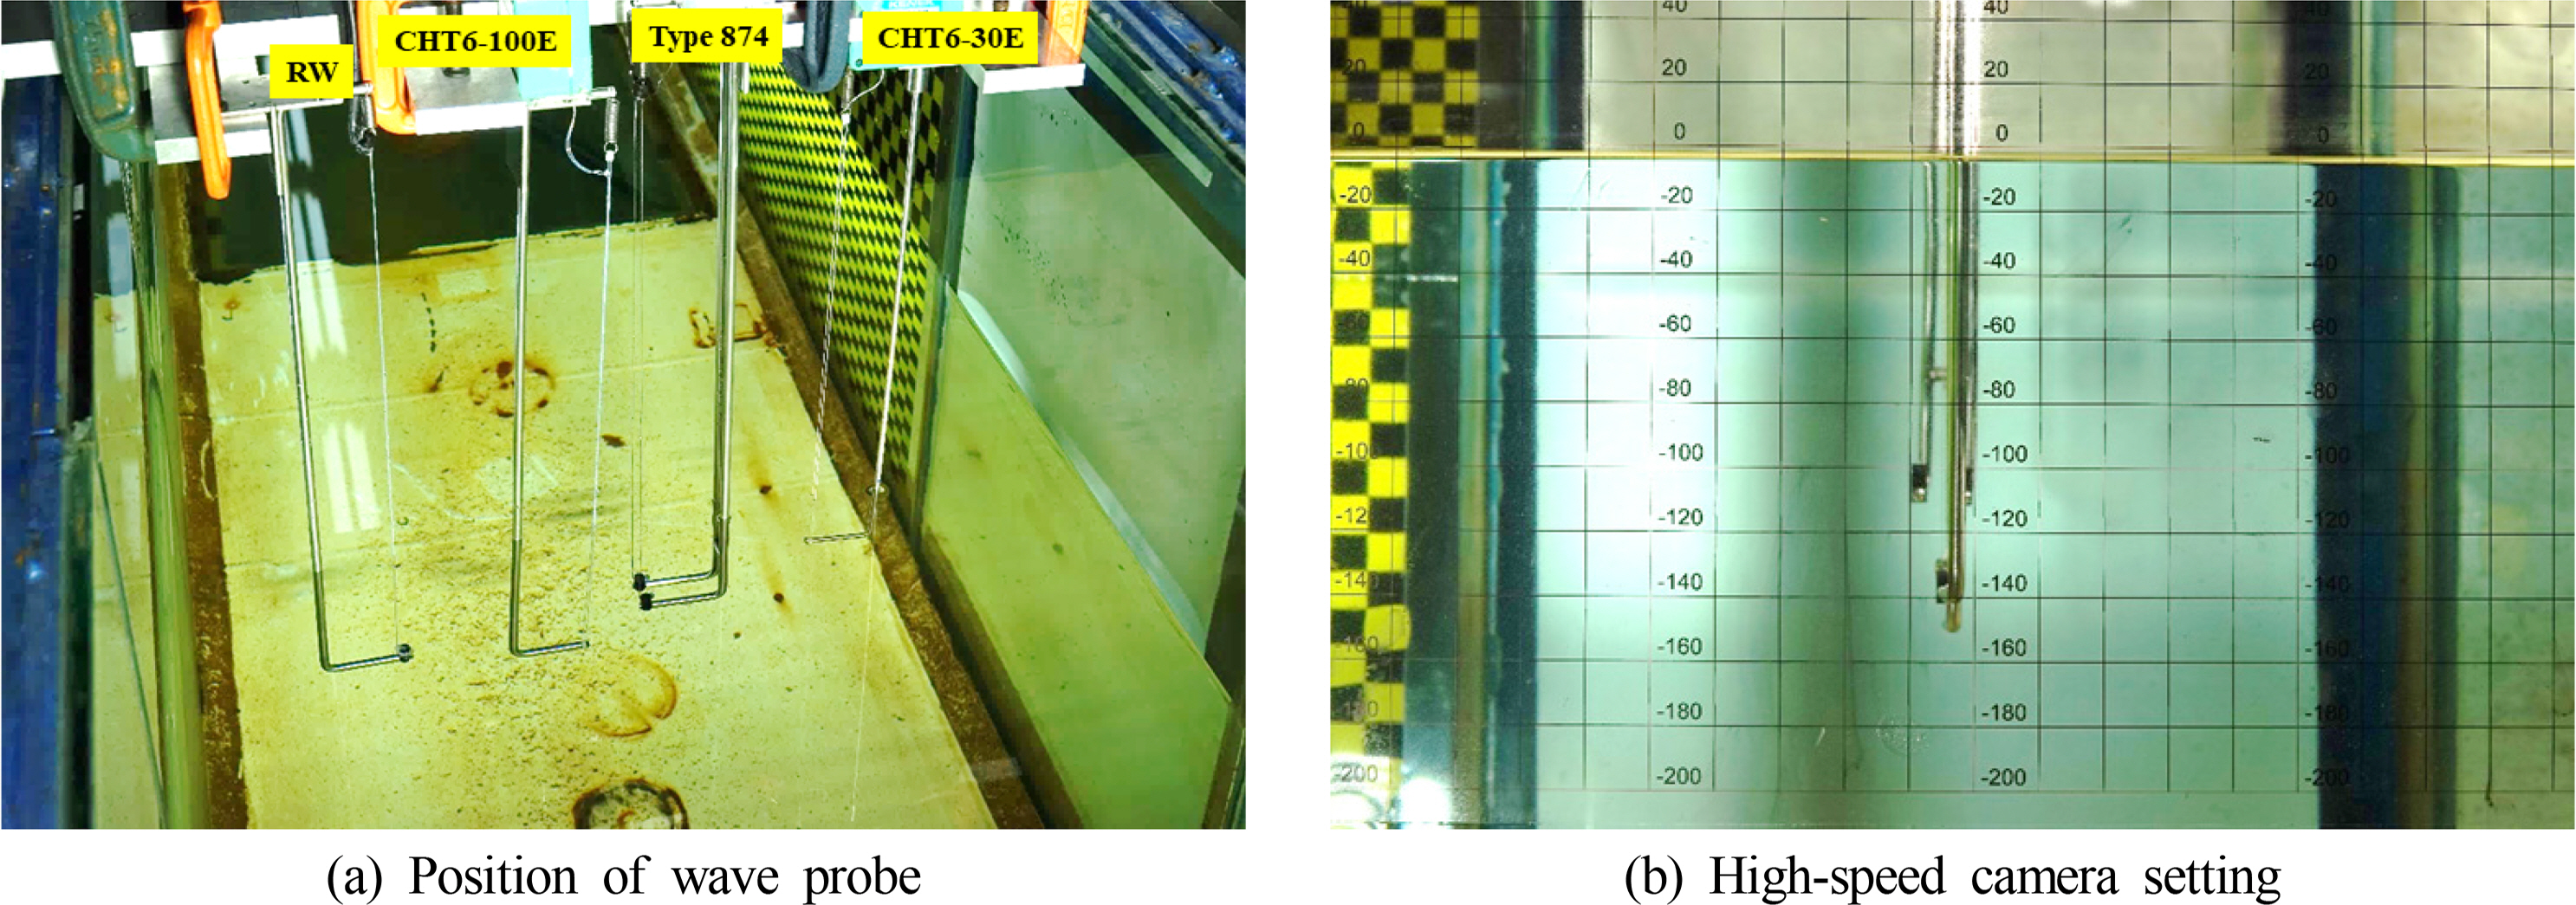
Fig. 3.
Comparison of measurements depending on the wave condition
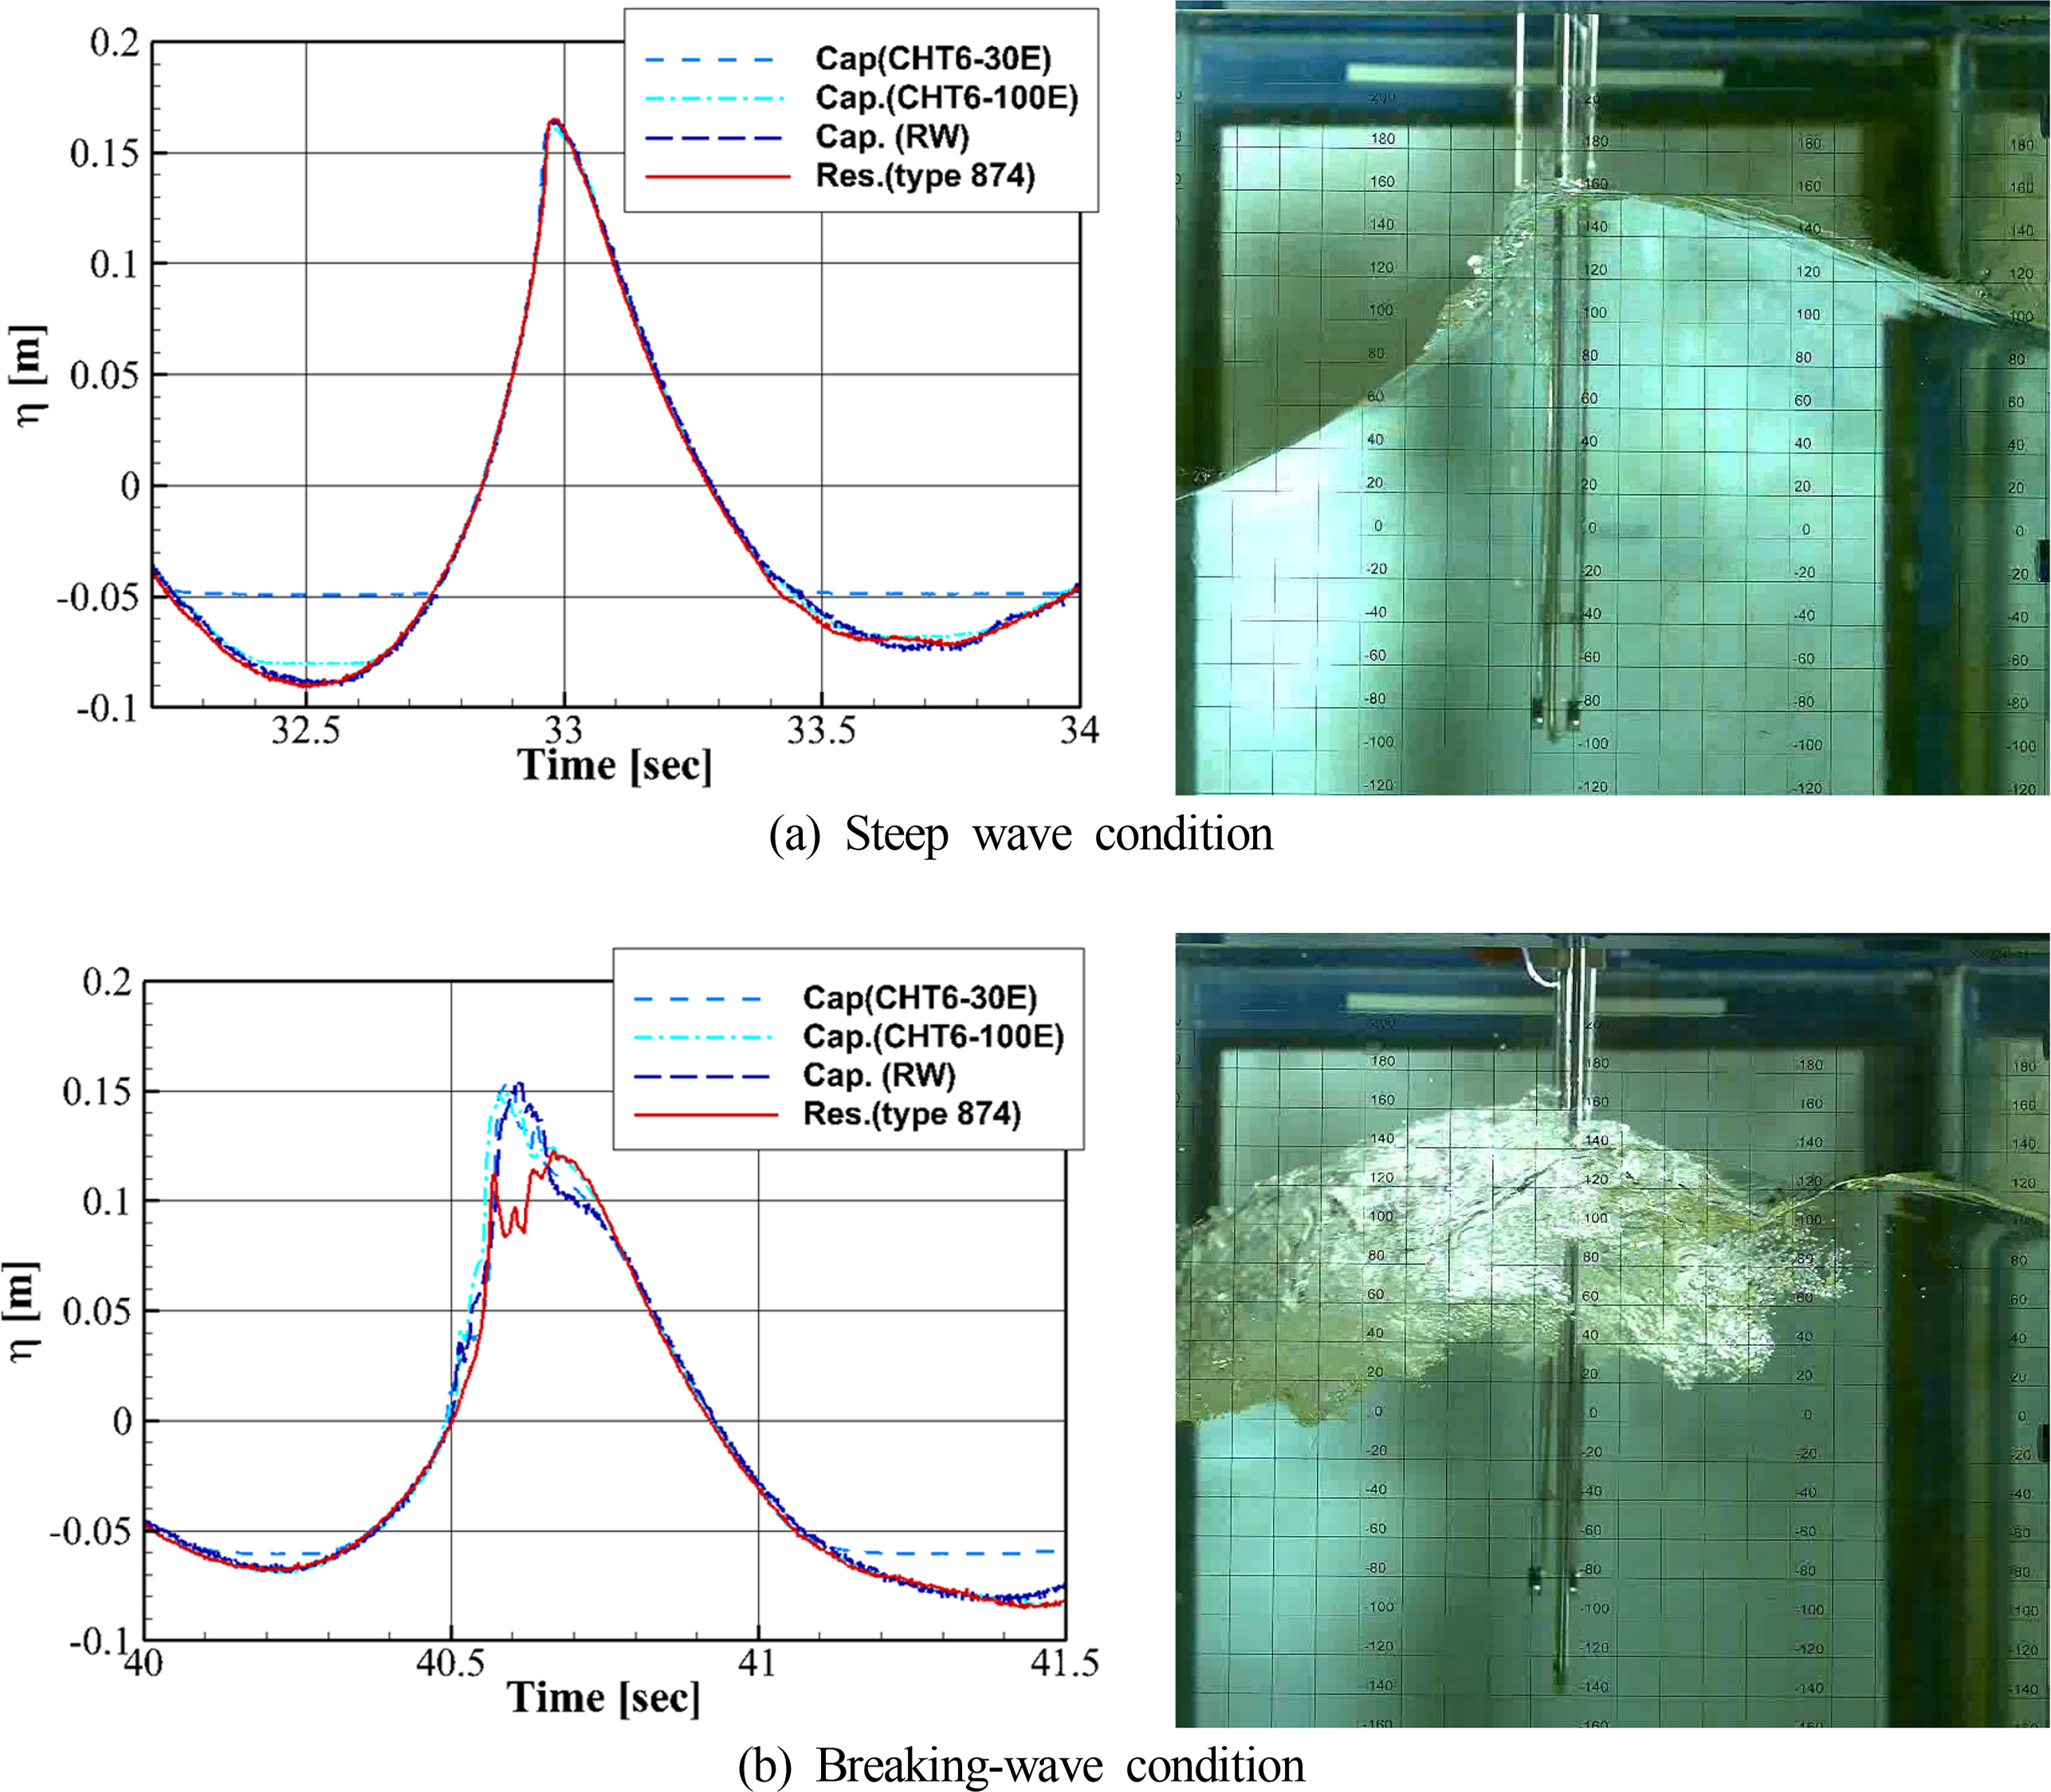
Fig. 4.
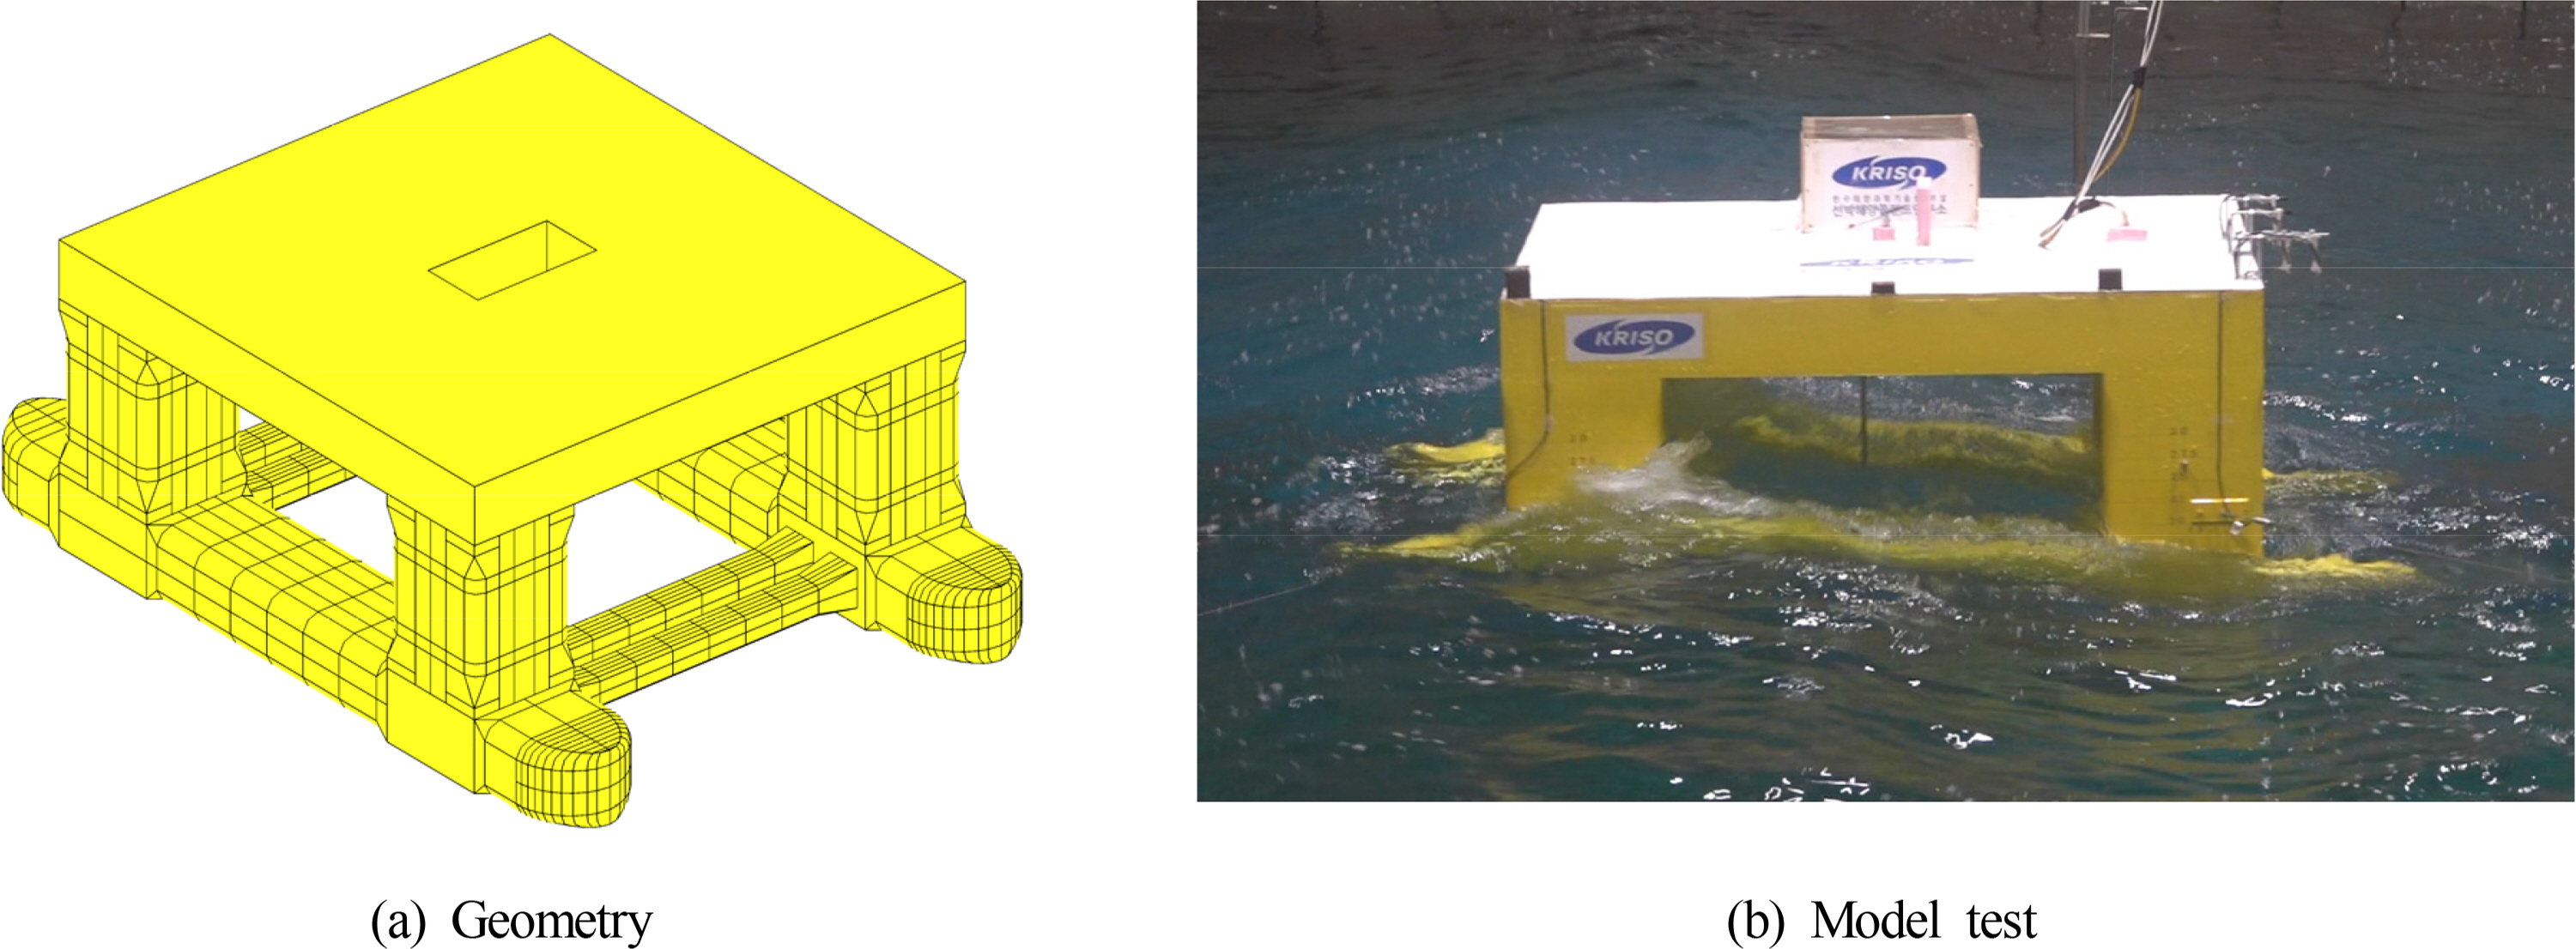
Fig. 5.
Measurement of the relative wave elevation

Fig. 6.
Wave spectra for different environmental conditions
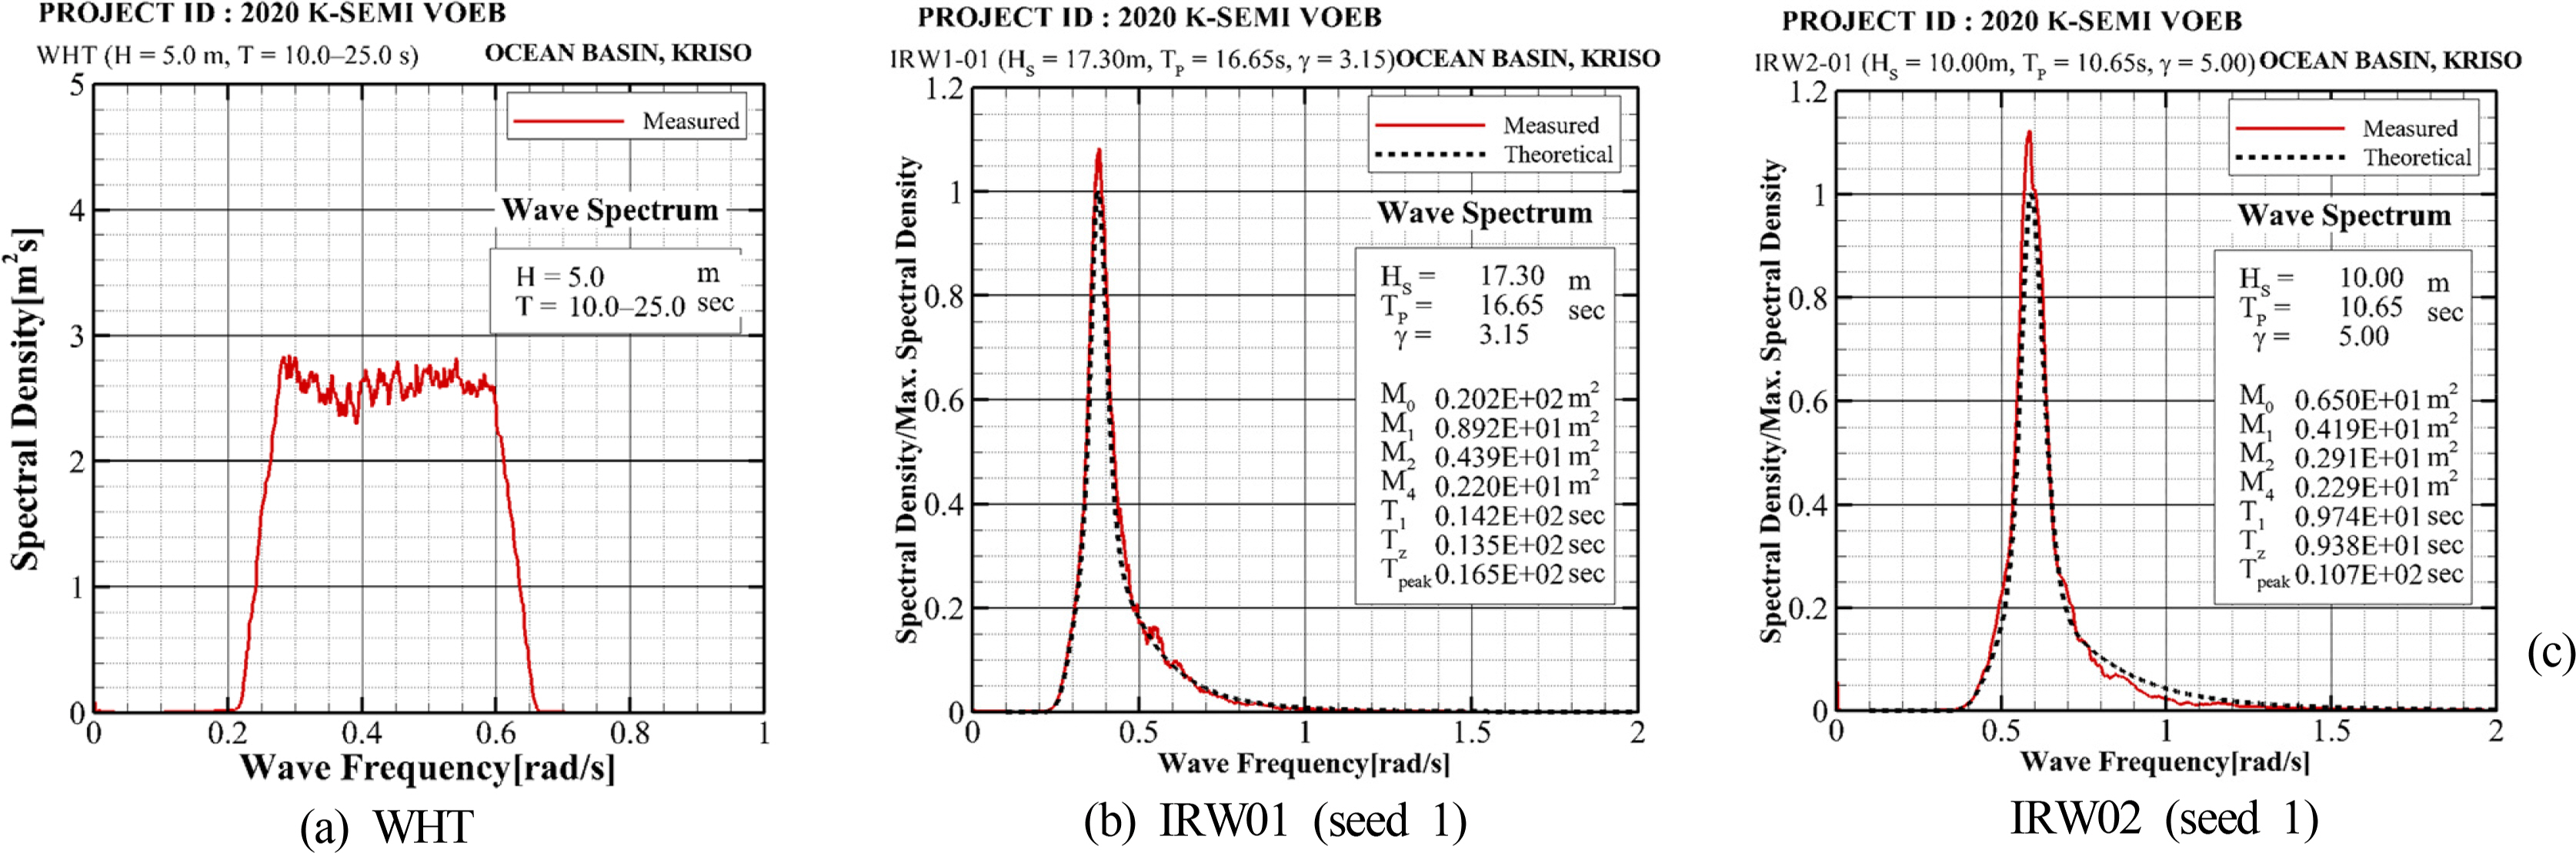
Fig. 7.
RAO of the semi-submersible platform vertical motion
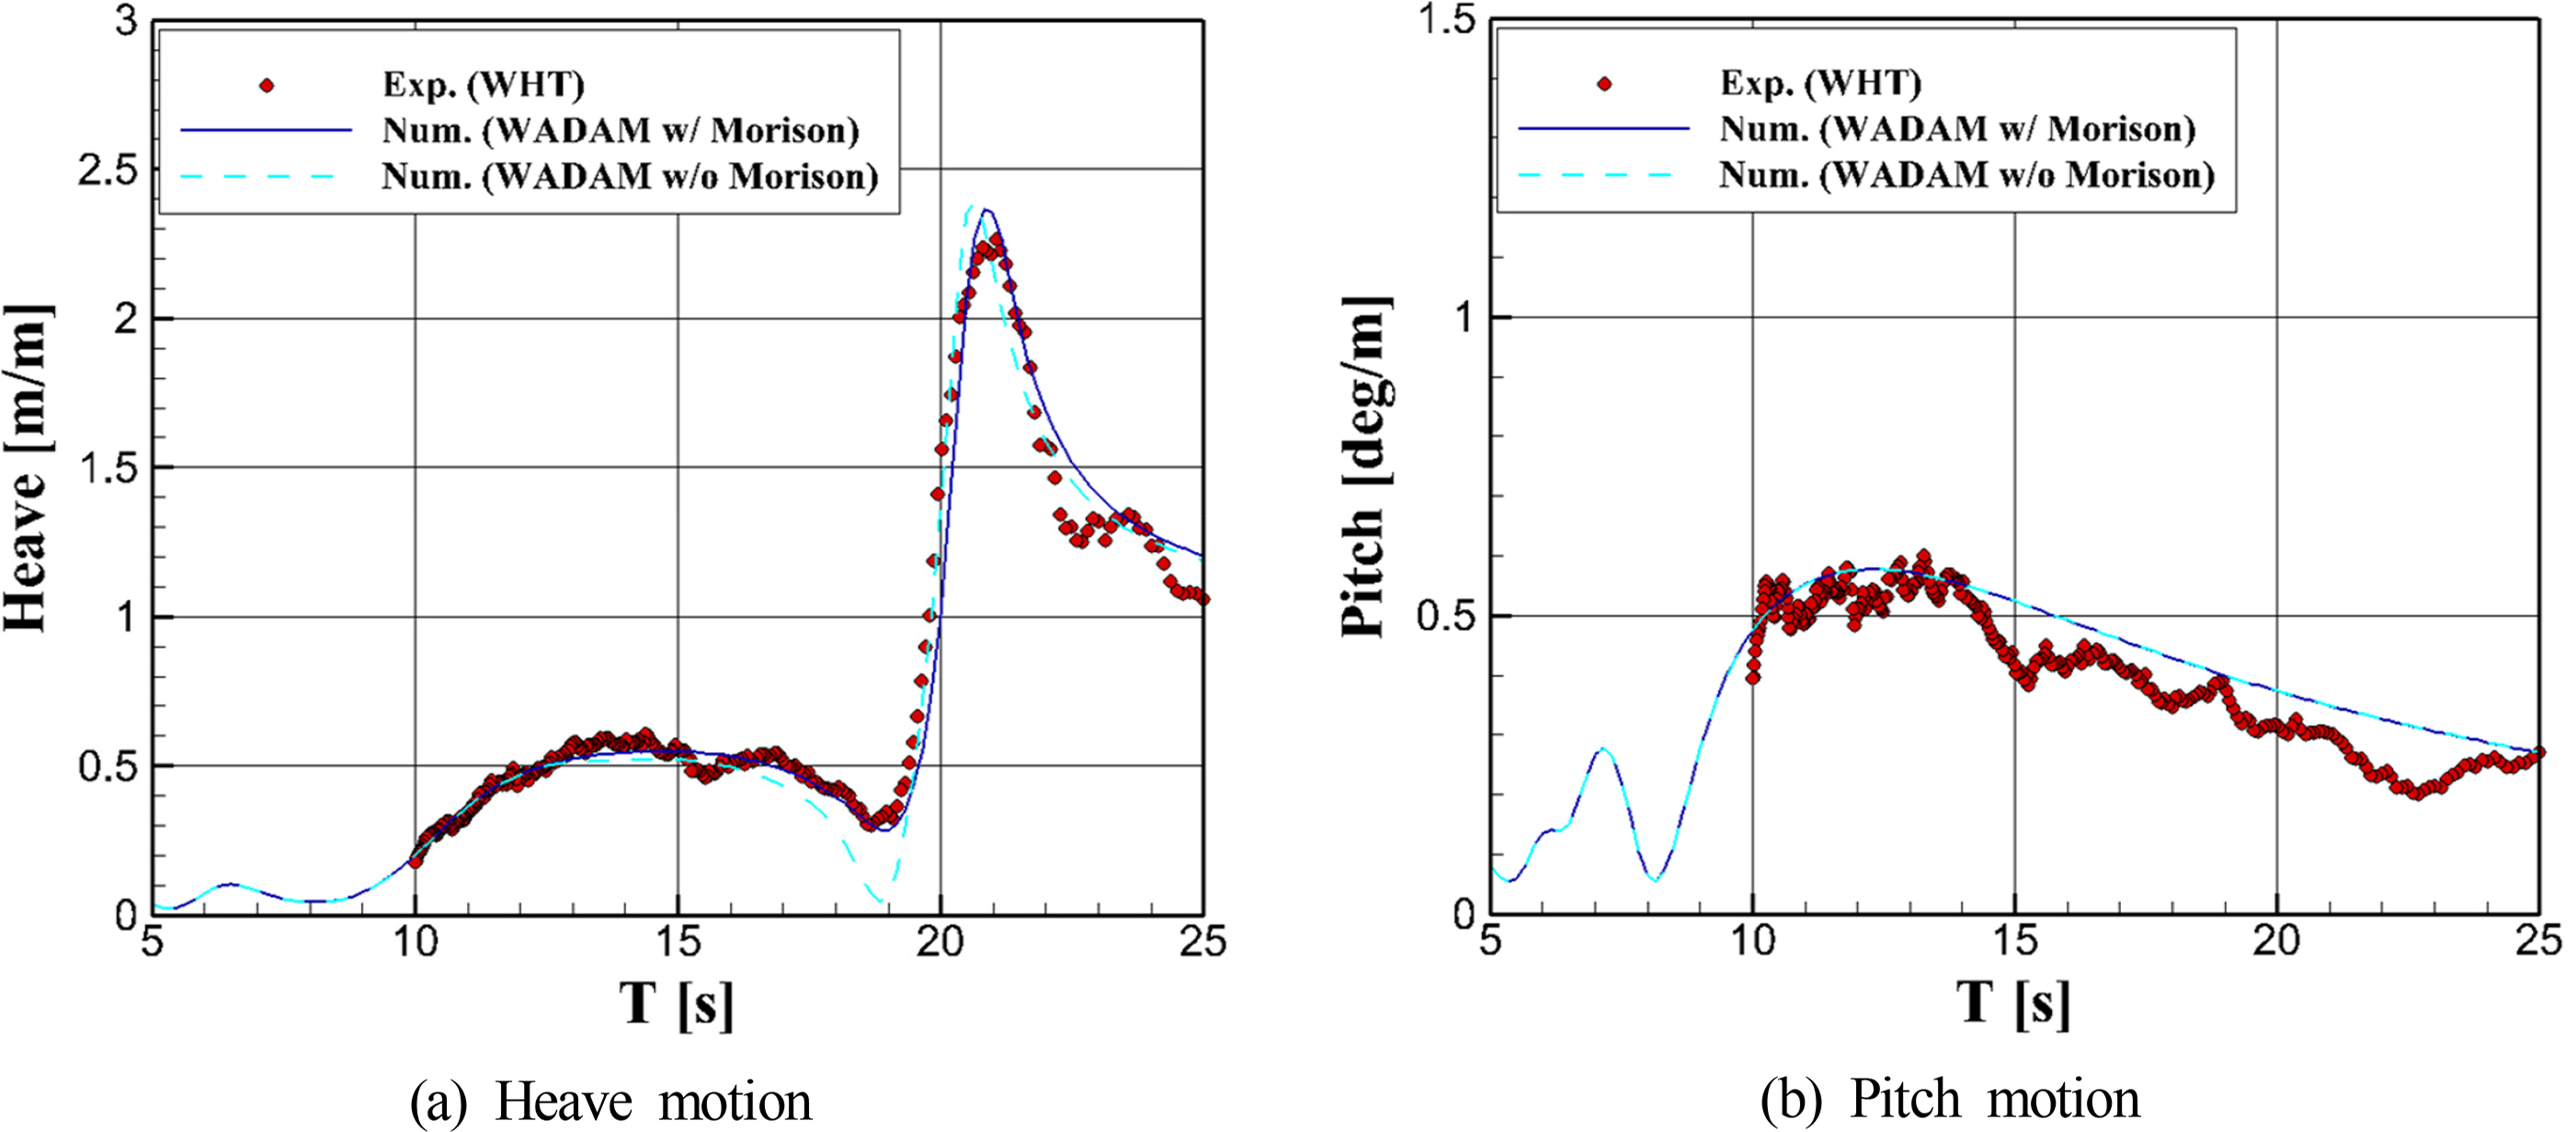
Fig. 8.
RAO of the relative wave elevation at the front of the column

Fig. 9.
Separation of each component from model test data example
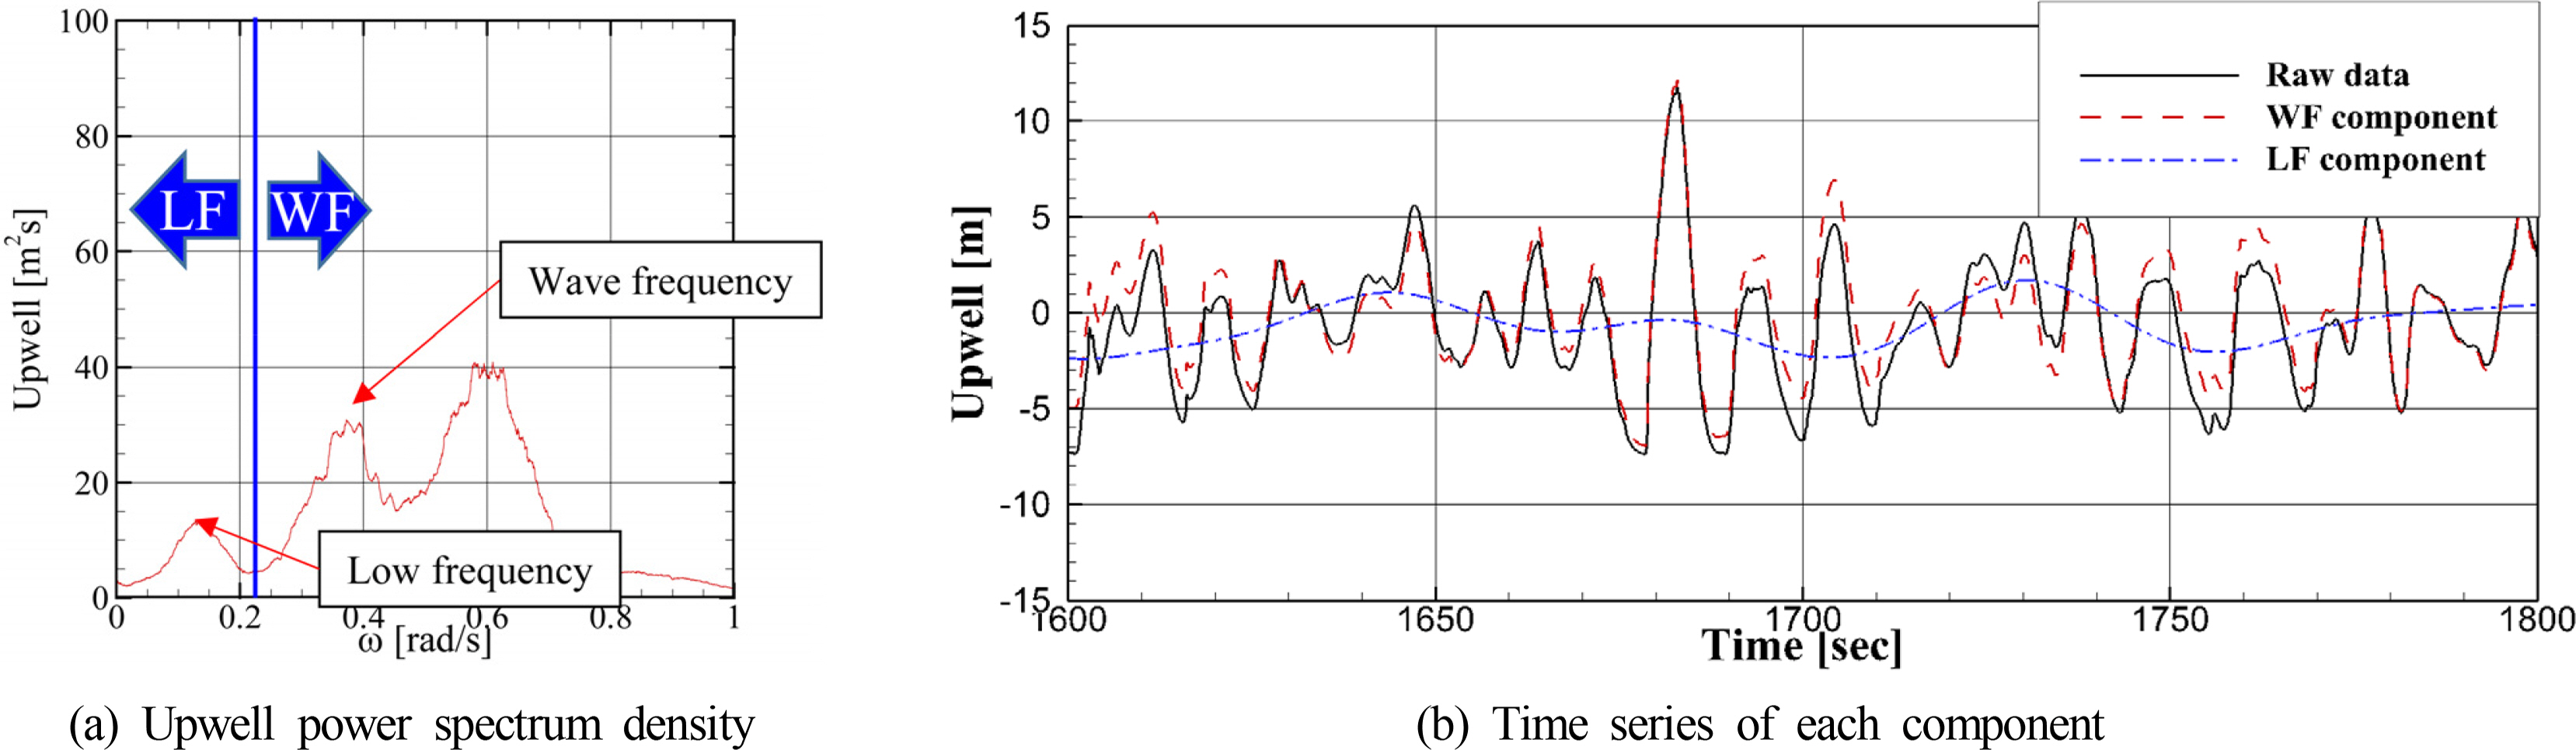
Fig. 10.
Analysis of the maximum value of the relative wave elevation
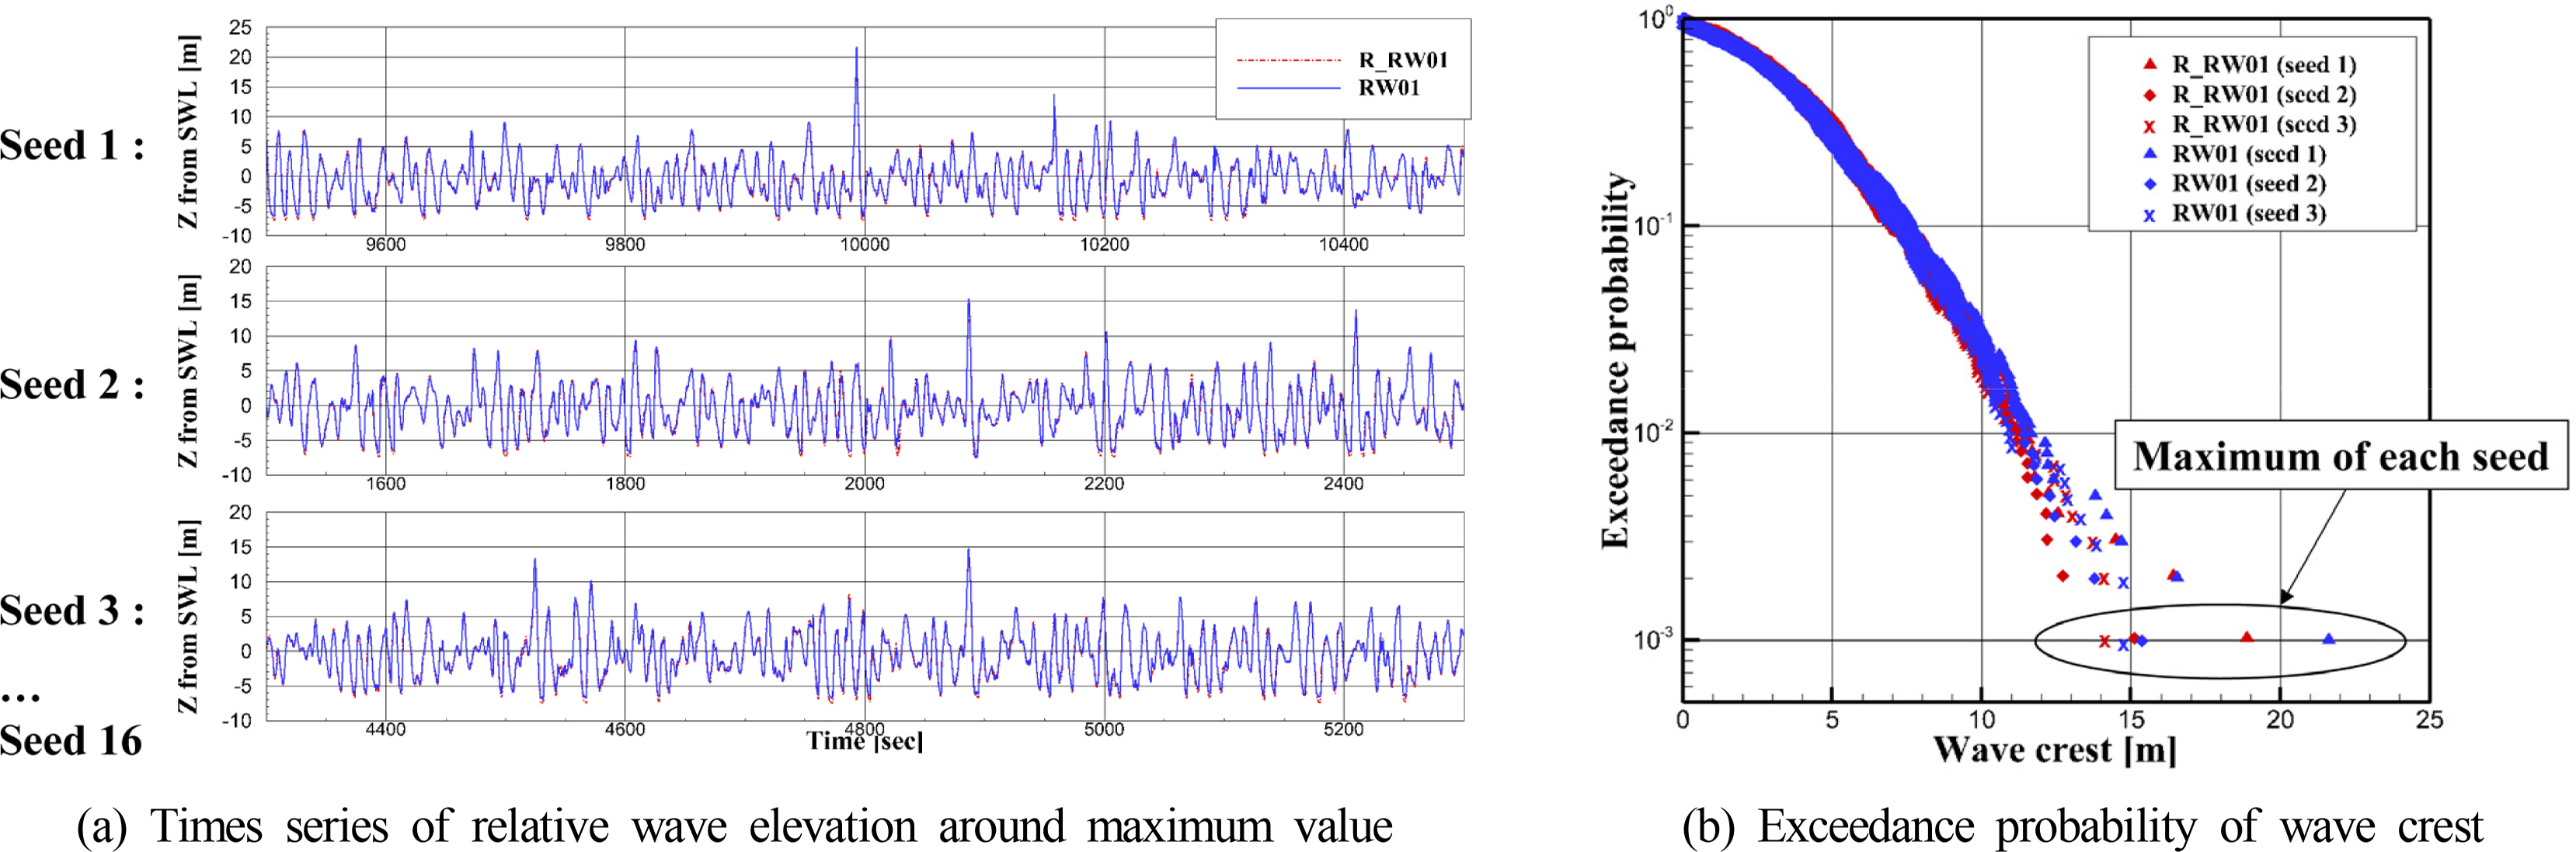
Fig. 11.
Extreme upwell and Largest upwell for RW02 and R-RW02

Fig. 12.
Extreme upwell and largest upwell for RW02 and R-RW02

Table 1.
Specifications of the wave probes
|
Item |
MARIN (Type 874) |
KENEK (CHT6-100E, 30E) |
RW (Prototype) |
|
Type |
Resistance |
Capacitance |
Capacitance |
|
Power supply |
90–260 VAC, 50–60 Hz |
210–220 VAC, 50–60 Hz |
15V DC |
|
Output voltage |
10 V, 50 mA max |
Dynamic Range ±7 V |
Dynamic Range ±6.4 V |
|
Linearity |
0.1% of full scale |
0.3% of full scale |
0.5% of full scale |
|
Temperature range |
0–60 °C |
0–40 °C |
0–40 °C |
Table 2.
Main dimensions of the K-SEMI
|
Main dimension |
Unit |
Survival draught |
|
|
Prototype |
Model (1/50) |
|
Pontoon length |
m |
117.60 |
2.352 |
|
Breadth |
m |
82.60 |
1.652 |
|
Draft |
m |
19.00 |
0.380 |
|
Column width |
m |
16.8 |
0.336 |
|
Disp. |
MT |
56034 |
0.4483 |
|
GM (metacentric height) |
m |
3.63 |
0.726 |
|
Roll period |
s |
40.37 |
7.123 |
|
Pitch period |
s |
48.62 |
6.876 |
Table 3.
|
Wave ID |
Hs (m) |
Tp (s) |
γ
|
Remarks |
|
WHT |
5.00 |
10–25 |
- |
Motion & RW RAO |
|
IRW01 |
17.30 |
16.65 |
3.15 |
Slamming & upwell (16 seeds) |
|
IRW02 |
10.00 |
10.65 |
5.00 |
Table 4.
Statistics of the maximum value of the relative wave elevation for 16 seeds
|
Item |
Unit |
6 m from column |
3 m from column |
|
|
R-RW01 |
RW01 |
R-RW02 |
RW02 |
|
IRW01 |
90% percentile (Weibull) |
m |
18.55 |
19.79 |
21.22 |
22.58 |
|
Average |
m |
15.65 |
16.43 |
18.28 |
19.37 |
|
Standard deviation |
- |
1.95 |
2.18 |
2.22 |
2.31 |
|
IRW02 |
90% percentile (Weibull) |
m |
14.31 |
14.75 |
18.78 |
20.15 |
|
Average |
m |
12.90 |
13.43 |
14.75 |
17.96 |
|
Standard deviation |
- |
0.95 |
0.93 |
1.49 |
1.62 |
Table 5.
Asymmetric factor at the front of the column
|
6 m from column |
3 m from column |
|
|
R-RW01 |
RW01 |
R-RW02 |
RW02 |
|
IRW01 |
1.104 |
1.176 |
1.232 |
1.309 |
|
IRW02 |
0.843 |
0.875 |
1.073 |
1.158 |
References
ABS. (2018). Air Gap and Wave Impact Analysis for SemiSubmersible, Houston, USA. American Bureau of Shipping.
DNVGL. (2019). Prediction of Air Gap for Column Stabilised Units, Oslo, Norway. Det Norske Veritas.
DNV. (2014). Environmental Condition and Environmental Load, Oslo, Norway. Det Norske Veritas.
ITTC. (2017). Testing and Extrapolation Methods Loads and Responses, Ocean Engineering Floating Offshore Platform Experiments, Zurich, Swtizerland. International Towing Tank Conference.
Kvitrud, A., & Loland, AH. (2018). Observed Wave Actions on Norwegian Semi-Submersible and TLP Decks. Proceeding of the 37th International Conference on Ocean, Offshore and Arctic Engineering Madrid, Spain:
https://doi.org/10.1115/OMAE2018-77008

Lee, CH. (1995). WAMIT Theory Manual. Cambridge Mass, USA. Massachusetts Institute of Technology.
Lee, SK., Yu, K., & Huang, SC. (2014). CFD Study of Air-Gap and Wave Impact Load on Semisubmersible Under Hurricane Conditions. Proceedings of the 33rd International Conference on Offshore Mechanics and Arctic Engineering California, USA:
https://doi.org/10.1115/OMAE2014-24318
Iwanowski, B., Lefranc, M., & Wemmenhove, R. (2009). CFD Simulation of Wave Run-Up on a Semi-Submersible and Comparsion with Experiment. Proceedings of the 28th International Conference on Offshore Mechanics and Arctic Engineering Hawaii, USA:
https://doi.org/10.1115/OMAE2009-79052
Matsumto, FT., Watai, RA., & Simos, AN. (2010). Wave Run-Up and Air Gap Prediction for a Large-Volume Semi-Submersible Platform. Proceedings of the 29th International Conference on Offshore Mechanics and Arctic Engineering Shanghai, China:
https://doi.org/10.1115/OMAE2010-20165
Pessoa, J., Fonseca, N., & Stansberg, CT. (2018). Experimental and Numberical Study of the Free Surface Elevation over the Pontoons of a Semisubmersible Platform in Waves. Proceedings of the 37th International Conference on Offshore Mechanics and Arctic Engineering Madrid, Spain:
https://doi.org/10.1115/OMAE2018-78009
Stansberg, CT. (2014). Nonlinear Wave Amplification Around Column-Based Platforms in Steep Waves. Proceedings of the 33rd International Conference on Offshore Mechanics and Arctic Engineering California, USA:
https://doi.org/10.1115/OMAE2014-24569


