1. Introduction
Coastal areas are more vulnerable to storm surge disasters because of the concentration of important facilities, high utilization of underground spaces, reduction in crisis awareness of the residents, and changes in typhoon characteristics caused by global warming. In recent years, New York City was hit by Hurricane Sandy in 2012 (Matsuzaki et al., 2013) and the Philippines suffered massive storm surges in 2013 due to typhoon Haiyan (Kawai et al., 2014). Although the magnitudes of the storm surges in Japan in recent years have not reached those in other countries, the storm surge caused by Typhoon 21 in 2018 recorded the highest tidal level of 3.29 m in Osaka and updated the highest peak level of 2.93 m observed in Typhoon Nancy (2nd Muroto Typhoon) in 1961 (Investigation Team of Coastal Damage from Typhoon Jebi in 2018, 2018). In addition, Typhoon No. 15 in 2019 caused a high wave and storm surge in Tokyo Bay and other areas, resulting in power outages and water shortages across Chiba prefecture. Therefore, because typhoons have become extreme as a result of global warming, the high wave and storm surge disaster risks in coastal areas are expected to increase in the near future.
As with the tsunami measures taken after the Great East Japan Earthquake, Japan’s water control policy has also changed based on a disaster prevention/reduction viewpoint taking into account the worst case for the maximum storm surge scale beyond design conditions. The government is currently working to calculate and announce the expected flood area resulting from the largest predicted storm surge in order to reorganize the warning and evacuation system for the management of storm surge risk.
As technical support for preparing the storm surge flooding area map, the “Storm Surge Flooding Area Mapping Guide Ver 1.00” (Disaster Prevention and Restoration Division, Rural Infrastructure Department, Rural Development Bureau, 2015) (hereinafter referred to as the “guide”) was compiled in 2015. This “guide” is designed to add the wave runup height or wave overtopping to the storm surge in a storm surge flooding simulation. This is used to assess the design conditions of coastal structures. In the actual phenomena, the inundation pattern is transferred in the order of (a) the wave runup height + wave overtopping, (b) combined overtopping and overflow (transition process), and (c) overflow due to the simultaneous occurrence of high waves and storm surges. However, the guide does not present the transition process when a high wave is accompanied by storm surge, regardless of whether there is mutual interference between the high wave and storm surge. As described above, the previous studies did not cover the development of a model or identification of characteristics to express a series of processes for the wave runup height, wave overtopping, transition, and overflow.
This study was intended to develop the studies of Mase et al. (2018) and Kim et al. (2018) to improve the accuracy of the worst case storm surge and high wave simulation, in which the tide deviation is maximized at each coast based on the largest typhoon. Specifically, a wave overtopping-overflow model was constructed to continuously calculate the inundation in response to a series of inundation flow processes involving the simultaneous occurrence of high waves and storm surges (i.e., the change from the initial inundation flow due to the wave overtopping to the overlapped inundation flow in the wave overtopping-overflow transition process), and improve the understanding of the trend of the inundation flow type until reaching flooding as a result of the final overflow.
This study qualitatively and quantitatively reproduced the characteristics of the experimental results for the transitional state in which seawater was accompanied by high waves, based on the full-scale overtopping-overflow transition experiment. Next, an analysis was made of the characteristics of the time series changes in the wave overtopping-overflow transition process by applying this model under typical conditions.
2. Overtopping-overflow transition model
2.1 Existing studies
Fig. 1 shows a schematic diagram of the (a) inundation due to overflow, (b) inundation in the transition process where the overtopping and overflow are combined, and (c) inundation due to overflow. The inundation states depend on the relative positions of the sea level and top elevation and the wave state.
Reeve et al. (2008) interpreted the overtopping-overflow transition process of impervious slope structures with numerical calculations using the Reynolds-averaged Navier-Stokes equation. They compared the results of numerical calculations of the wave overtopping flow with those of empirical equations, verified their validity, and then calculated the overtopping-overflow transition process. After that, they compared the result obtained from the overflow formula at the dyke with the value calculated using the method reported by Schuttrumpf et al. (2001), which was the sum of the overflow at a top elevation of zero and the wave overtopping at the dyke. As a result, the value obtained from the numerical calculation of Reeve et al. (2008) was larger than that of Schuttrumpf et al. (2001). In addition, because the numerical results were considerably larger than the experimental results of Hughes and Nadal (2009), their precision was not good enough.
Hughes and Nadal (2009) measured the inundation flow and inundation flow in the overtopping-overflow transition state through a 1/25 scale numerical experiment. Based on the experimental results, they obtained experimental formulas for the average overtopping overflow flow, instantaneous flow, and rate distribution of unit waves. The formula for the qws is as follows:
where g is the acceleration of gravity, Hm0 is the significant wave height obtained from the spectrum at water depth, and Rc is the relative top elevation and indicates the difference between the dyke top elevation and the water level. If the water level is higher than the dyke top elevation, Rc has a negative value.
Suzuki and Shibaki (2010) and Suzuyama et al. (2016) suggested a method to estimate the inundation flow in the overtopping-overflow transition process by adjusting coefficients of the expected overtopping flow formula and correcting the results of the overflow flow calculation of Takayama et al. (1982) to make it suitable for the flow calculation results. In this method, it is necessary to calculate the flow for each step by using an equivalent deep-water wave when calculating the inundation flow.
Tanaka et al. (2018) suggested a method to calculate the overflow using the front wave height obtained from a numerical calculation as a substitute for the equivalent deep-water wave. The overflow formula is a complex formula involving six parameters. In addition, the wave and structure conditions used for setting the parameters are limited. In particular, the condition of the small top elevation before the overtopping-overflow transition state is not included.
Li et al. (2012) examined the inundation flow in the overtopping-overflow state with an experiment using a full-scale coastal seawall with a height of 3.25 m, top width of 2.57 m, front slope of 4.25, and rear slope of 3. The experimental results were compared to the results of the combined overtopping and overflow empirical formula of Hughes and Nadal (2009) and were a good match, except for the condition where the overtopping depth was small.
2.2 Overtopping-overflow transition model
2.2.1 Formalization of inundation flow representing entire process
This study established a formula to continuously obtain the inundation flow, qws, indicating a change from the inundation due to overflow (Fig. 1(a)) to inundation in the combined overtopping-overflow field (transition process) (Fig. 1(b)), to inundation due to overflow (Fig. 1(c)), considering the mutual interference of waves and storm surges. In modeling the inundation flow in the series of processes, qws is linearized with the overflow, qw, due to waves and overtopping flow, qs, in the revetment top. In addition, the influence ratio of the waves in the combined overtopping-overflow field is expressed as Ratio, which is defined on the basis of the ratio of the relative top elevation to front wave height, which is Rc/Hm0.
The overtopping-overflow transition model shown in Eq. (2) is a combined model of the overtopping flow due to waves and the overflow flow due to the flow on the revetment top. Hughes and Nadal (2009) found that the effect of overflow on the inundation flow, qws, was negligible if the overflow depth increased, and the dimensionless overflow depth met the condition of Rc/Hm0<-0.3(notethat Rc is negative when the water level is higher than the revetment top) (Fig. 1(c)). This threshold value of 0.3 could be interpreted as follows. In nonlinear waves, the wave crest is pointed and the wave through is flattened. The wave through depth of a linear wave is 0.5 times the wave height, but the wave through depth of a nonlinear wave is 0.5 times smaller than 0.5 times the wave height. Therefore, it seems that the threshold value of 0.3 indicates a threshold value in which the wave through height of an average non-linear wave is equal to the revetment top, and the flow due to overflow indicates the threshold value setting forth the inundation flow. In this model, the influence ratio of the wave, Ratio, is represented by the following equation taking account the threshold value of 0.3.
According to Eq. (3), Ratio = 1.0 under the inundation condition (Fig. 1(a)) as a result of the wave overtopping, and all the impacts of the overtopping are reflected. On the other hand, Ratio = 0 under the inundation condition as a result of the wave overtopping (Fig. 1(c)), and the impact of the overtopping is ignored. In addition, the combined overtopping and overflow field shown in Fig 1(b) corresponding to the middle of these conditions has a Ratio value that is larger than 0 and smaller than 1 considering the impact of the overtopping according to Rc/Hm0. There are a linear function, exponential function, etc. as functions representing the reduction characteristics from Ratio = 1.0 to Ratio = 0 of the combined overtopping and overflow, but the cos function is used here. The reason is later described in 3.2.
Moreover, the equations for the overtopping flow, qw, due to the wave are classified based on a large front water depth (h/HD ≥ 3), small front water depth, or the target being a land structure (h/HD < 3), as described later. The threshold value, 3, is used to distinguish a wave condition that has little effect on wave breaking and another wave condition where the wave breaking may be affected. HD is used to make this distinction and as the design wave height of the corresponding coastal structure.
2.2.2 Calculation of overflow on revetment top
The overflow qs on the revetment top due to the water rising as a result of storm surge is calculated by applying Henderson’s equation (1966) shown in Eq. (4).
The coefficient (i.e., 0.5443) of Eq. 4 is almost the same as that of Honma’s overflow formula (1940), which is used in Japan. Moreover, Mase et al. (2018) used EurOtop’s formula (Pullen et al., 2007) with a coefficient of 0.6. However, in the second edition, the coefficient of EurOtop’s formula (Van der Meer at al., 2018) became smaller. Therefore, Henderson's equation was adopted in this study.
2.2.3 Calculation of overtopping caused by wave from water depth
The overtopping flow, qw, caused by the wave when the front wave depth is large (h/HD ≥ 3) is calculated using the equation suggested by Reis et al. (2008), which is the basis of the Integrated Formula of Wave Overtopping and Runup Modeling (IFORM) that the authors have been developing.
where Rmax is the maximum wave runup height,. However, this study applied a wave runup height (Rmax)99%,100 that did not exceed 99% of the maximum runup height distribution among 100 waves, as shown in Eq. (6). In addition, the relationship between the 2% excess runup height (R2%) and the maximum runup height is as follows:
Coefficients A and B of Eq. (5) are found as follows:
where cotα is the slope inclination. (Rmax)99%,100 is obtained from the following:
where ξ is the surf similarity parameter.
Eq. (5) has the characteristics that (1) no overflow occurs when the maximum runup height is lower than the top elevation, and (2) even when the top elevation is zero, the overflow has a specific value. It can also be applied to a sloping dyke as well as a vertical wall (Reis et al., 2013). In addition, IFORM is not used in the calculation of qw because the large-scale experiments were conducted under the condition of h/Hm0 ≥ 4.96 and significantly deviated from the application conditions of IFORM.
2.2.4 Calculation of overflow due to waves in low front water depth or with land structure
For actual coastal seawalls or revetments, the installation depth may be shallow. In addition, the structures are placed on the ground, so the wave specifications may not be defined. In this case, IFORM, which is an overflow formula that is applicable to structures installed in terrestrial areas, is used for h/HD < 3. This study applied the overflow formula (Yuhi et al., 2019), which improved the accuracy of the IFORM calculation, to obtain qw.
where H′0 is the equivalent deep-water wave height, and X = ln{1 − (R)c/Rmax)}.
Here, L0 is the wavelength of a deep water wave, tanβ is the virtual grade obtained from the real cross-sectional area (Areal) between two points of the wave runup height (R2%) and the wave depth (hb) of wave breaking, and i is the sea bottom slope (=tanθ). The application ranges of Eq. (11) are h/Hm0 < 2, 0.002 < H0/L0 < 0.07, and 1/100 < i < 1/10.
In a case where the slope inclination (cotα) is more gradual than 2, the runup height in Eq. (15) and the overflow formula in Eq. (11) are the same as those suggested by Mase et al. (2013), and C = 1 is applied as in Eq. (12). Meanwhile, in the case of a steep slope with a slope inclination (cotα) of more than 2 (e.g., vertical revetment or slope revetment with a slope of 1), the section for calculation is uniformly designated as 2 for convenience (in the case of the actual section, vertical revetment or slope revetment with a slope of 1), and R2% is calculated for Eq. (16). After that, (Rmax)99%,100 in Eq. (16) is estimated, and the overflow, qw, is calculated with coefficient C corresponding to the slope inclination of the revetment subject to Eq. (11).
2.3 Comparison and review of full-scale experimental results
Li et al. (2012) conducted full-scale experiments for 11 cases, and the water level from the top (h1), normal significant wave height (Hm0), peak period (Tp), average period (Tm −1,0), overflow flow (qs), and observed inundation flow (qws) are listed in the table. The value of qw was obtained using Eq. (5) or Eq. (11), in which the specifications of a coastal seawall [the top position of 3.25 m and the slope inclination (cotα) of 4.25] and h1, Hm0, Tp, and Tm −1,0 are given. After that, qs was obtained from Eq. (4), and the inundation flow, qw, was calculated using Eq. (2).
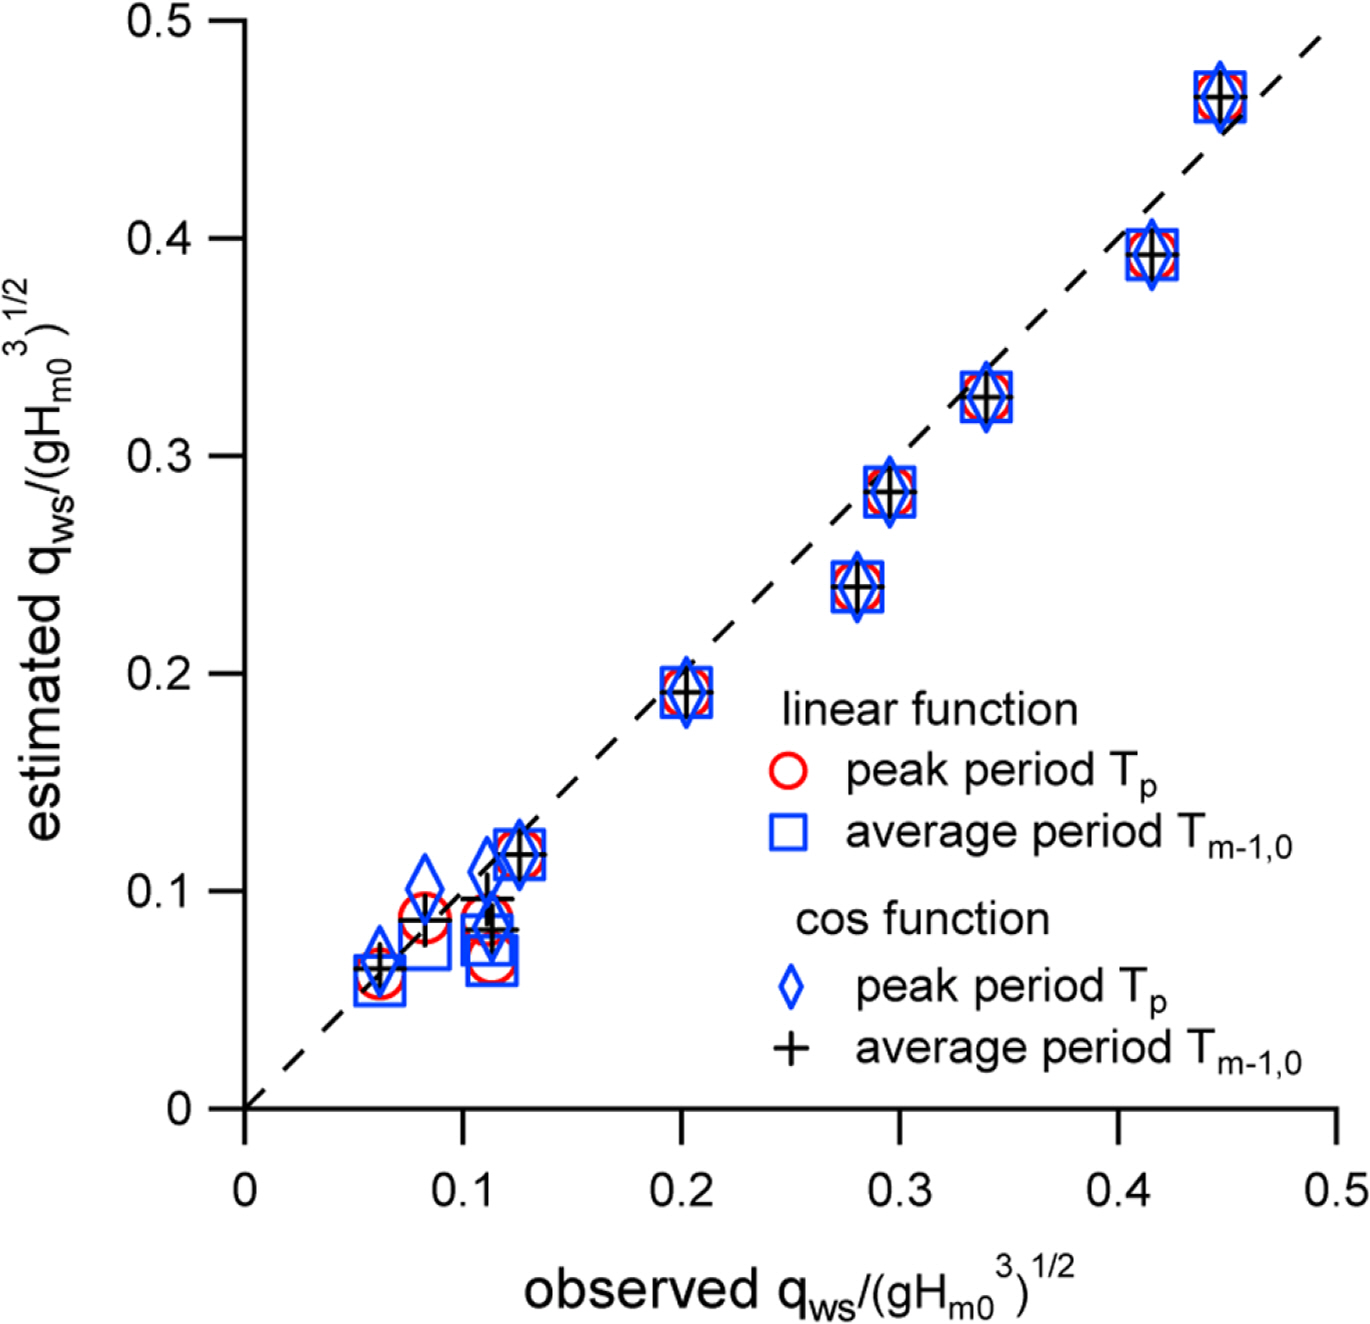
Fig. 2 is a comparison of the results of the calculation under this model with the full scale test results with respect to the dimensionless inundation flow rate at
g H m 0 3
From the wave influence (Ratio) function, it can be seen that the estimated value becomes larger than or equal to the previous value when the cosine function is applied. In addition, a comparison of the experimental and estimated results shows that they are a good match quantitatively. In particular, when Tp was applied as the period and the cosine function was the influence function for waves (diamond symbol in the figure), the agreement with the experimental results was the best.
Fig. 3 shows a comparison of the full-scale experimental results, those of the formula of Hughes and Nadal (2009) shown in Eq. (1), and the estimated results based on the model shown in Eq. (2) as full-scale experimental results in relation to the dimension inundation flow. In the estimated results, the cosine function was applied as the influence function for the waves. The results of the experimental formula, experimental results, and estimated results were a good match, but the observed or estimated results were larger than the results of the experimental formula given by Hughes and Nadal (2009) in the range of Rc/Hm0 > −0.2. Their experimental formula was obtained from experimental results on a 1/25 scale, and the scale effect for waves that could only be expressed in full-scale experiments was found to make a significant difference. The figure also shows the value according to the model of Schuttrumpf et al. (2001), which is the inundation flow calculated as the sum of the overtopping flow at the top elevation and the overflow at the dyke. His estimated results and these estimated results are also a good match in the range of Rc/Hm0 > −0.2. However, under the condition of Rc/Hm0 < −0.2, the estimated results according to Schuttrumpf et al. (2001) were fairly overestimated. This was because Schuttrumpf et al. (2001) did not consider the change in the wave influence according to the dimensionless overtopping depth, but, in such a case, the agreement of the experimental and estimated results at Rc/Hm0 < −0.8 was not explained.
3. Analysis of overtopping-overflow transition according to model topography and marine conditions
3.1 Model topography conditions and marine conditions
Fig. 4 shows the marine conditions and model topographies used for modeling. Here, Fig. 4(a) shows the change in the tidal level with the wave height period. The significant wave height and significant wave period are respectively set to linear ranges of 1–4 m and 4–8 s and then return to their initial values. In addition, Fig. 4(b) shows the conditions of the revetment installed in a location where the front water depth is sufficient. The top elements are set to 6 m and 7 m. In either case, overflow occurs during a storm surge. Fig. 4(c) simulates a coastal sidewall when the normal line is on the shoreline. There are a steep slope with a value of 0.5 and a gentle slope with a value of 4.25 for the slope inclinations (cotα). In this case, the specifications of the deep-water depth will be used as the specifications of waves at the shore-normal line. Therefore, Eq. (11) is used for the calculation of qw.
3.2 Computational results and discussions
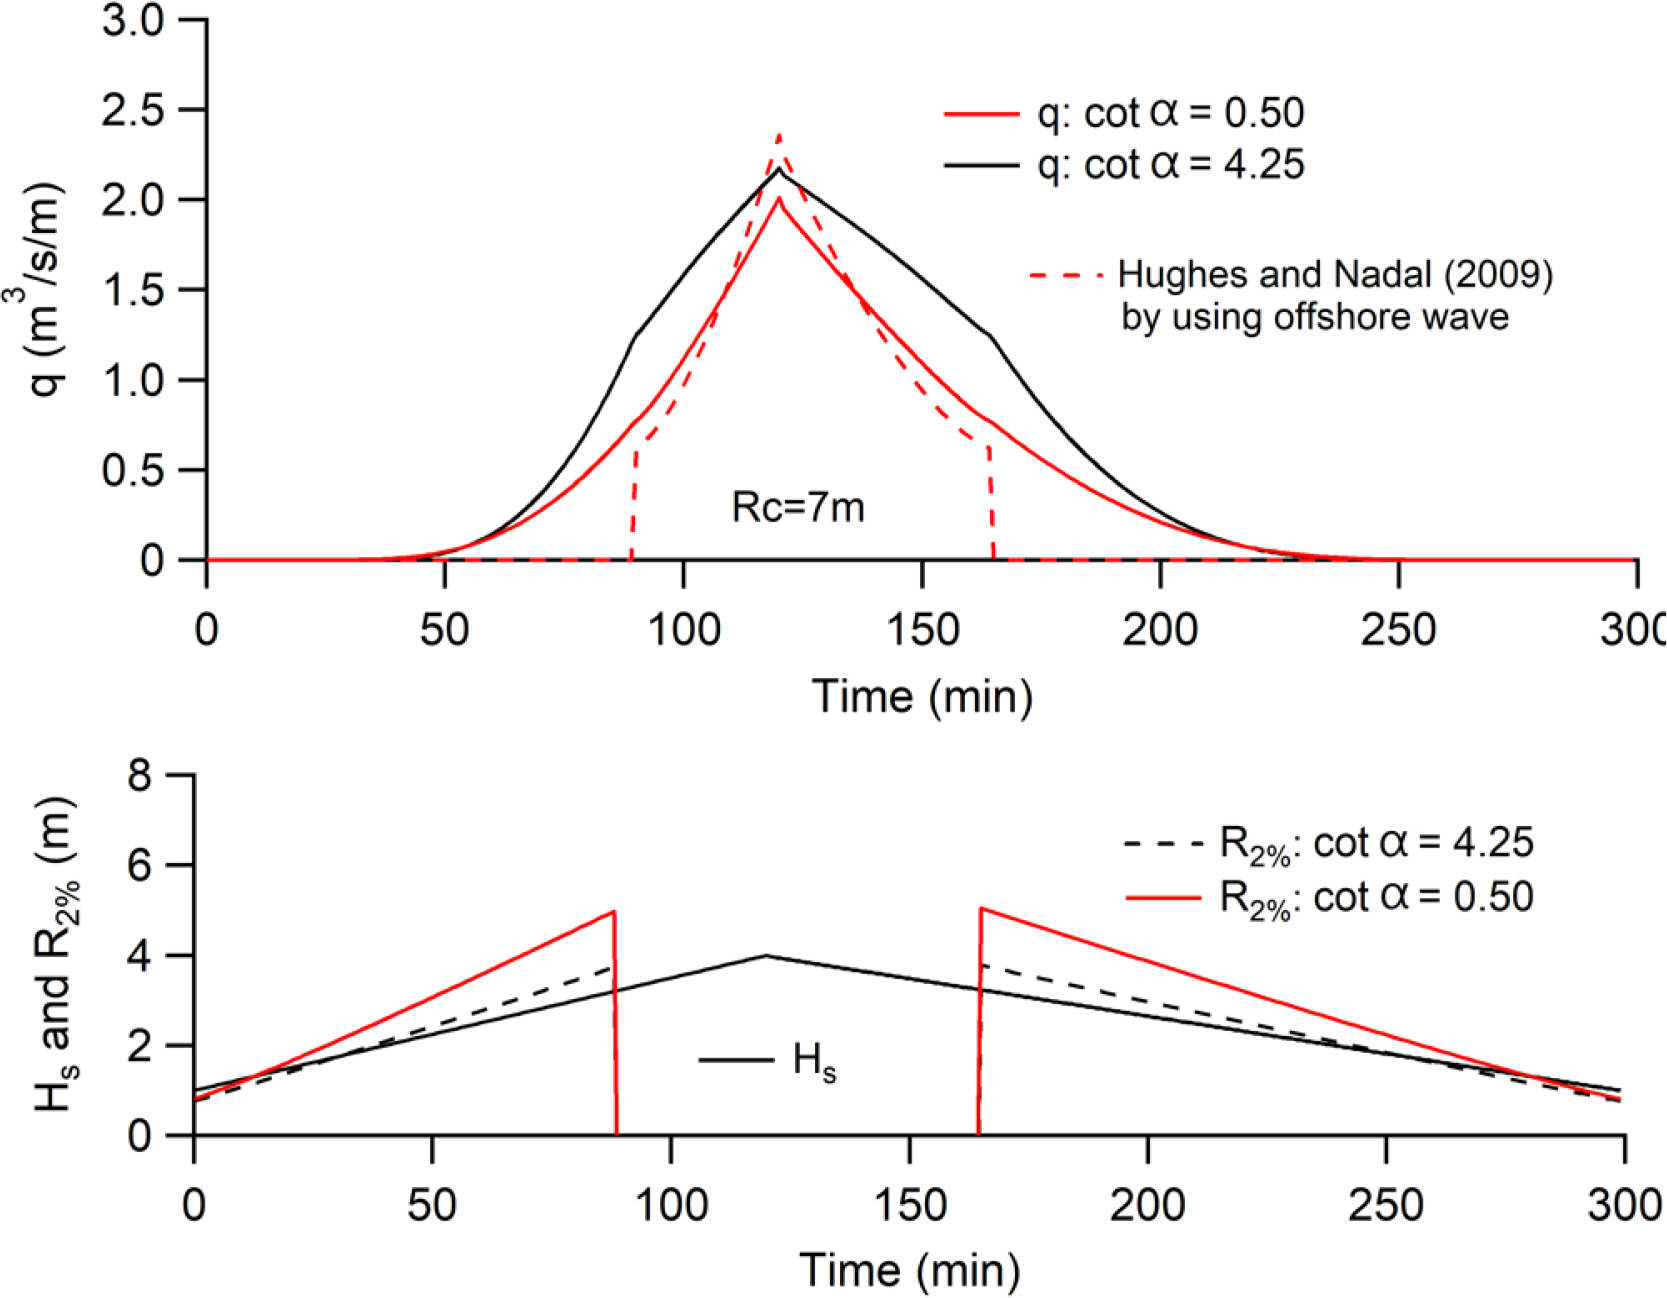
Fig. 5 shows the change over time of the wave runup height and inundation flow at the coastal shore with a gentle slope placed on the sea side. In relation to the wave runup height in the time zone when the sea level exceeds the top, the runup height (a certain value displaying the revetment top elevation) when the relative top elevation is zero is displayed. Given the inundation due to overtopping as shown in this model, it is possible to properly reproduce the start of flooding even before the start of overflow. When the top elevation is 7 m, the difference between the overflow effects in this model and the experimental formula of Hughes and Nadal (2009) is more clearly seen. In addition, when only the peak of the inundation flow is observed, the inundation flow calculated using the experimental formula of Hughes and Nadal (2009) in Eq. (1) is greater than the amount estimated by this model. This is because Eq. (1) calculates a larger value when only the overflow given in Fig. 1(c) is used in Eq. (1). In their thesis, the overflow flow (tj) is taken from the formula of Henderson (1966), but, the coefficient of the EurOtop (Pullen et al. 2007) formula in the first edition is used.
Fig. 6 shows the change over time of the wave runup height and inundation flow at the coastal shore with a gentle slope. The runup height is increased in the shore with a steep slope, but the inundation flow is reduced. These situations exactly reflect the characteristics when the runup height increases for a steep slope, but the overtopping flow decreases along the slope inclination (cotα) as the boundary. The figure maps out the experimental formula of Hughes and Nadal (2009). In this formula, however, the front wave height defined in front of the shore (normal line) is used, but the deep water height is substituted in this figure for convenience. Therefore, it should be noted that it cannot be compared strictly with the IFORM calculation results. However, the estimated result of IFORM is consistent with the experimental formula of Hughes and Nadal (2009) from the stage where the water level exceeds the shore top in the case of a shore with a gentle slope of 0.5. For the peak of the inundation flow, the experimental formula of Hughes and Nadal (2009) provides a slightly larger value, as shown in Fig. 5.
The cosine function is used for the Ratio indicating the wave influence in Eq. (3) for the following reason. When the wave influence (Ratio) in Eq. (2) is approximately reduced for Rc/Hm0 using the exponential or linear function, the contribution from the overtopping flow is rapidly reduced just after the sea level begins to cross the shore top. Meanwhile, the increase in the overflow is small during this time. As a result, the combined flow explained as the sum of both flows becomes smaller than that when the water level is consistent with the shore top and does not match the actual situation. In this case, if a cosine function is used for the expression of Ratio, it is possible to express whether the reduction of the overtopping flow proceeds gradually after the water level has crossed the shore top, and the previously indicated physical inconsistency can be avoided.
4. Conclusion
This study approximately evaluated the wave influence in the transitional state when the overtopping and overflow were combined on the basis of the full-scale overtopping-overflow transitional experiments and established an overtopping-overflow model that could accurately reproduce the experimental results in order to improve the accuracy of the storm surge inundation simulation, By applying this model, the wave runup height and inundation flow were calculated with the deviation of the storm surge and change in the wave over time, and the effect of the combined overtopping and overflow fields was examined.
The overtopping-overflow transition model constructed in this study was a combined model that estimated the overtopping flow at a top height of zero and the overflow at a dyke. As a special advantage of this model, the effect of the overtopping flow is properly expressed when the overflow water depth is small, and the characteristics of reducing and eliminating the influence of waves with an increase in the overflow water depth were well reproduced. If the front water depth of a coastal structure is large, the condition of the wave at the front water depth is used. In addition, when it is difficult to calculate the condition of the wave at the normal line installed on an extremely shallow sea or land, it is possible to calculate using the wave depth of the deep sea. Therefore, it is possible to apply under a wide range of installation conditions.