Numerical Study on Characteristics and Control of Heading Angle of Floating LNG Bunkering Terminal for Improvement of Loading and Off-loading Performance
Article information

Abstract
In this study, heading characteristics and heading control performances were evaluated to achieve the wave shield effect. The wave shield effect originating from heading control reduces the relative motions of moored vessels in a floating liquefied natural gas bunkering terminal (FLBT). Therefore, loading and off-loading performances are improved through reduced relative motion. For the objective of this study and efficiency of the analysis, a simplified model was used that assuming no relative motion of the moored vessels in the FLBT. The simplified model involved modeling the environmental loads and inertia of several floating bodies, including FLBT, into the environmental loads and inertia of a single vessel. The simplified model was validated through comparisons with model tests. With the simplified model, heading characteristics and heading control simulations were performed using low-frequency planar motion equations. The heading characteristics and heading control performances of FLBT were analyzed through the results of simulations under the expected environmental conditions. The capacity of the tunnel thrust for the heading control performance was confirmed to be adequate for improvement of the loading and off-loading performances using the wave shielding effects under the operation conditions.
1. Introduction
Owing to the regulation of exhaust gas emissions from vessels, liquefied natural gas (LNG) has been garnering attention as an alternative eco-friendly fuel for vessels. LNG is considered as one of the most realistic alternatives to satisfy SOx and NOx regulations. Such social awareness is accelerating the development of LNG-powered vessels. It is necessary to expand the LNG bunkering infrastructure to supply LNG to vessels with LNG propulsion for their smooth operation. Relevant studies have been actively conducted both nationally and globally, and their feasibility has been reviewed.
The Korea Research Institute of Ships & Ocean Engineering (KRISO) has been conducting studies on an offshore floating LNG bunkering system and has reviewed the system in terms of the design, equipment, and rules for offshore floating bunkering infrastructure. A floating LNG bunkering terminal (FLBT) unloads LNG from an LNG carrier and supplies LNG to the vessel with an LNG propulsion vessel through an LNG bunkering shuttle (LNG-BS). As the loading and off-loading operations of the FLBT are undertaken on the sea, it is essential to evaluate its operational stability in the marine environment. As 5K and 30K LNG-BSs have a relatively small displacement compared with FLBT, the work performance was observed to be degraded due to the marine environment under the operating conditions in the numerical analysis and model tests (Kim et al., 2017; Kim et al., 2018; Jung et al., 2018; Jung, 2019). Therefore, shielding the FLBT from ocean waves is essential for improving its loading and off-loading performances. A stern tunnel thruster was considered to control the heading angle of the FLBT to a constant value, to use the shielding effect for the FLBT. Numerical (Oh et al., 2019) and experimental (Park et al., 2019) studies have been conducted on the characteristics and control methods of the heading angle for the FLBT-only case using a stern tunnel thruster. However, as the loading and off-loading operations are generally performed in the environment where one or more floating bodies are moored in the FLBT, evaluation of the heading angle characteristics and control performance of the FLBT with multiple floating bodies is required.
In this study, heading angle control was numerically analyzed to evaluate the heading angle characteristics and control performance of the FLBT with multiple moored vessels. Environmental loads on the off-loading vessels, including the FLBT, were calculated through verified model tests and numerical analysis. As the mooring line of the vessel moored at the FLBT is taut, the amplitude of relative motion is small in terms of heading angle control. The relative motion of a vessel moored using the taut mooring can be ignored. Therefore, the heading angle characteristics and control performance were analyzed using a simplified model, in which the vessels moored at the FLBT were considered as a part of the FLBT. The environmental loads (wind, current, and wave) and inertia (mass, moment of inertia, and added mass) acting on the multiple vessels were replaced by the loads and inertia of a single vessel to construct a simplified model. Model tests and comparative studies were conducted to confirm the validity of the simplified model. Low-frequency planar motion simulation of the FLBT was performed using the simplified model that was validated under the environmental conditions of the expected FLBT installation position, and the heading angle characteristics of the FLBT were identified. Finally, the heading angle control performance, which is essential for the ocean wave shielding effect to improve the loading and off-loading performances, was evaluated. Proportional-derivative (PD) control was used for the heading angle control, and the Lagrange multiplier method was used as the thrust allocation algorithm. Through the performance evaluation of the heading angle control, the range of the controllable heading angles was verified, and the result can be used as a guide for the operating procedure.
2. Simplified Model for Loading and Off-loading Scenarios and Evaluation of Heading Angle Control Performance
2.1 Off-loading Scenario
The FLBT receives LNG from LNG carriers and supplies the received LNG to the vessels with LNG propulsion systems through the LNG-BS. The FLBT developed in this study is shown in Fig. 1. It was designed to receive LNG from a 170K LNG carrier and unload the LNG to 30K and 5K LNG-BSs simultaneously. According to a study on the operating procedure of the developed FLBT, it can dock up to three vessels simultaneously, and the total operation time when three vessels are docked in the FLBT for off-loading was analyzed to be significantly short compared with the entire off-loading operation time. However, to determine the range of loading and off-loading, the operating conditions when the maximum number of vessels is docked should be considered.
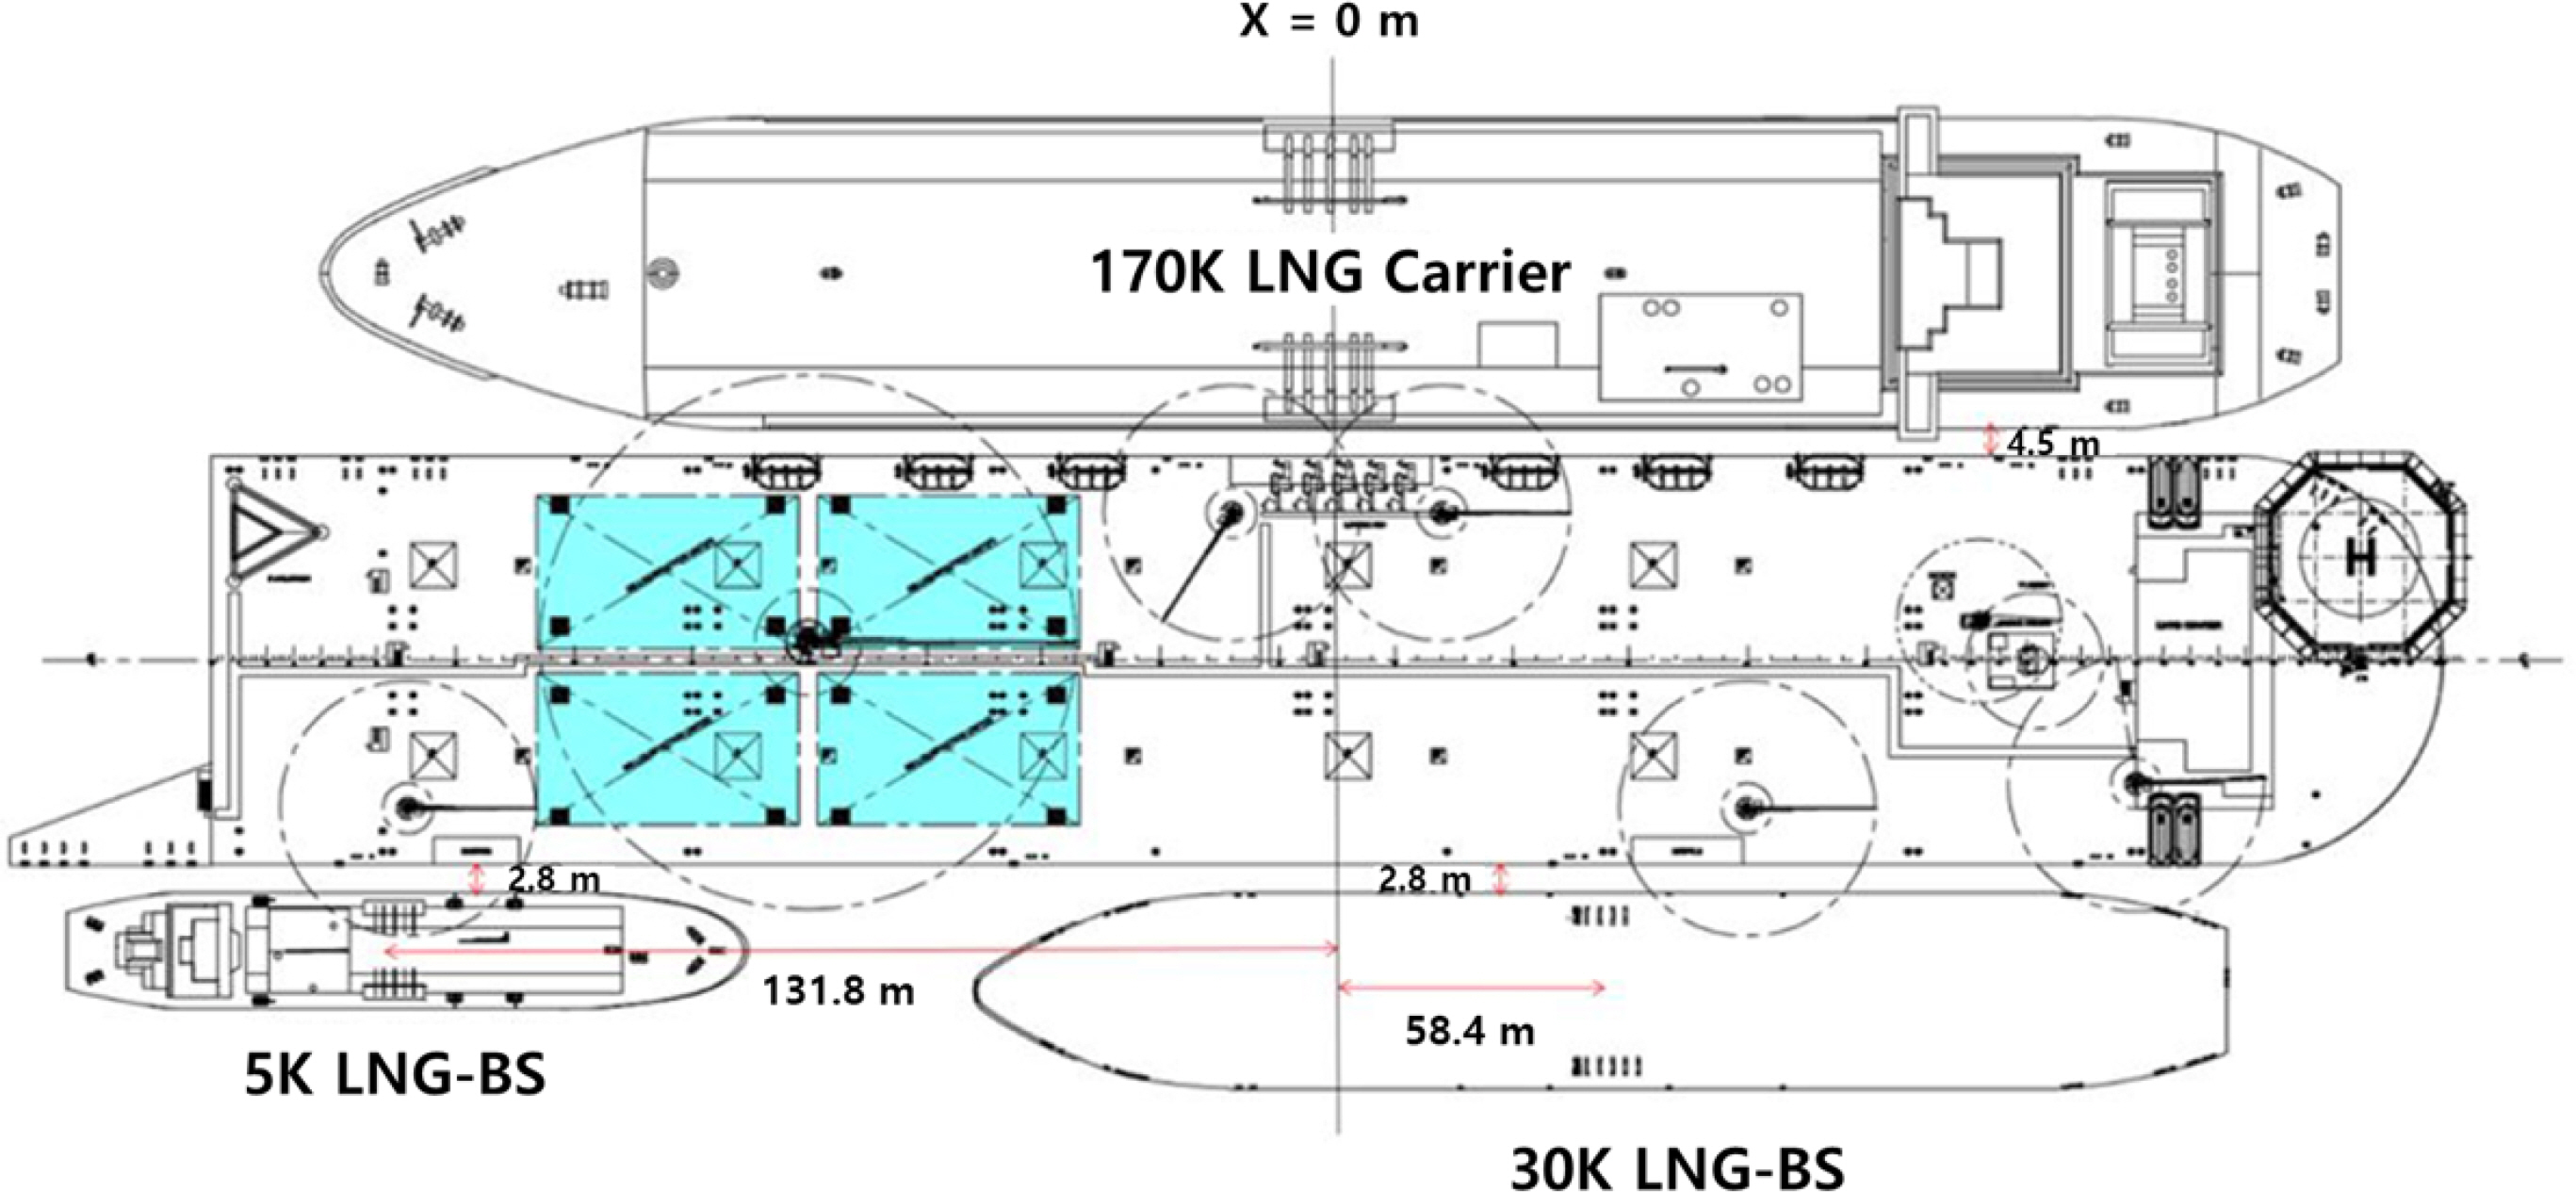
Arrangement by the scenario of loading and off-loading operations
Kim et al. (2017), Kim et al. (2018), Jung et al. (2018), and Jung (2019) conducted model tests and numerical analysis of the relative motion of docked vessels in an FLBT during operation to examine the loading and off-loading performances of the FLBT. They confirmed that it is necessary to have the shielding effect from the sea waves and maintain the heading angle to improve the loading and off-loading performances of the 5K LNG-BS. The results of the study conducted by Jung (2019) confirmed that all the vessels docked in the FLBT with the heading angles ranging from 202.5° to 225° were capable of stable loading and off-loading as shown in Fig. 2. In this study, based on studies on the operating procedure of the FLBT and the loading and off-loading performances (Kim et al., 2017; Kim et al., 2018; Jung et al., 2018; Jung, 2019), the heading angle characteristics and heading angle control performance will be evaluated to improve the loading and off-loading performances.

Maximum relative motion response in irregular wave conditions (Jung, 2019)
2.2 Environmental Conditions
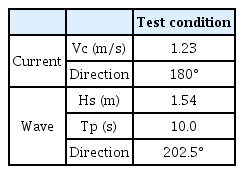
Based on the data survey on the environmental load, the wave deformation and seawater flow were numerically analyzed in the estimated installation area to evaluate the design conditions according to the frequency. As shown in Table 1, it was assumed the operating condition, under which docking, loading, and off-loading are performed, with a one-year return period.
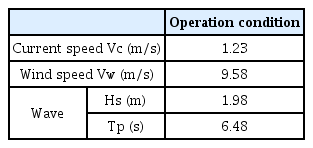
Operation conditions (1-year return period)
The environmental conditions were determined by selecting the expected installation area, as shown in Fig. 3, to evaluate the design conditions of the FLBT.
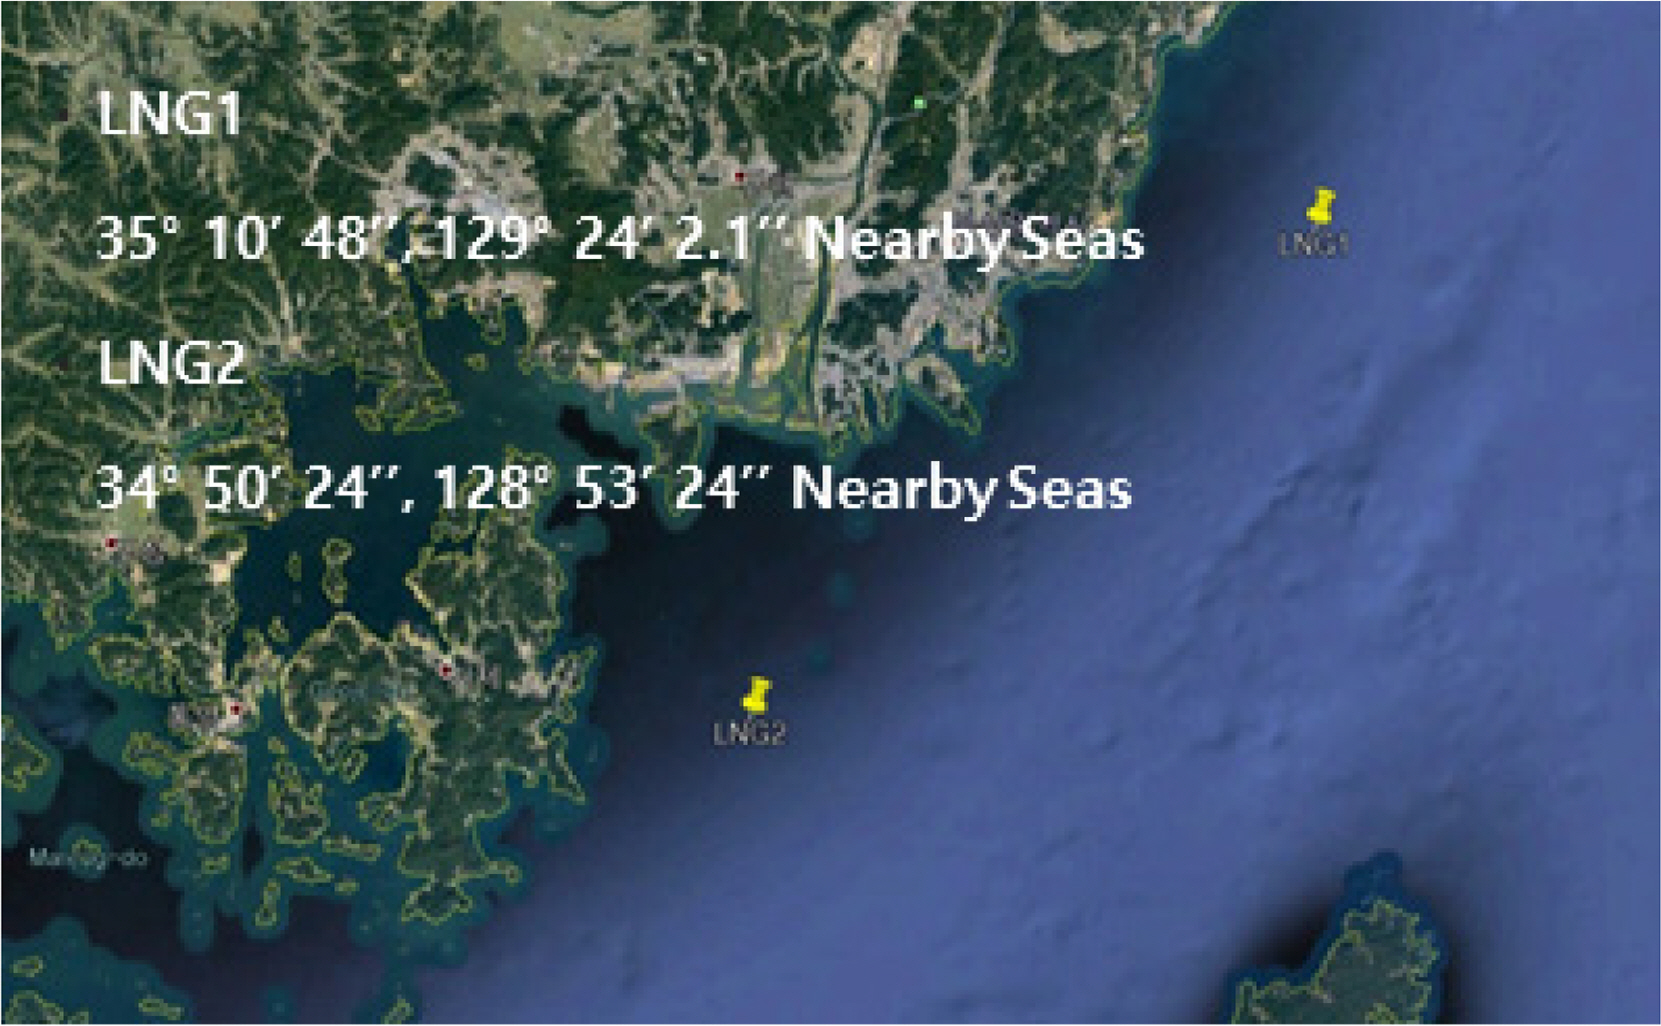
Proposed sites for FLBT operation
2.3 Simplified Model for Evaluation of Heading Angle Control Performance
The vessels under test in the LNG loading and off-loading scenarios are a 170K LNG carrier, 30K LNG-BS, and 5K LNG-BS including the FLBT. The principal dimensions of these vessels are shown in Table 2.

Principal dimensions of operating vessels
As shown in Fig. 4, the FLBT is moored through the heading turret to maintain its position, and three tunnel thrusters are installed at the stern for the heading angle control, which is advantageous for berthing, loading, and off-loading. Each thruster is designed through advanced static analysis and has a capacity of 561 kN (Oh et al., 2019).
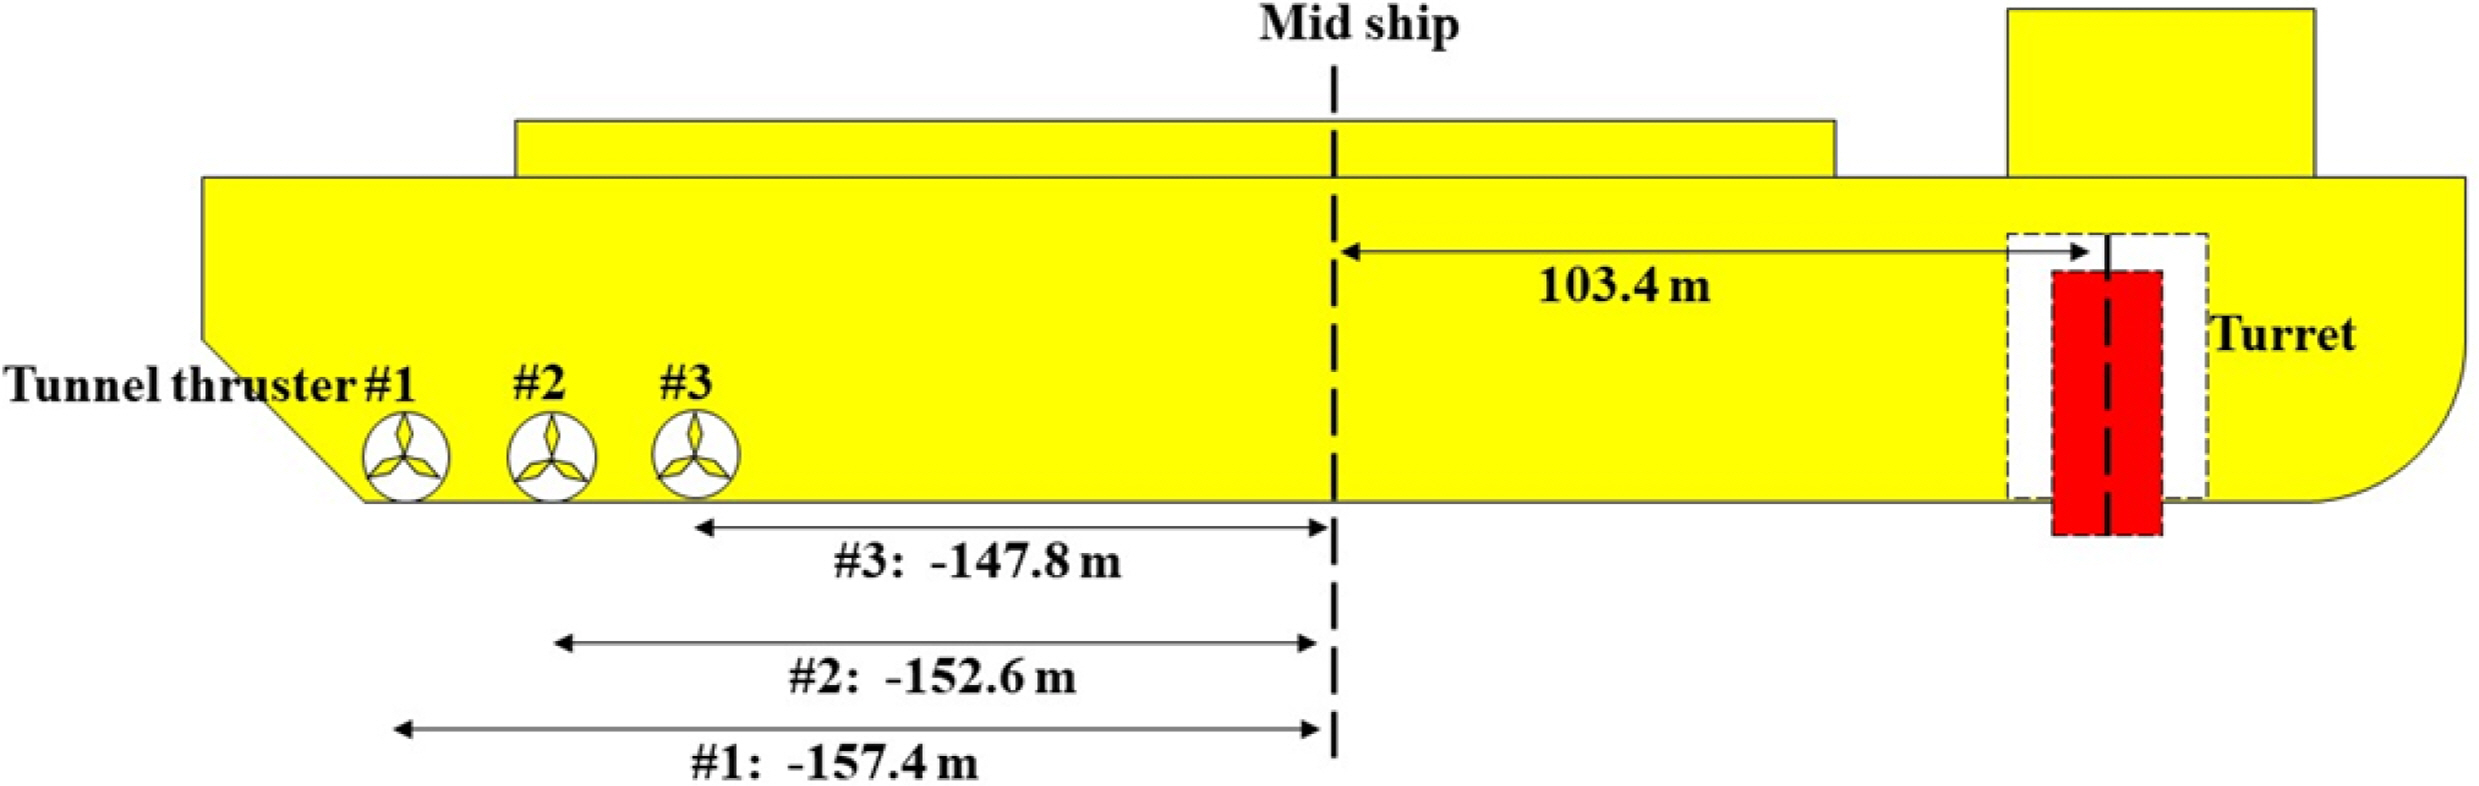
Location of tunnel thruster and turret
The FLBT is designed to maintain its position by using 15 mooring lines connected to the turret. Five mooring lines form a cluster and the angle between clusters is 120°. In this study, the mooring system was simplified to a simple tensile model as shown in Fig. 5. As three simple elongation springs are attached to the center of the turret, the turret is modeled in the simulation to have free rotation without a resistance force against rotation. This simplification process is considered suitable for accomplishing the objective of this study i.e., to understand the characteristics of the heading angle of the FLBT. In the modeling, the modeled spring constant was similar to that of the recovery curve of the mooring system (Oh et al., 2019).

Schematic for simplified mooring model
An LNG carrier, 30K LNG-BS, and 5K LNG-BS are deployed in relative positions, as shown in Table 3, via taut mooring on the FLBT, as shown in Fig. 1.

Relative positions of vessels
In this study, it was assumed that the vessel, which was moored on the FLBT, does not show any relative motion in the heading angle control. According to the previously conducted review studies on loading and off-loading performances (Kim et al., 2017; Kim et al., 2018; Jung et al., 2018; Jung, 2019), this assumption is reasonable because the maximum relative motion of the vessel was 3.27 m and most relative motions were 1.5 m or smaller. As it was assumed that there is no relative motion between floating bodies, four vessels can be simplified into one rigid body. For simplicity, the load and inertia acting on each floating body are replaced by the FLBT single-hull loading.
The mass and moment of inertia can be simply substituted with Eqs. (1)–(2).
The added mass should also be replaced with a part of the hull of the FLBT. As the heading angle simulation simulates the long-period motion, the added mass at zero frequency was calculated and used. If the frequency is assumed to be zero, then the free surface boundary condition for horizontal motion becomes a rigid wall condition. Therefore, it is defined as a double body problem. The boundary element method was used to solve the boundary value for the double body problem. This method uses the basic solution, G(x⃗, ξ⃗),, which is represented by Eq. (3), and the boundary integral in Eq. (4).
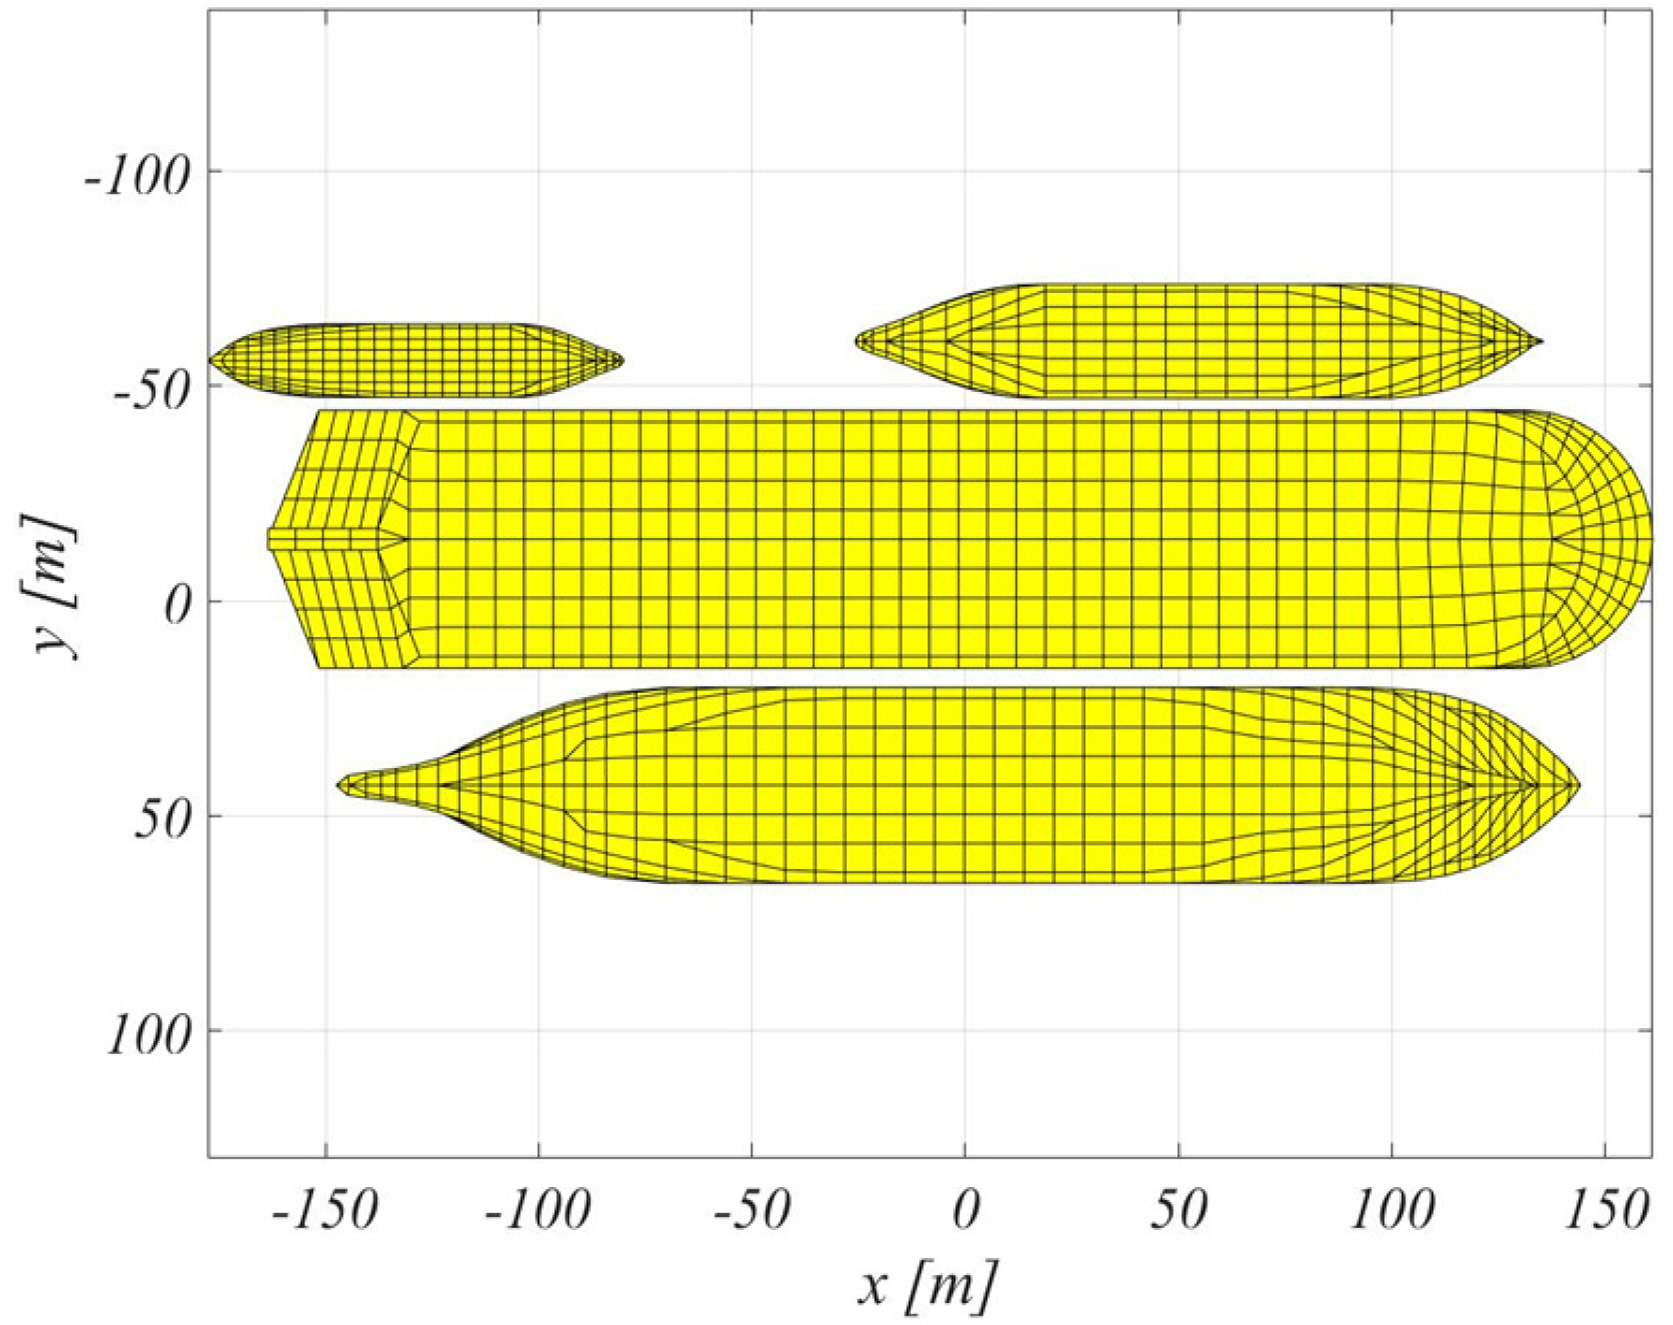
Panel mesh for the added mass of 1-body simplification (4-body)

Added mass of 1-body simplification (4-body)
The load acting on each floating body was composed of wind load, current load, and wave drift load. For the wind load, the result of the wind tunnel test conducted in the study by Park et al. (2017) was used. The wind tunnel test was conducted in Force Technology in Denmark, as shown in Fig. 7. The model ship was made of high-density polyurethane foam and was used for the test by separating the top part of the ship under test from the repair surface and below.
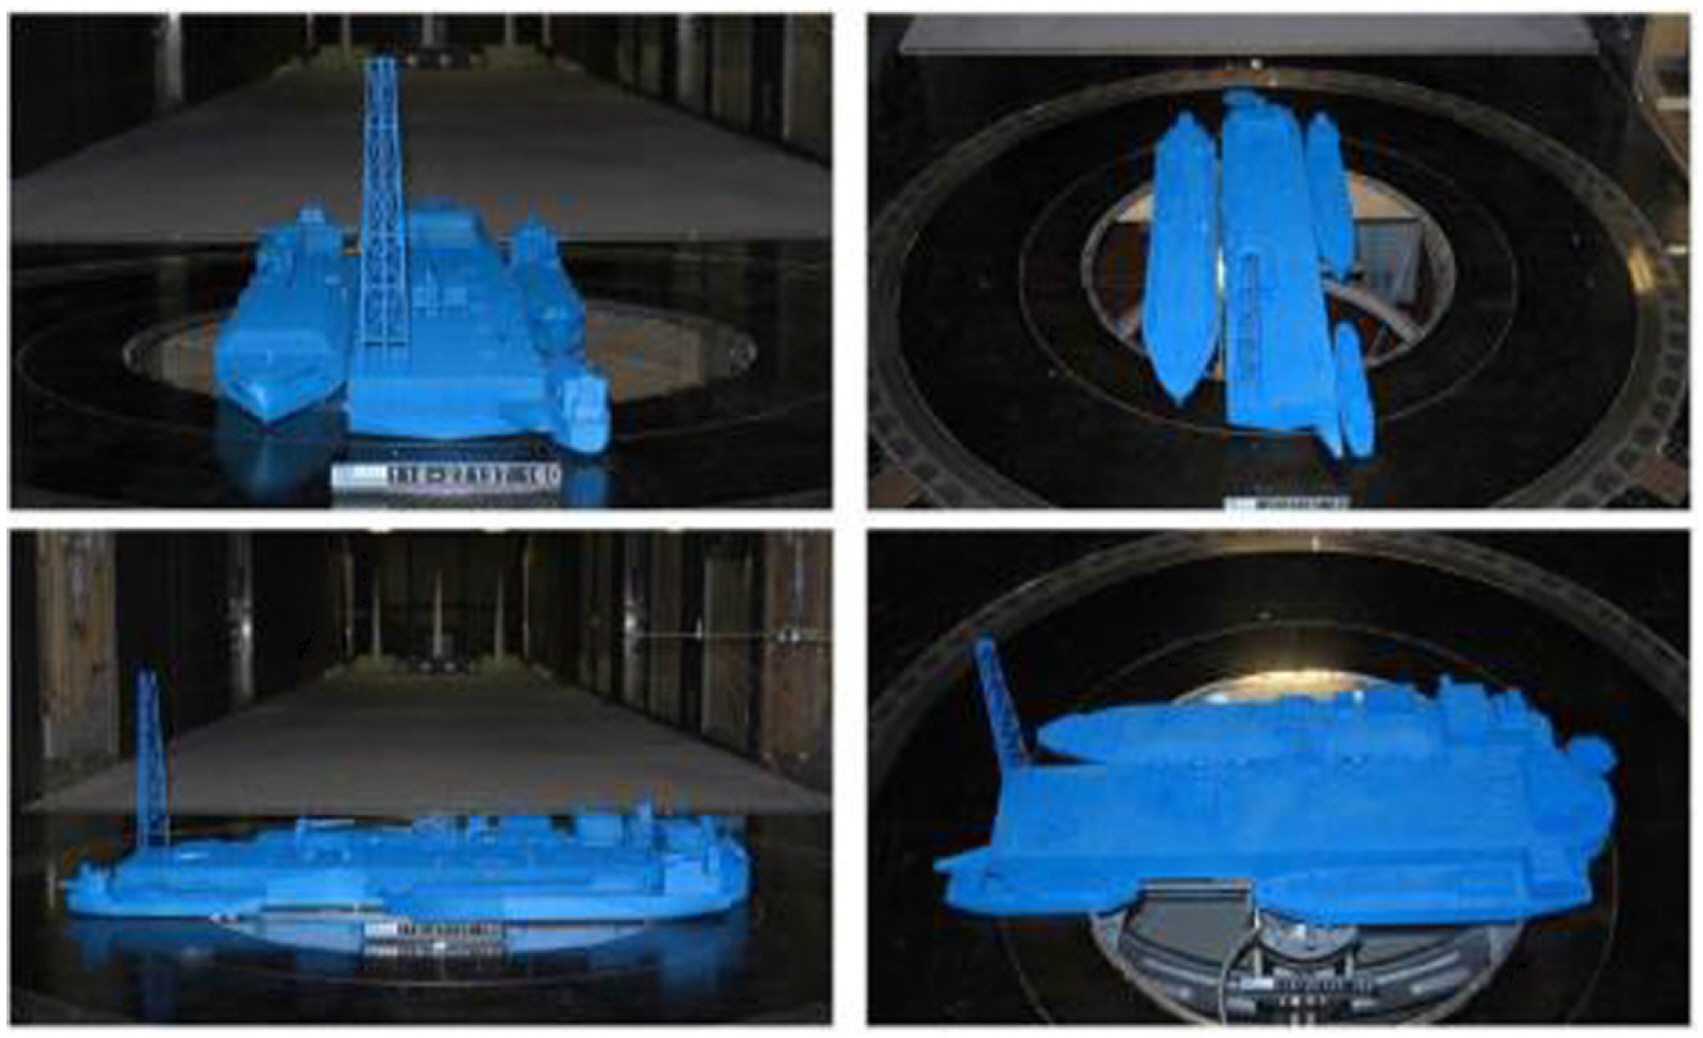
Wind load test for 4-body operation (Park et al., 2017)
The current load was calculated based on the study conducted by Jung et al. (2017), in which computational fluid dynamics calculations were performed and the current load coefficient was calculated. Based on the computational analysis, which was systematically performed by Jung et al. (2017), the current load coefficient was measured in the wind tunnel test, and it was confirmed that the coefficient was affected by the experimental environment of the wind tunnel. Furthermore, the analysis indicated that Boundary conditions for unbounded flow were not satisfied. Based on the study by Jung et al. (2017), the docked current loads of four floating bodies were calculated in this study as shown in Fig. 8.
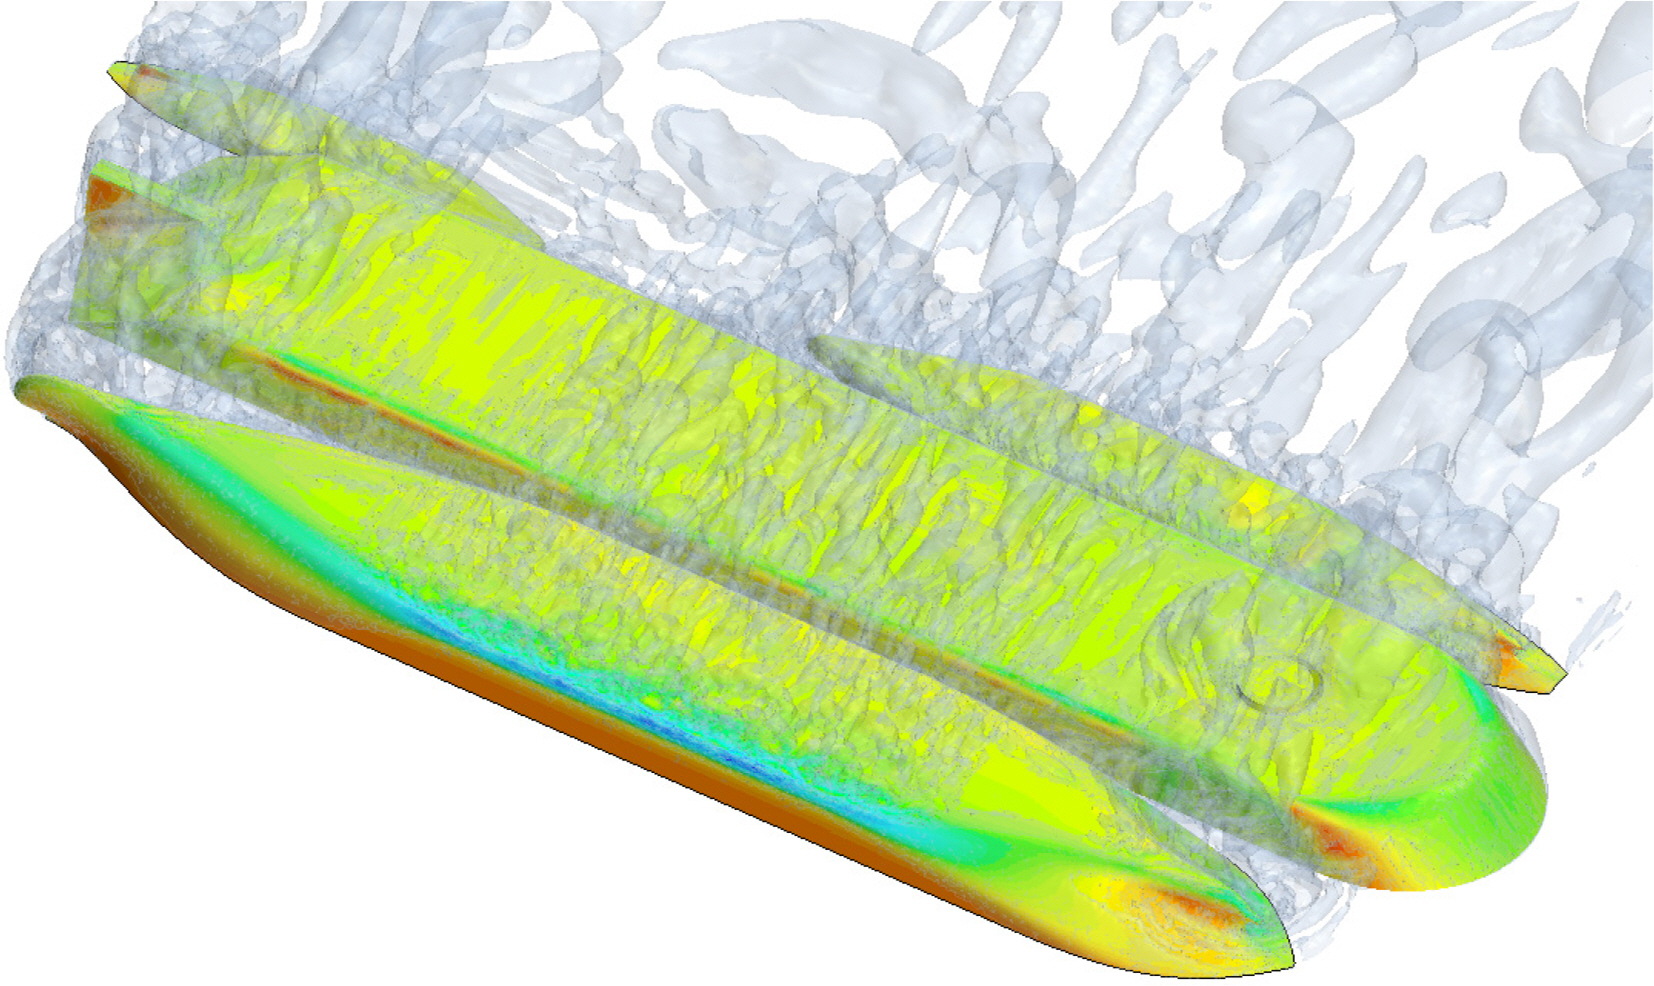
Current load calculation for 4-body operation
The wave drift load was calculated based on a study by Kim et al. (2018). To calculate the wave drift load, a high-order boundary element method based on the free-surface green function (Choi and Hong 2002) was used, and a gap flow damping term was applied to reduce the non-physical resonance of the gap of the floating body. Detailed calculations can be found in the study by Kim et al. (2018).
For the calculated environmental load, the load acting on each floating body was also simplified to a single FLBT hull load. The individual loads of the floating bodies were replaced with a single load using Eqs. (6)–(8).
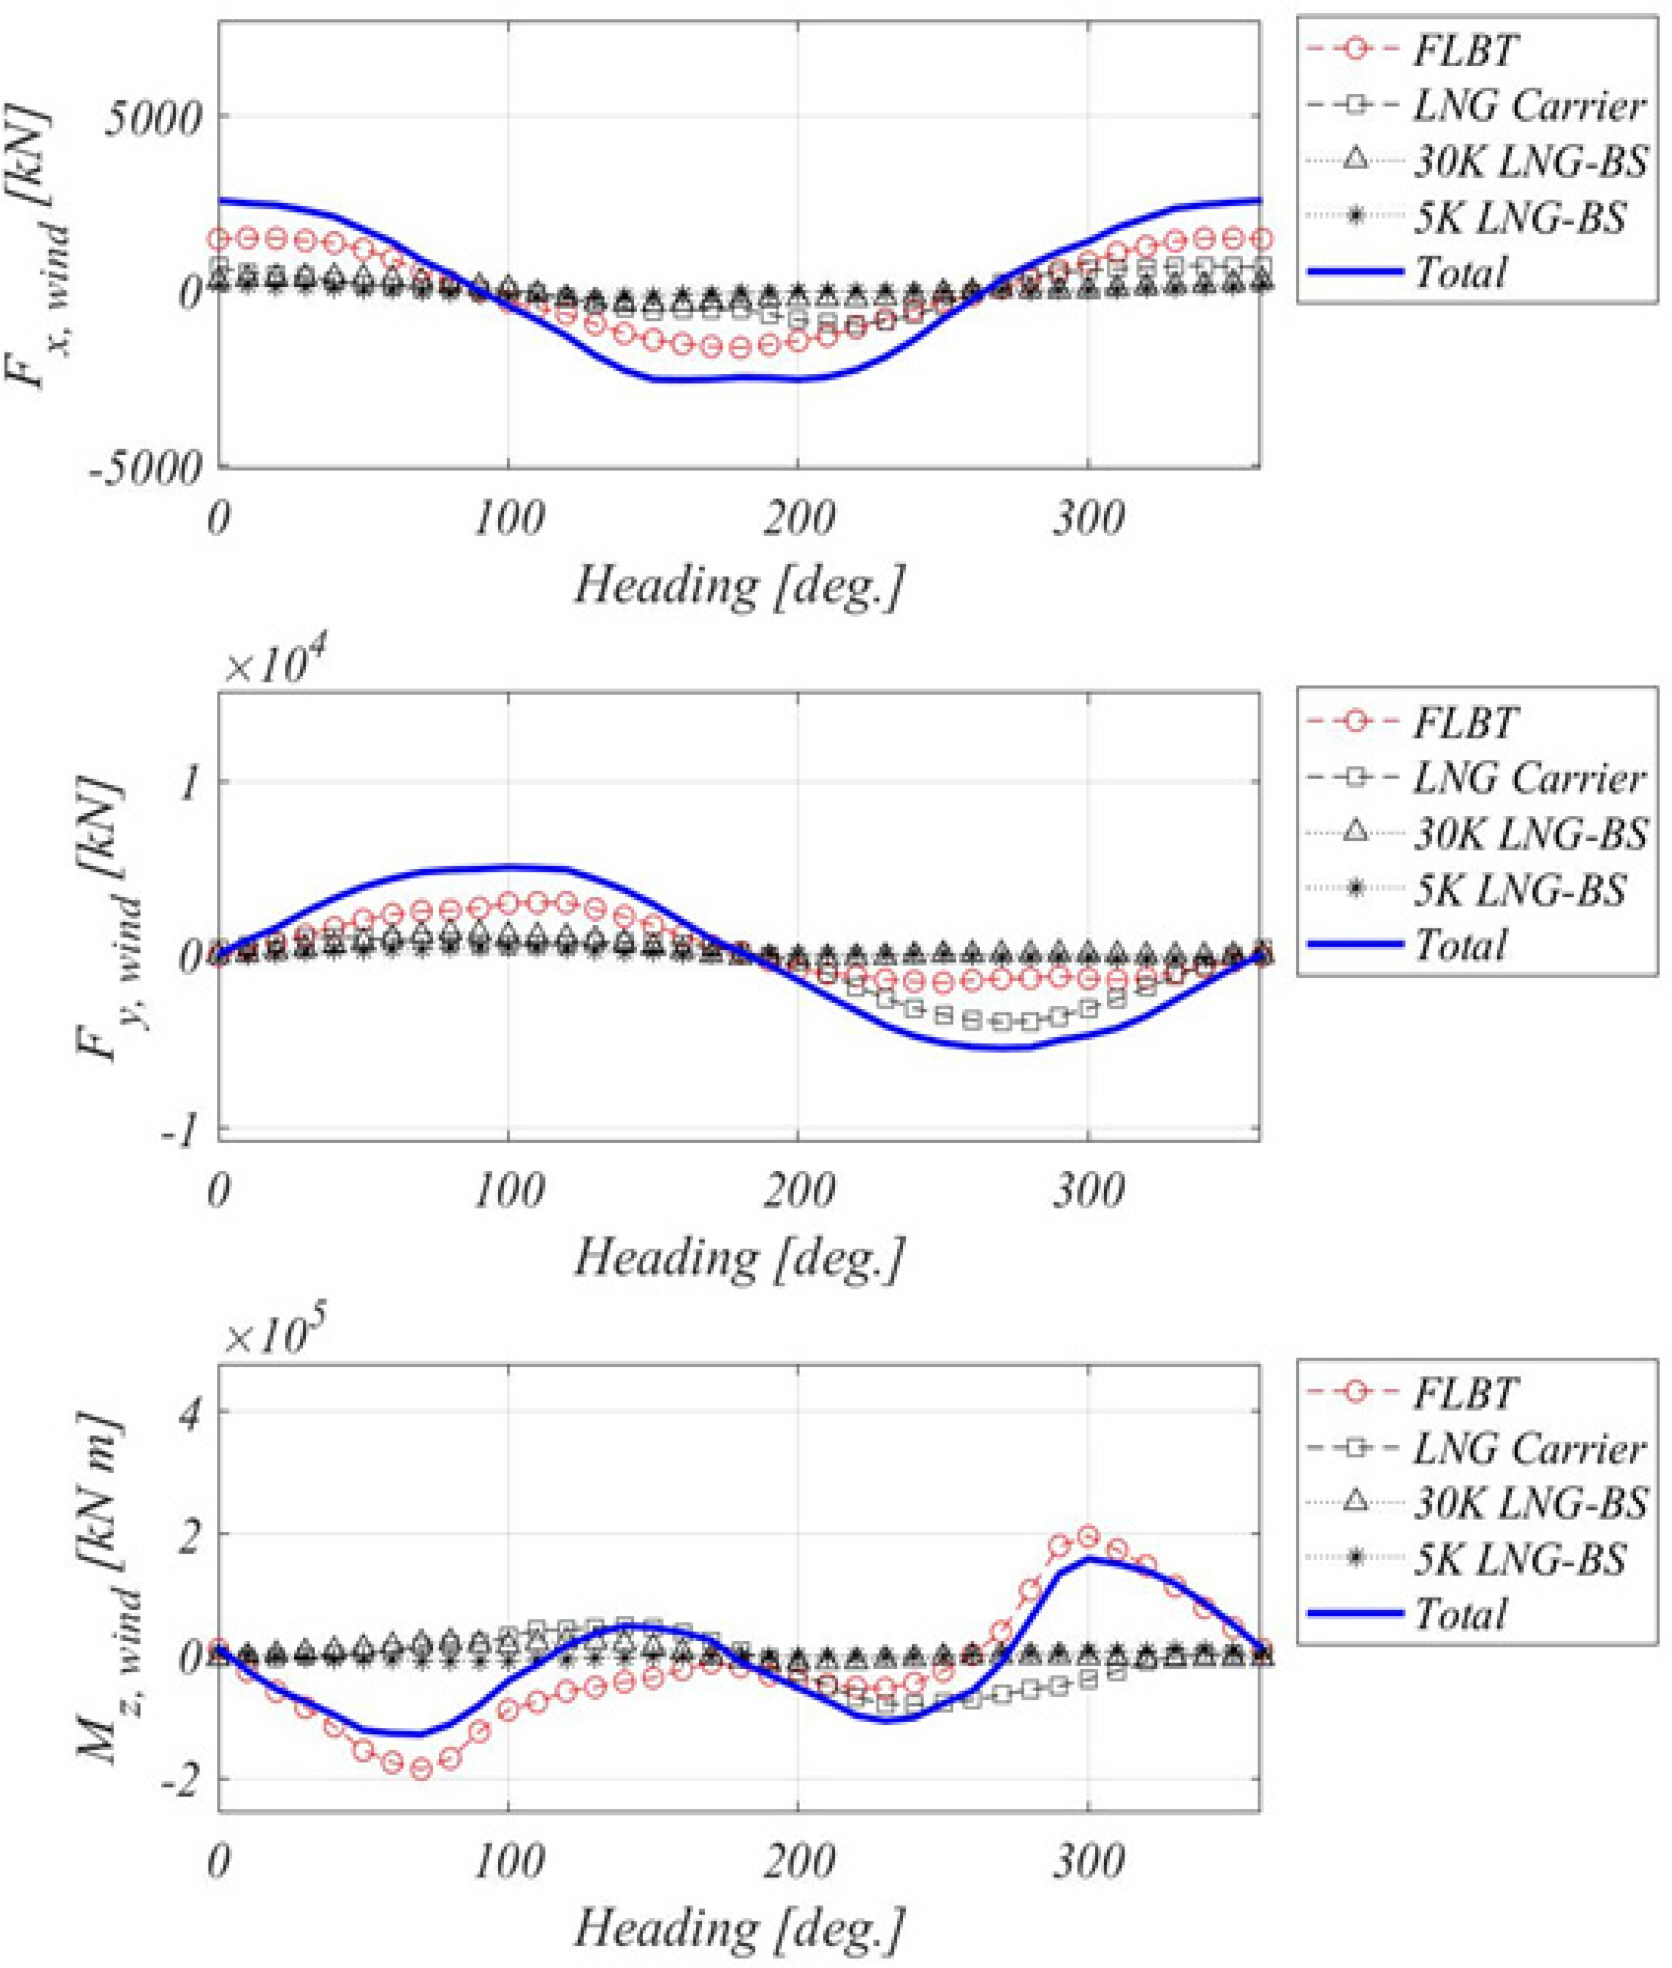
Wind loads in-unit velocity (Vwind = 1 m/s)
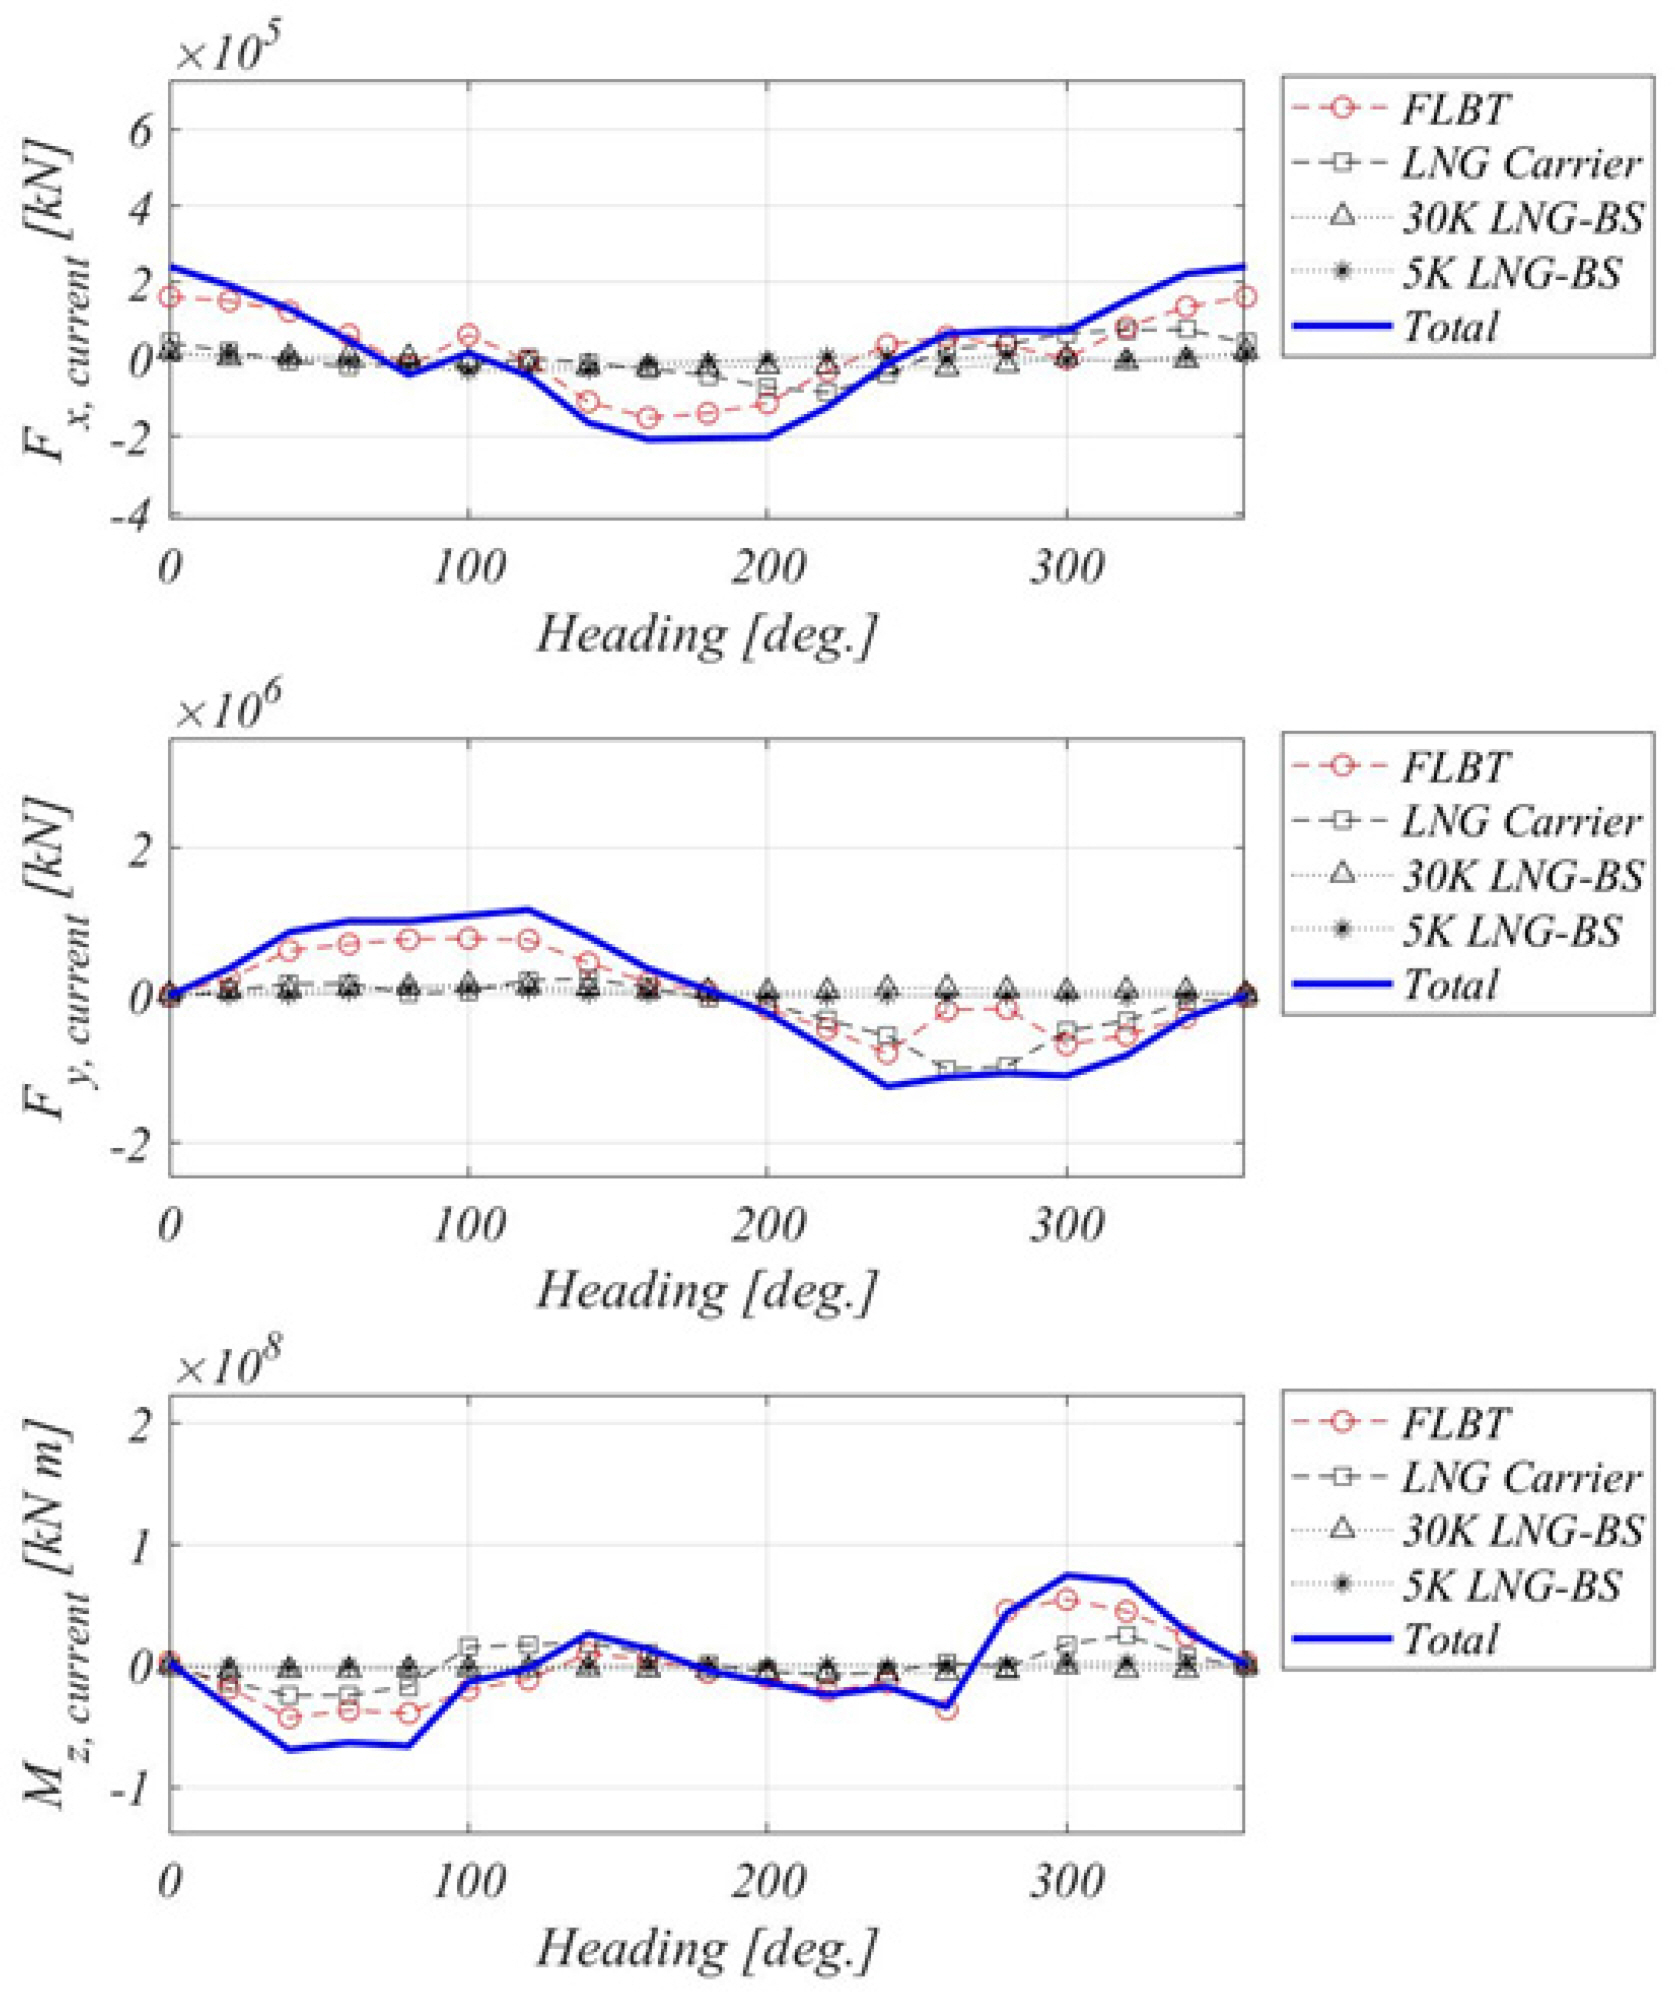
Current loads in-unit velocity (Vcurrent = 1 m/s)
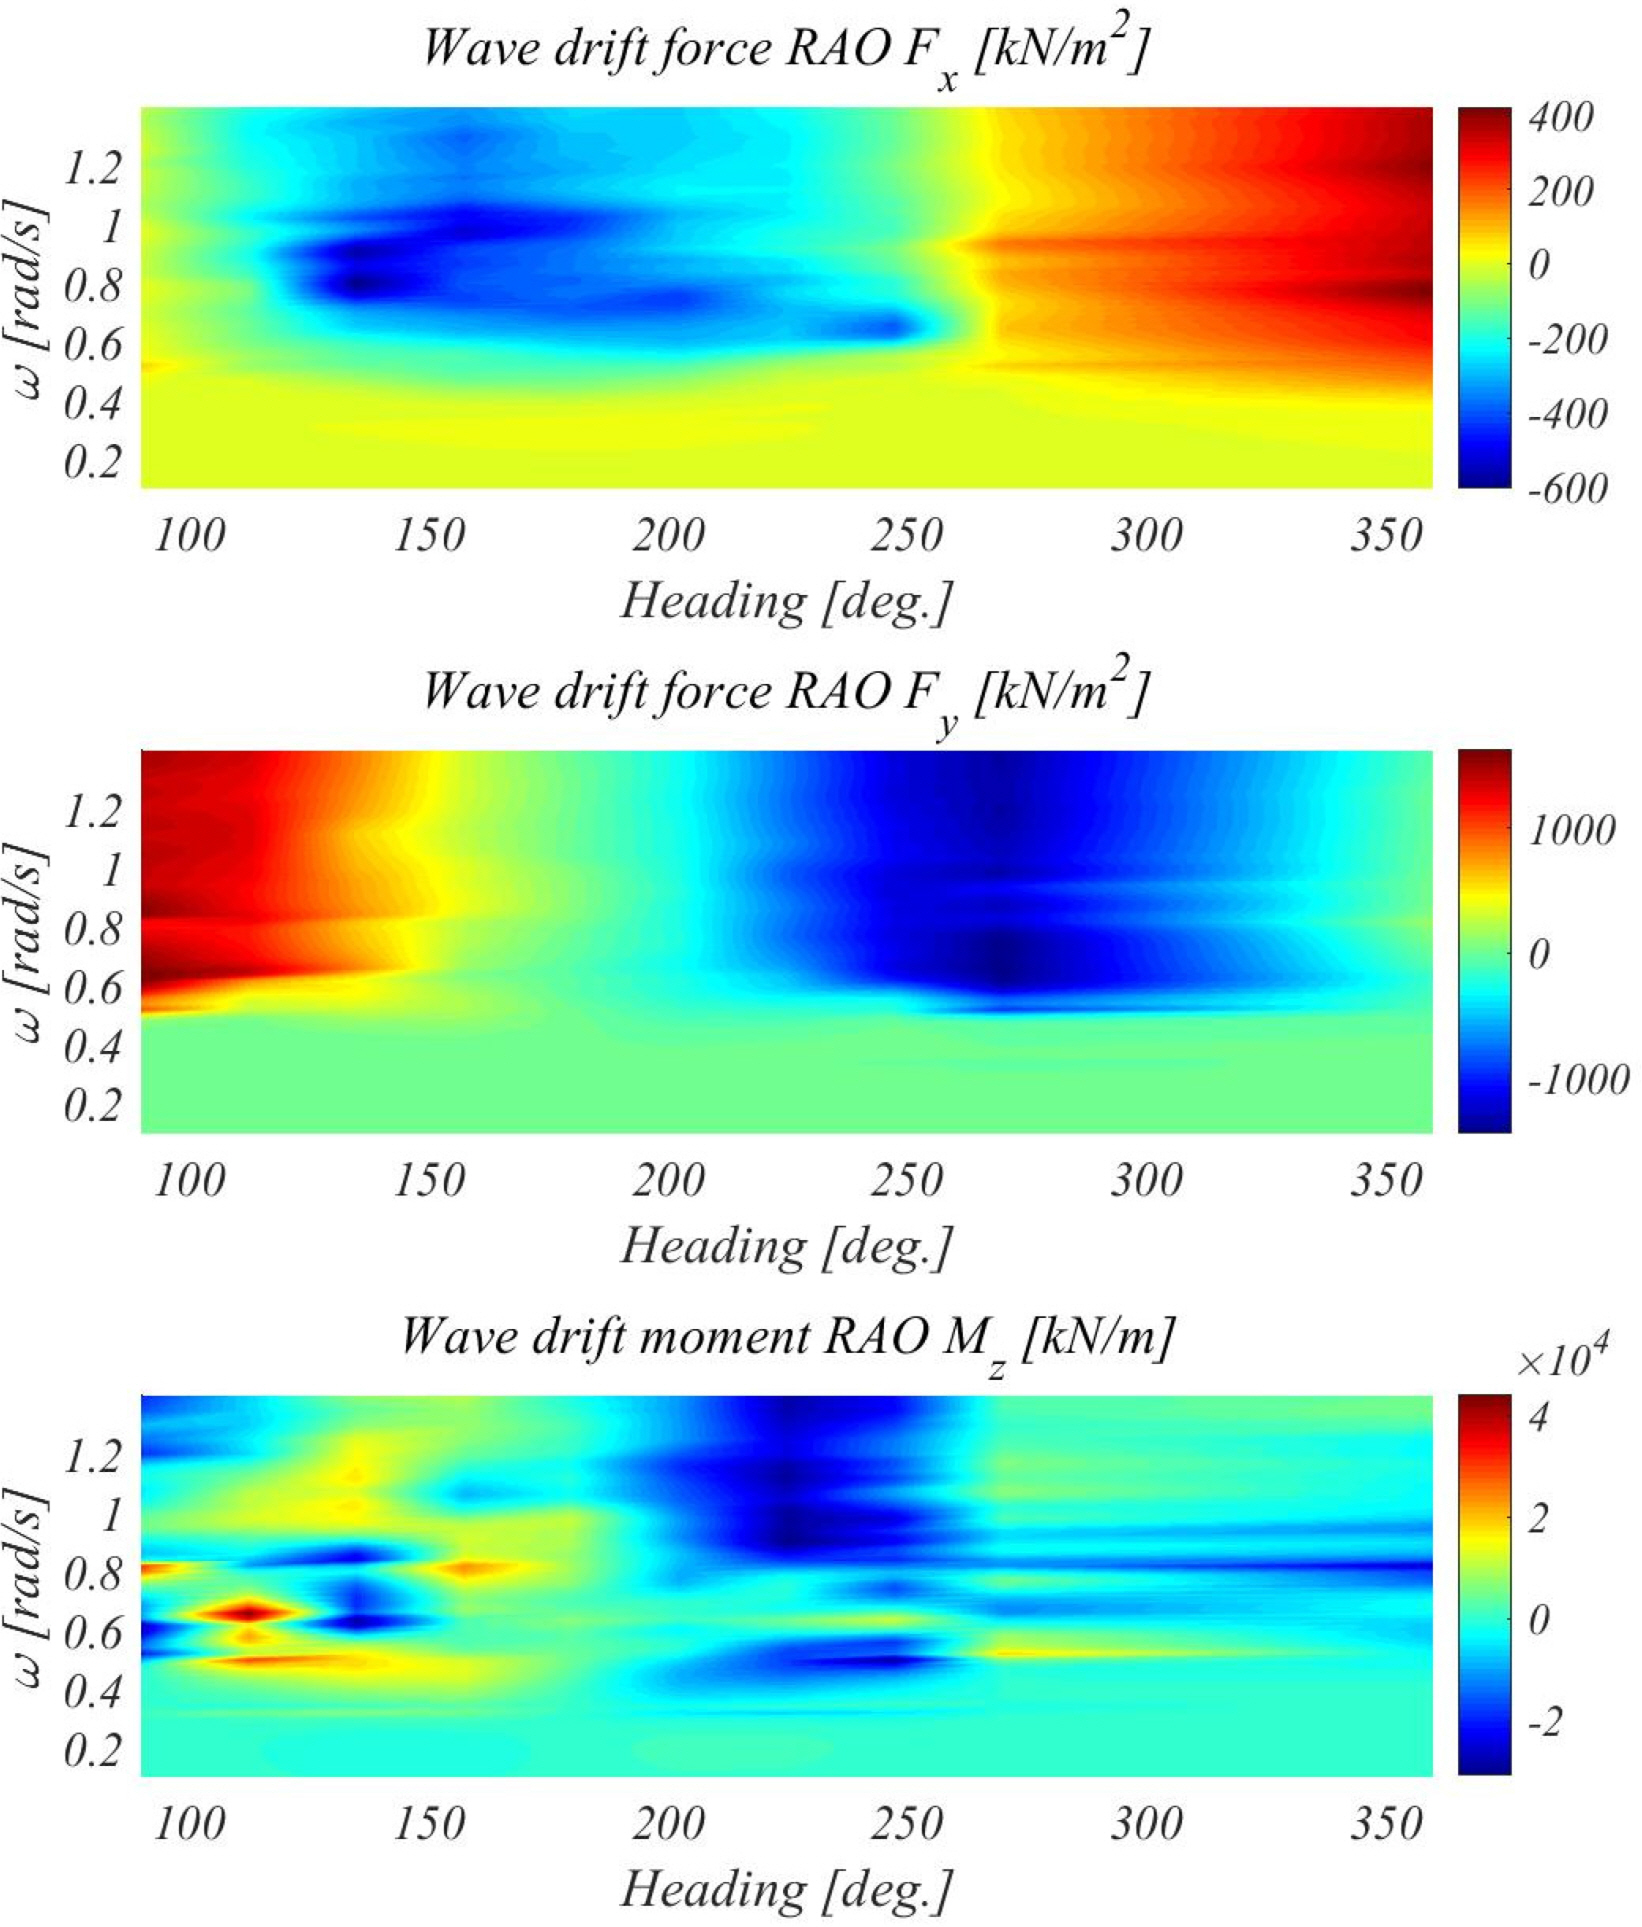
Wave drift loads RAO
Based on the inertia, added mass, and environmental loads substituted by the load of a single floating body, two-dimensional planar low-frequency motion equations, i.e., Eqs. (9)–(11), which consist of turret mooring and tunnel thruster, can be derived, which allow to simulate the heading angle control.
In the derived motion equation, M and Iii represent the mass and moment of mass inertia of the floating body, respectively.aij, ẍi and ẋi represent the added mass, acceleration, and velocity in each direction of motion, respectively, where the values of 1, 2, and 6 for i and j represent the surging, swaying, and yawing directions, respectively. Moreover,
The heading angle of the FLBT is controlled by using the stern thruster, and accordingly, it is necessary to produce and distribute the thruster outputs. In this study, a PD controller was used to control the output of the thruster, and a Lagrange multiplier was used as the thrust allocation algorithm.
3. FLBT Heading Angle Simulation with Multiple Moored Vessels
Numerical analysis was performed to understand the heading angle characteristics and control performance of the FLBT with multiple moored vessels. In the numerical analysis, a simplified model, in which the relative motion between floating bodies was omitted, was used, as mentioned in Section 2. This is reasonable considering the operating conditions and the objective of the study. To validate the simplified model, the result was compared with the dynamic positioning (DP) model test, which was performed at the ocean engineering basin (Kim et al., 2019). Through the comparatively validated model, the heading angle control for the operating conditions was simulated to study the heading angle characteristics and control performance.
3.1 Simplified Model Verification through Model Test
The model test was conducted at the ocean engineering basin in KRISO. The specifications of the floating body used in the model test are shown in Table 2, and the accumulation ratio was 1:65. The models of the 170K LNG carrier, 30K LNG-BS, and 5K LNG-BS in addition to the FLBT were constructed and arranged according to the loading and off-loading scenarios as described previously and shown in Fig. 12.

Model test set-up for 4-body operation
The FLBT was moored through the turret mooring system inside the structure and was designed to rotate freely in the hull heading. Pneumatic fenders and parallel mooring lines were modeled for the mooring between floating bodies in the same manner as in the study conducted by Jung et al. (2018). The environmental conditions of the model test are shown in Table 5 and Fig. 13, with a total of five cases including the cases where the heading angle was not controlled and where the heading angle was maintained and controlled at 10°, −10°, −20°, and −30°. The model test results were used for verification.
Environmental condition of model test
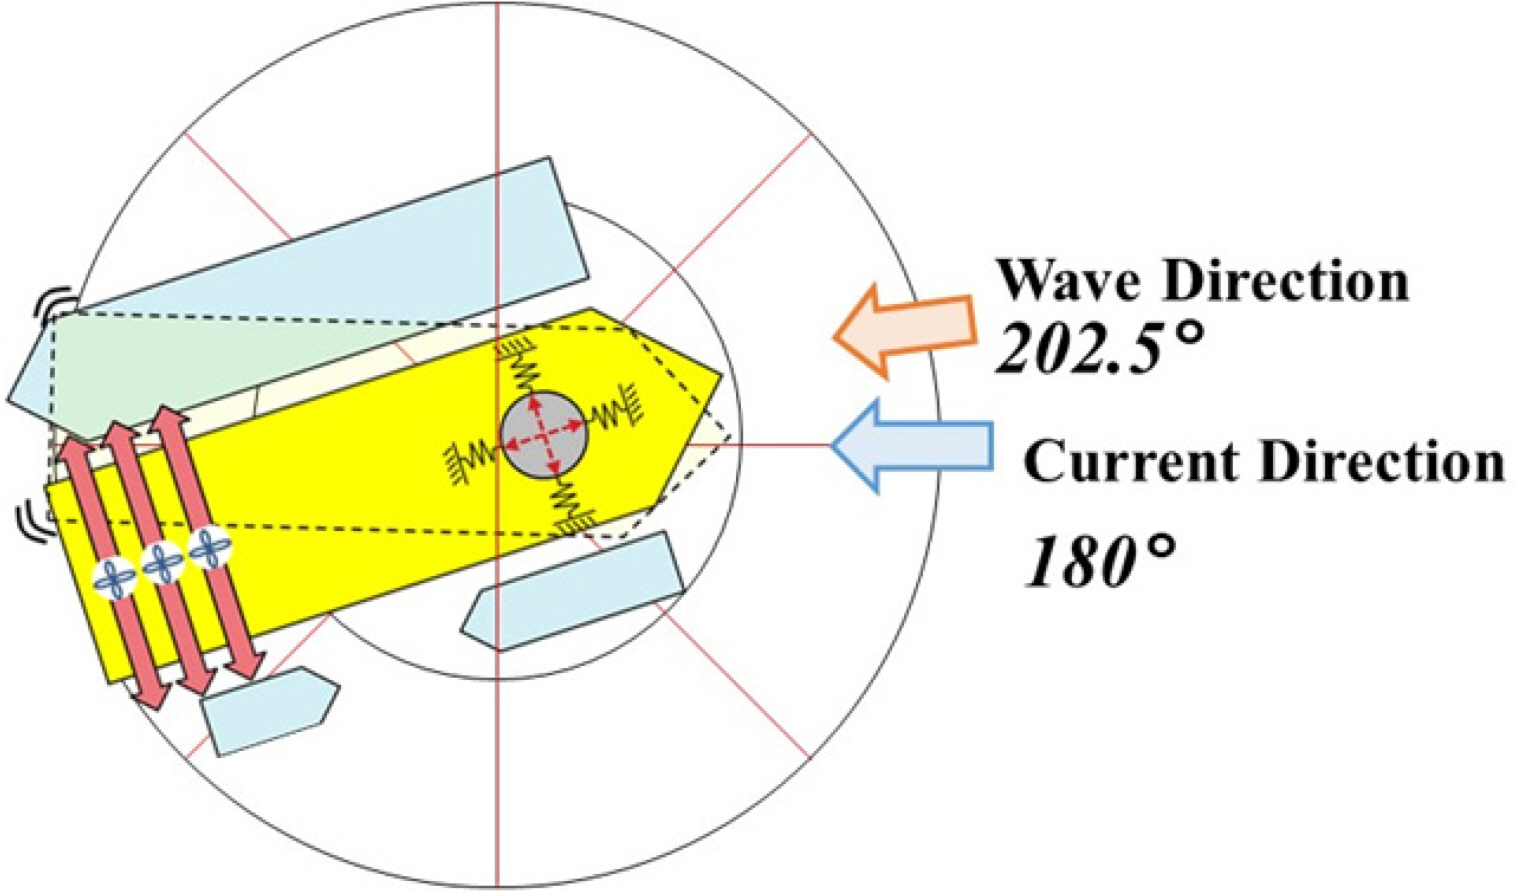
Directions of environmental loads
The simulation was performed for the case where there was no heading angle control and the result was compared with the model test result, as shown in Fig. 14. As a result of the numerical analysis, the heading angle reached a static equilibrium point at an average of 6.6°, which shows a similar result to the average heading angle of 5.8° in the model test. Through the model tests and numerical analysis, it was confirmed that there is no slewing motion phenomenon.
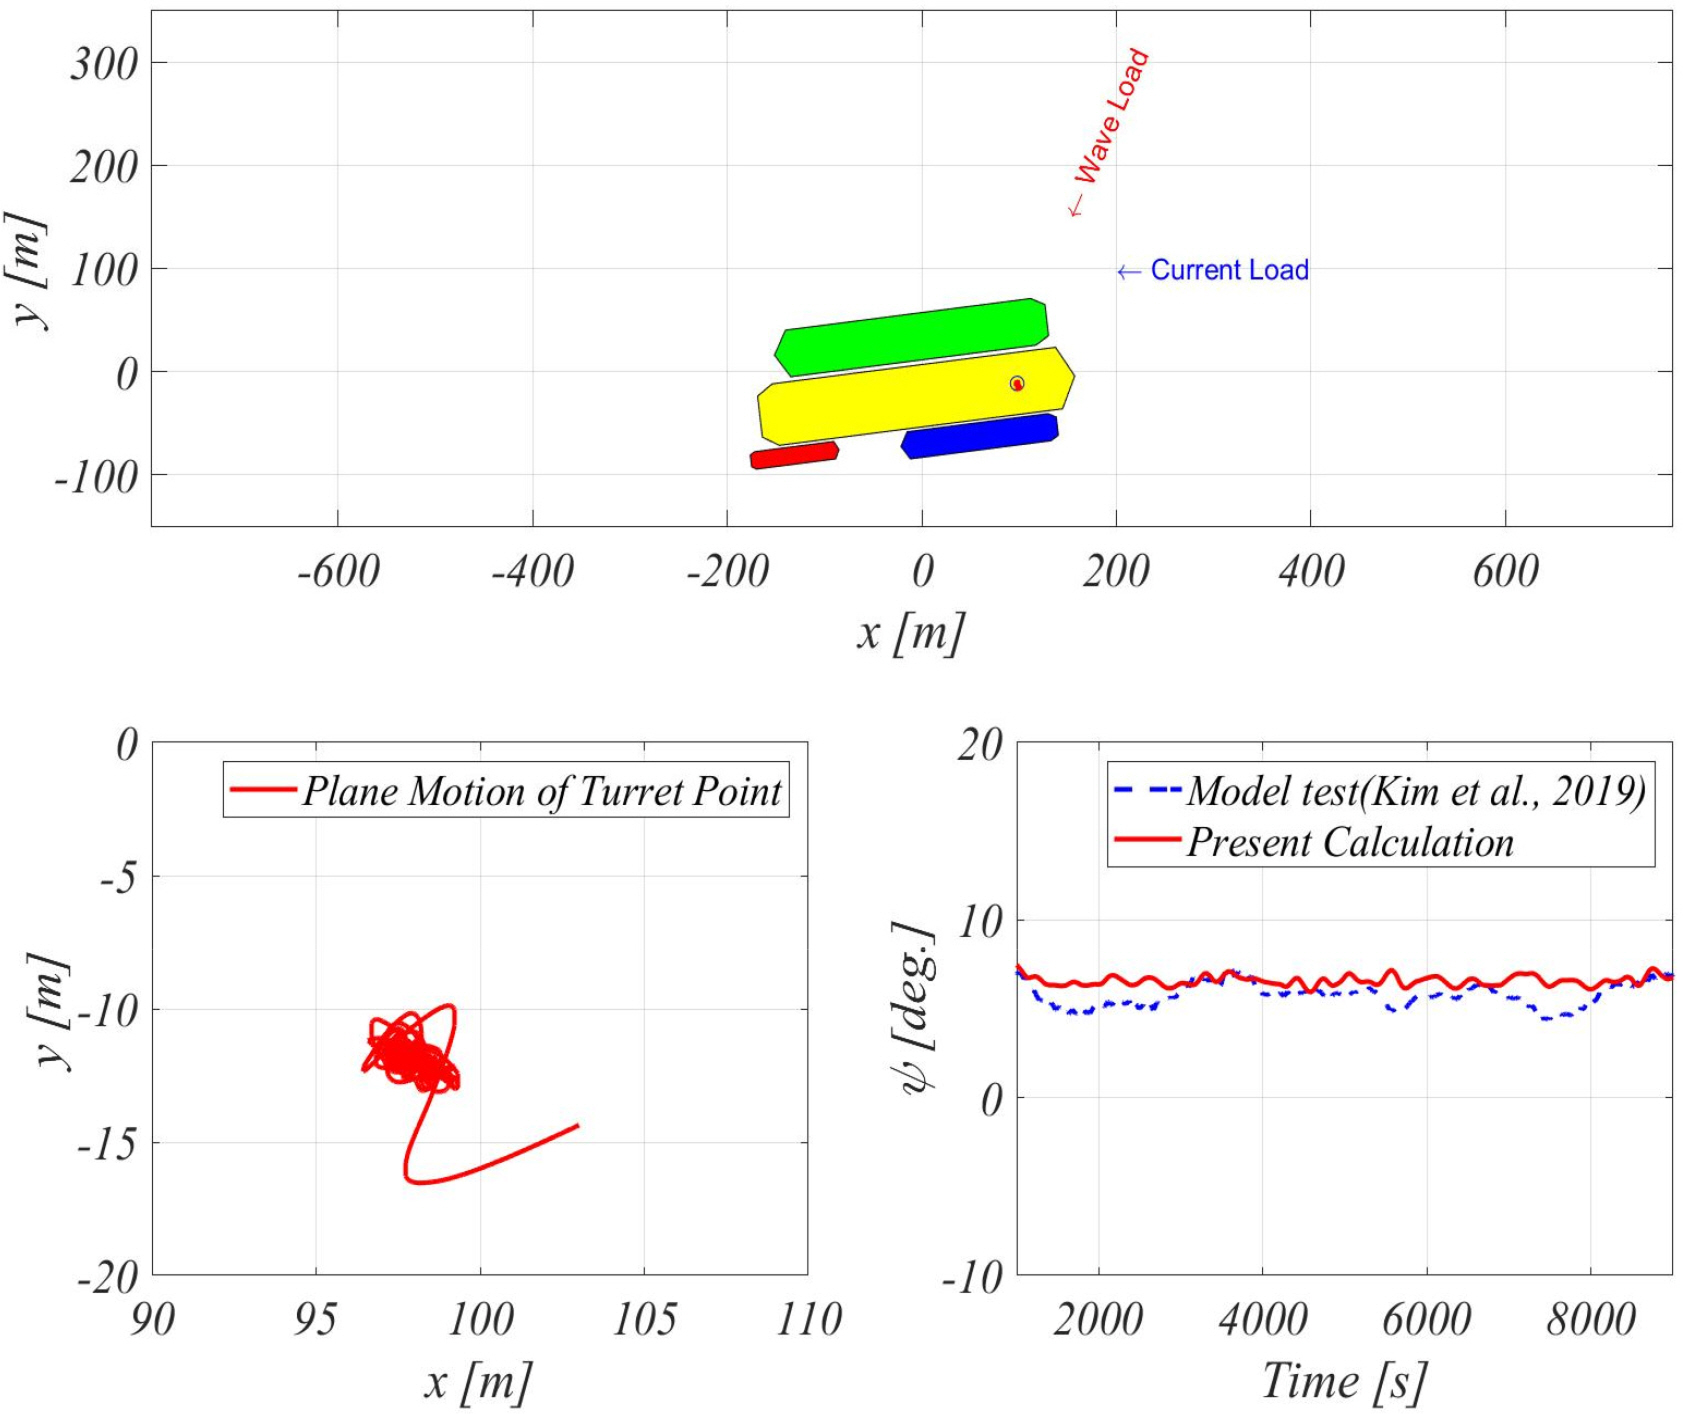
Simulation of FLBT without DP Control
The simulation was performed for the case where the heading angle was controlled and the result was compared with the model test result, as shown in Fig. 15.

Time histories of simulation results (FLBT with DP Control)
It can be confirmed from the time series results that the heading angle of the numerical analysis was controlled by the reference heading angle, as in the model test. The required thrust time series, which was calculated from the numerical analysis, also has a sectional difference from the result in the model test, but the similarity was observed in the time series results. The average heading angle and the average required thrust calculated using the numerical analysis were compared with the results of the model test and the comparisons are shown in Fig. 16. As shown in Fig. 15, it can be confirmed that the heading angle matches the reference heading angle and the angle is well controlled. It can be verified that the average required thrust also shows a similar trend to the model test result. Through comparative studies, it was determined that the heading angle characteristics and the required thrust calculated through the numerical analysis using a simplified model were similar to the results of the model test. Therefore, the effectiveness of the simplified model was verified.
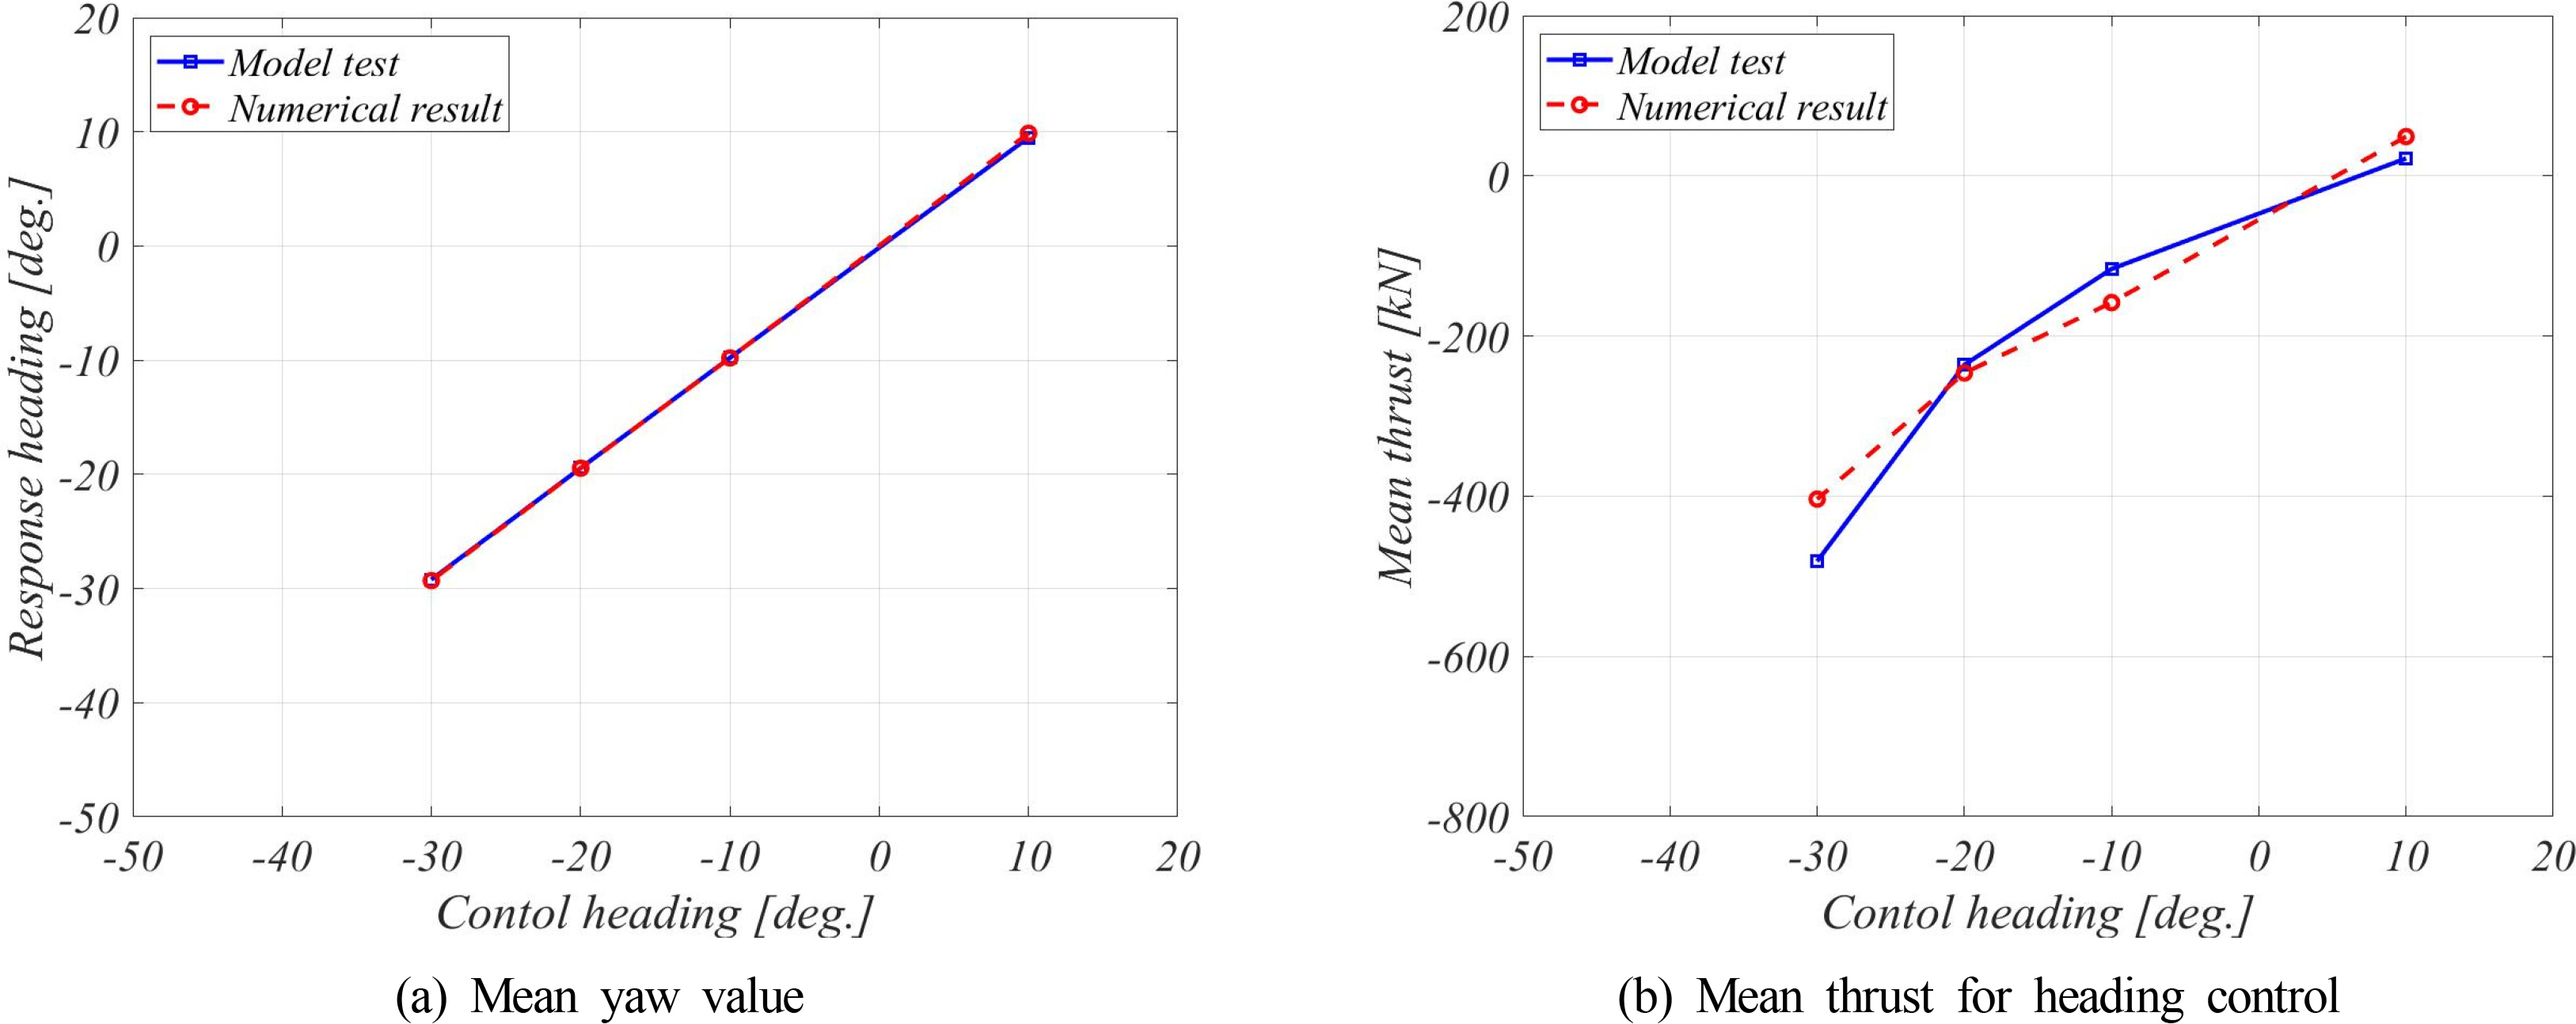
Mean values of simulation results (FLBT with DP Control)
3.2 Heading Angle Characteristics of FLBT with Moored Loading and Off-loading Vessels
A simulation was performed for the case with no heading angle control to understand the heading angle characteristics of the FLBT with moored loading and off-loading vessels. As the heading angle characteristics are governed by the environmental load acting on the marine structure, the static environmental load for the environmental conditions shown in Table 1 was calculated for the incident direction and the result is shown in Fig. 17. As shown in Fig. 17, the main components of the environmental load in the y-direction and the moment of the horizontal plane are attributed to the current, and it can be easily predicted that the direction of the current will have the most significant effect on the change in the heading angle.
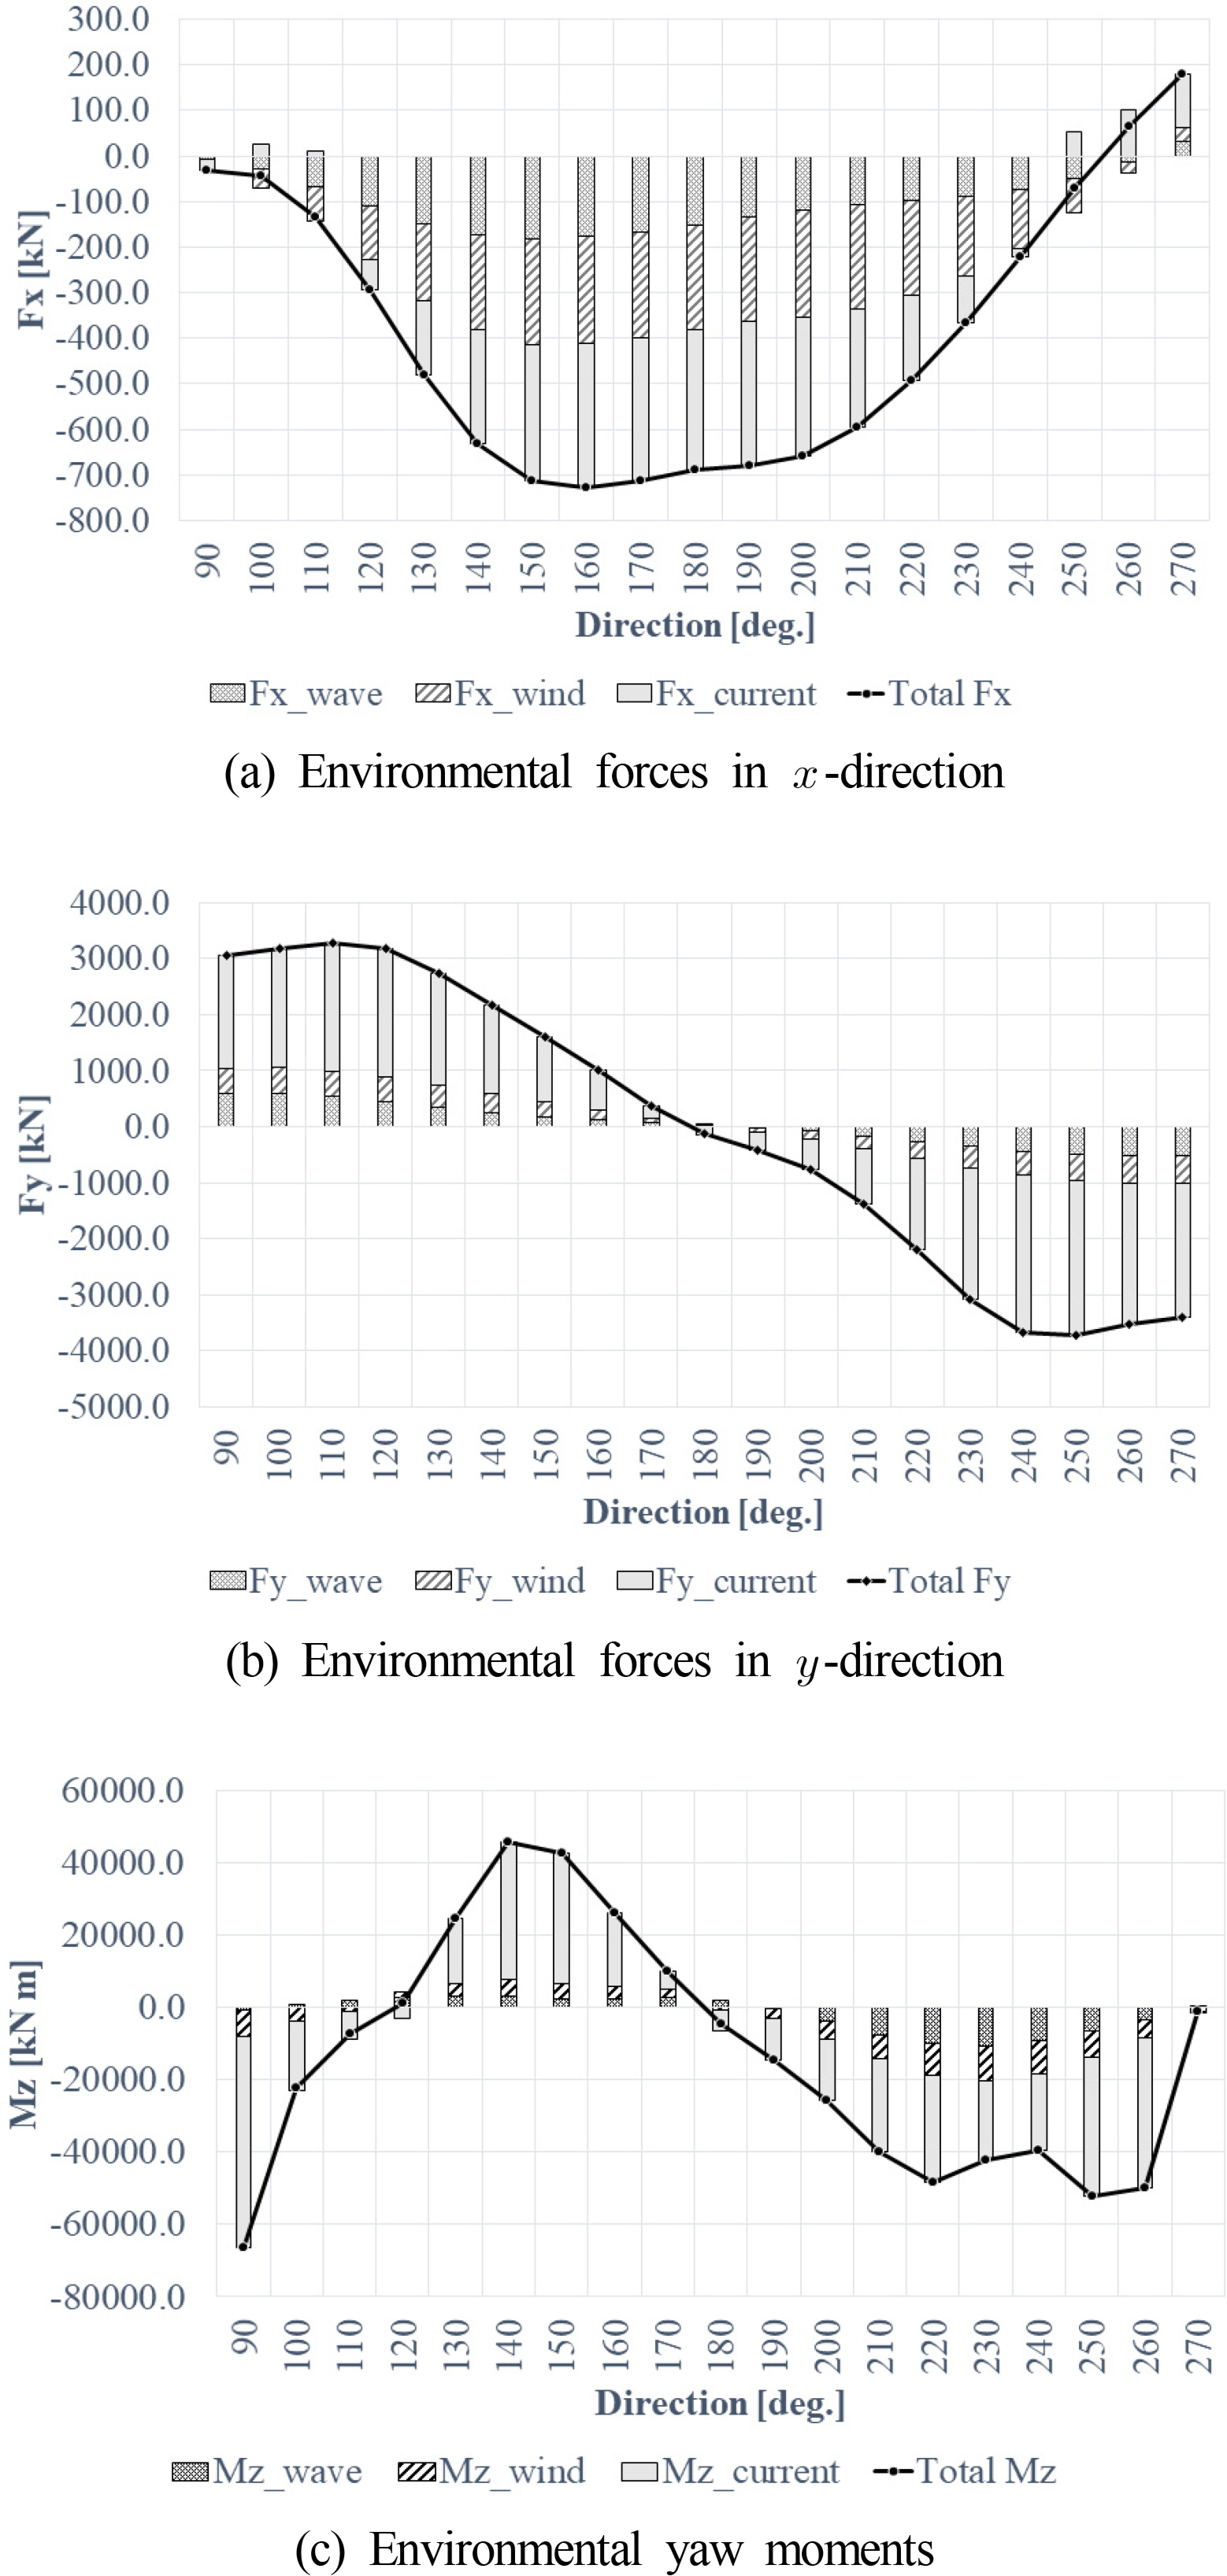
Static environmental loads
Fig. 18 shows the heading angle simulation for each environmental load and all the linear disturbance loads (collinear environmental load; hereafter denoted as the unidirectional composite environmental load). In Fig. 18(a), when only the wind and wave drift loads are included in the simulation, a long period slewing motion is observed. This is mainly due to the yawing instability that occurs in the vessel, and it is known that the yawing stability is improved when the surging resistance increases (Nam et al., 2013). Such characteristics can be confirmed by simply conducting a simulation with increased wind speed as shown in Fig. 18(b). When only the current load is included in the analysis, the heading angle is maintained to a static value. In Fig. 19 (a), it can be confirmed that the heading angle for the unidirectional composite environmental load in the simulation is almost similar to the heading angle when only the current load acts. As shown in Fig. 17, the current load has the greatest effect on the composite environmental load. In the case of the unidirectional composite environmental load, the slewing motion, which occurred in the wind and wave drift loads, did not occur, and this indicates that the current suppresses the slewing motion. Through the results of the heading angle simulation for various loads, when there is no DP control, the slewing motion occurs with an average heading angle of approximately 5° as shown in Fig. 19(b). This is because the 5K LNG-BS and 30K LNG-BS, which are vulnerable to relative motion due to the wave load, are exposed to the wave load, and thus, it is not possible to have the shielding effect against the ocean waves of the FLBT and LNG carriers. Such a heading angle characteristic indicates that the heading angle control of the FLBT is essential to improve the loading and off-loading performances.

Simulations without DP control
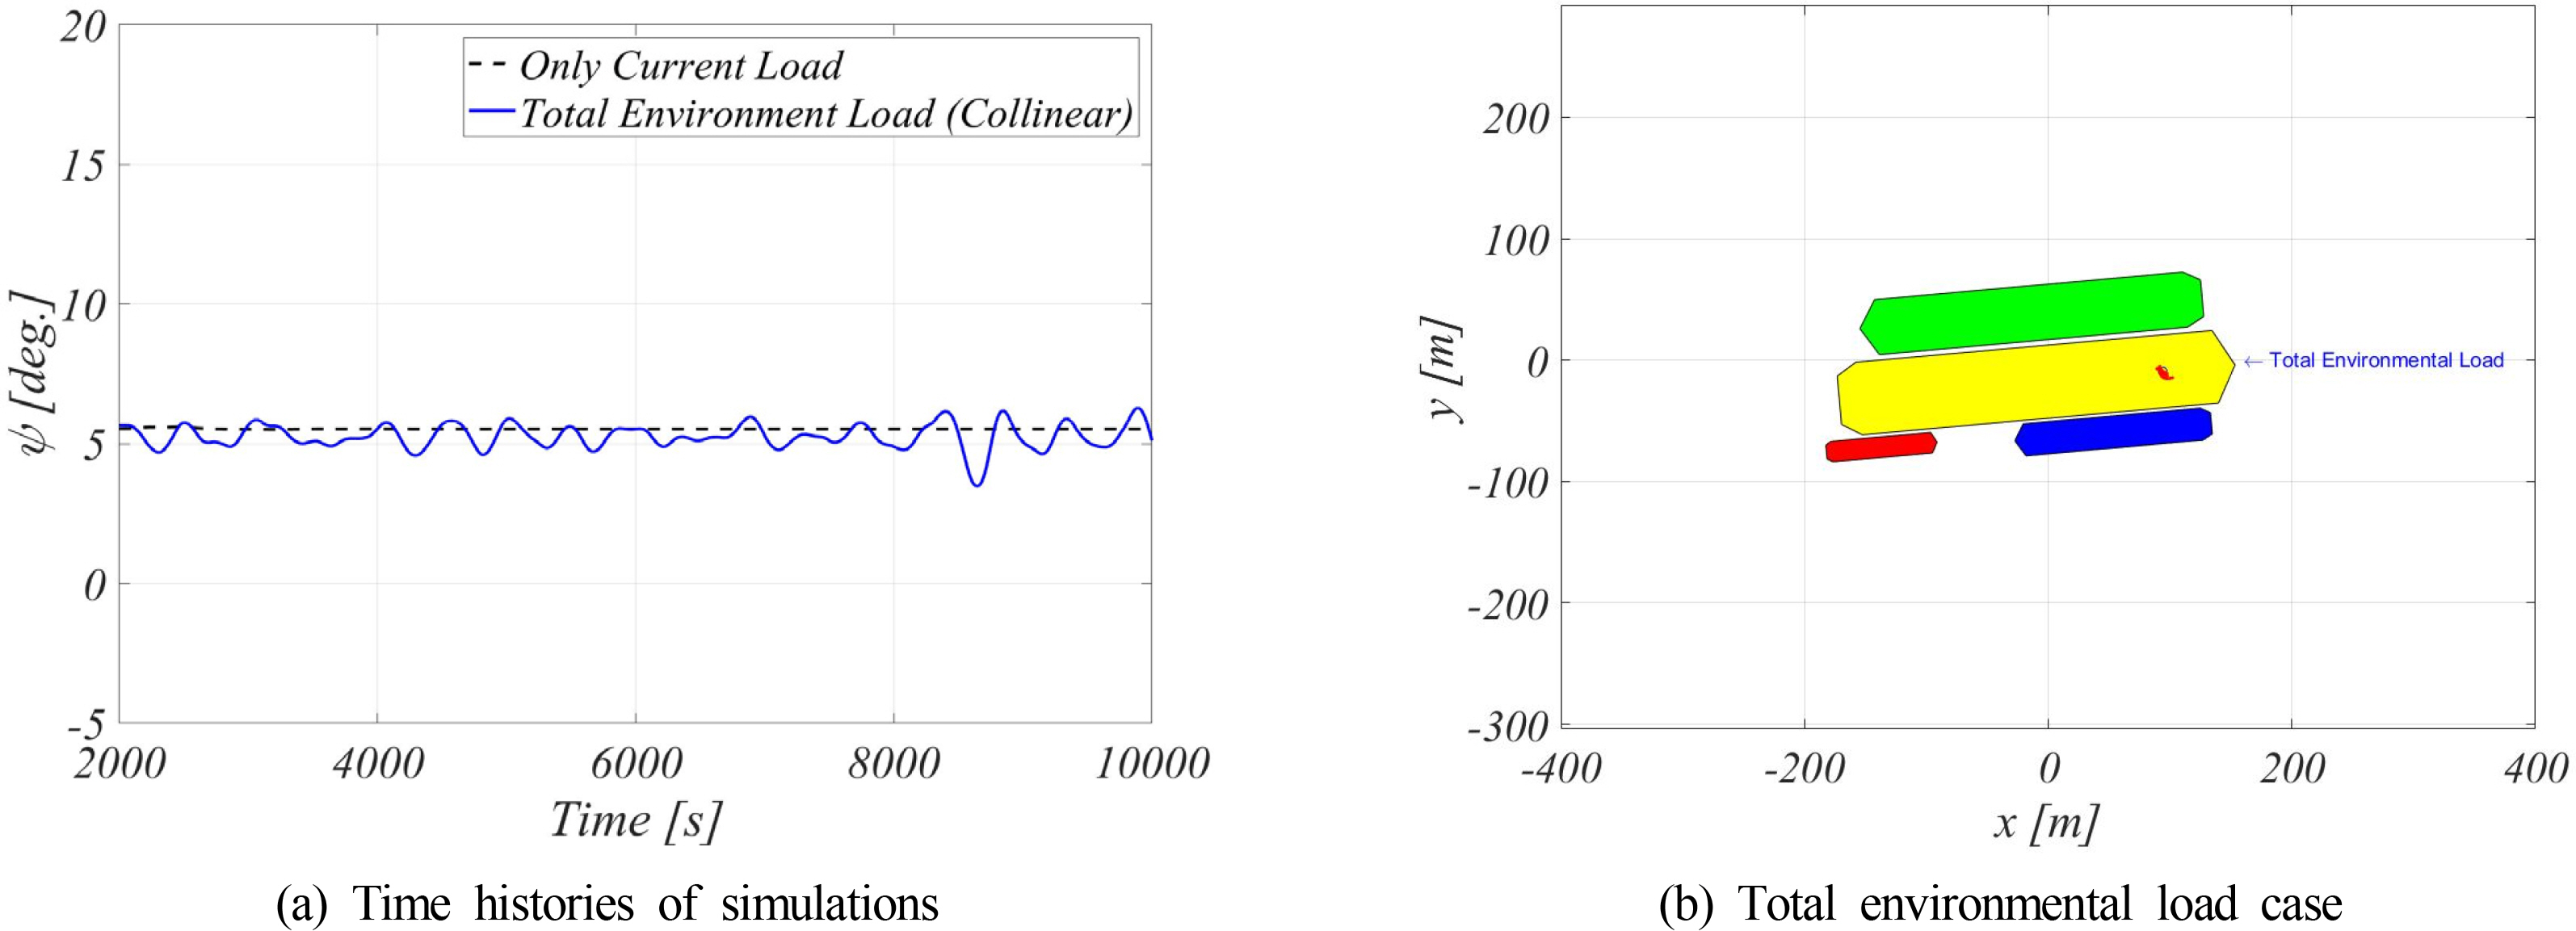
Simulations in combined environmental conditions without DP control
3.3 Control Performance of Heading Angle of FLBT with Moored Loading and Off-loading Vessels
The heading angle control was simulated to understand the heading angle control performance of the FLBT on which the loading and off-loading vessels are moored, as shown in Table 6, for the fixed collinear environmental load condition, fixed wave direction, and changing wind and current loads (hereafter denoted as pseudo-operating conditions). For the heading angle control, the PD control using three stern thrusters was performed. The P gain was calculated based on the yawing and it was set to approximately 300 s, which is the natural period. The D gain was set to 35% of the critical damping.
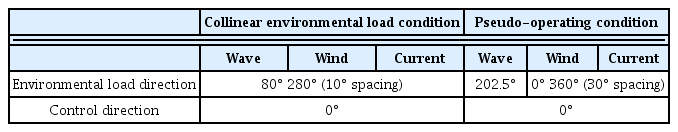
Simulation cases for check of controllability
As shown in Fig. 20(a), the heading angle control was simulated for the collinear environmental load condition. Fig. 20(b) shows the amount of thrust used for environmental disturbances based on the dynamic simulation of the heading angle. It was confirmed that heading angle control is possible for the directions of the environmental load ranging from 90° to 270°.
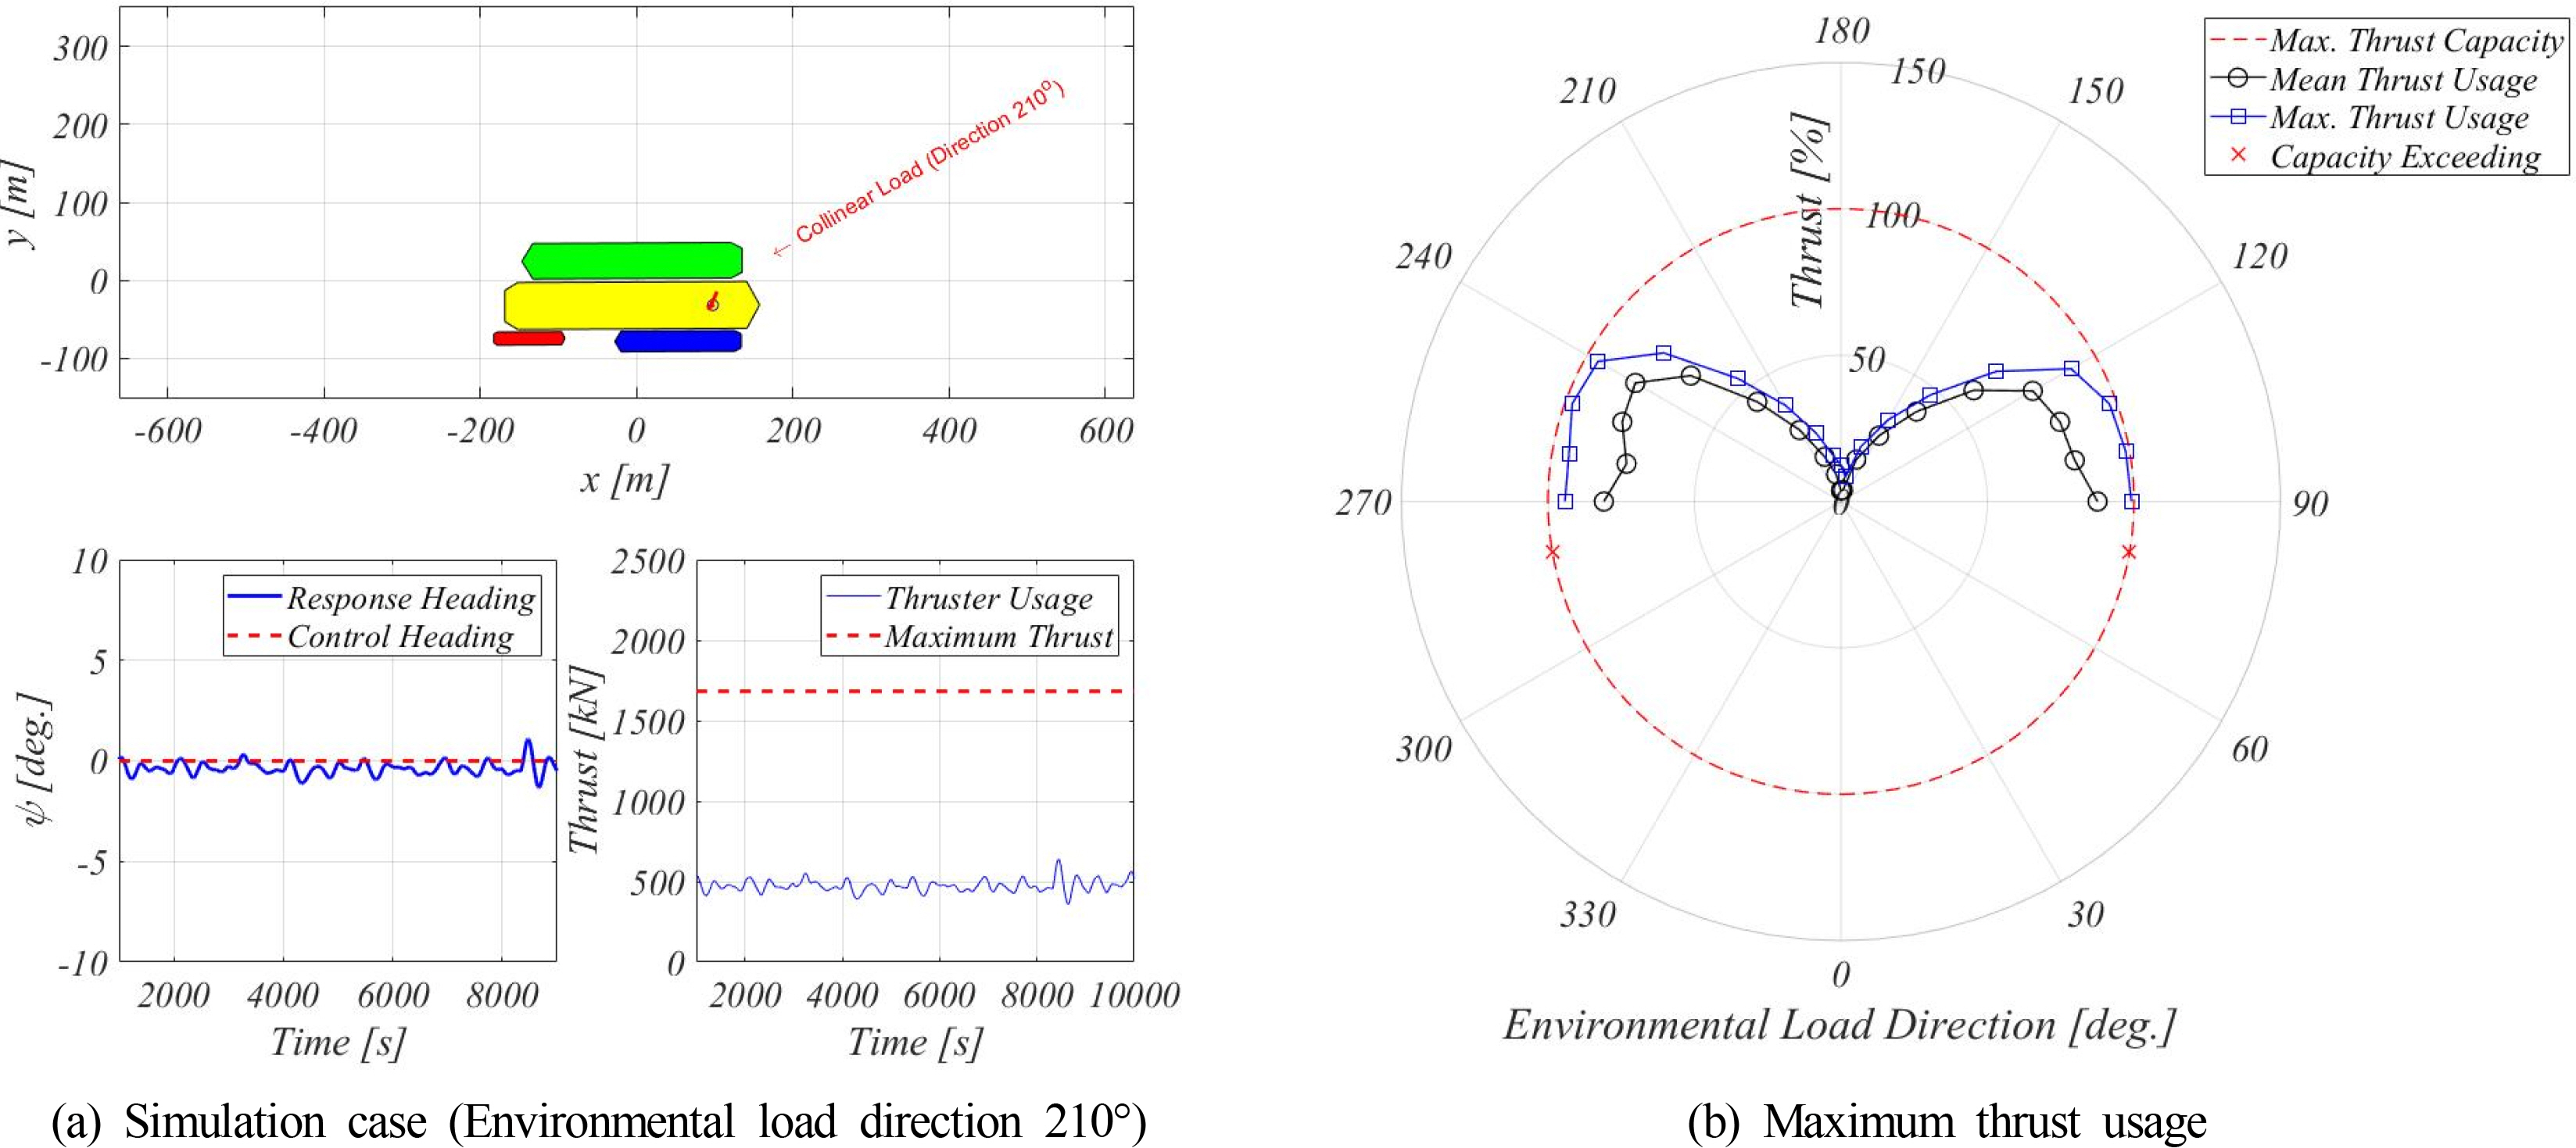
Simulations under combined environmental conditions with DP control (Collinear condition)
According to a previous study (Jung, 2019), if the heading angle is maintained at 202.5° or higher based on the incident direction of the 180° wave, the loading and off-loading performances can be improved by the shielding effect of the ocean wave. The simulation for the collinear environmental load condition shows that it is possible to maintain a heading angle at 202.5° or higher against environmental disturbances.
Furthermore, simulations for the pseudo-operating condition were performed. As shown in the heading angle characteristics, the static heading angle is mainly affected by the direction of the current. However, the loading and off-loading performances are considerably affected by the wave-induced relative motion of the vessel. Through these characteristics, by fixing the wave direction to have the shielding effect against the ocean wave and understanding the heading angle control performance against environmental disturbances except for the wave, the range of environmental conditions that ensure the improvement of the loading and off-loading work performances can be estimated. A simulation was performed at 30° intervals under the pseudo-operating condition as shown in Table 6, and an additional simulation was performed at 10° intervals in the range of 280° to 310° to confirm the maximum thrust around 300°, where the maximum required thrust is expected. The simulation result of the heading angle control is shown in Fig. 21(a), where the results are specified in terms of the thrust usage. The section where the maximum thrust occurred is a scenario in which the current and wind loads act at 300° as shown in Fig. 21(b). Therefore, as shown in Fig. 21(a), the heading angle for having the shielding effect against the ocean waves is maintained for all the current and wind load directions. This indicates that the heading angle control secures an additional work operation period and improves work performance in operating condition with a one-year return period. The capacity of the designed stern thruster was also confirmed through numerical analysis results.
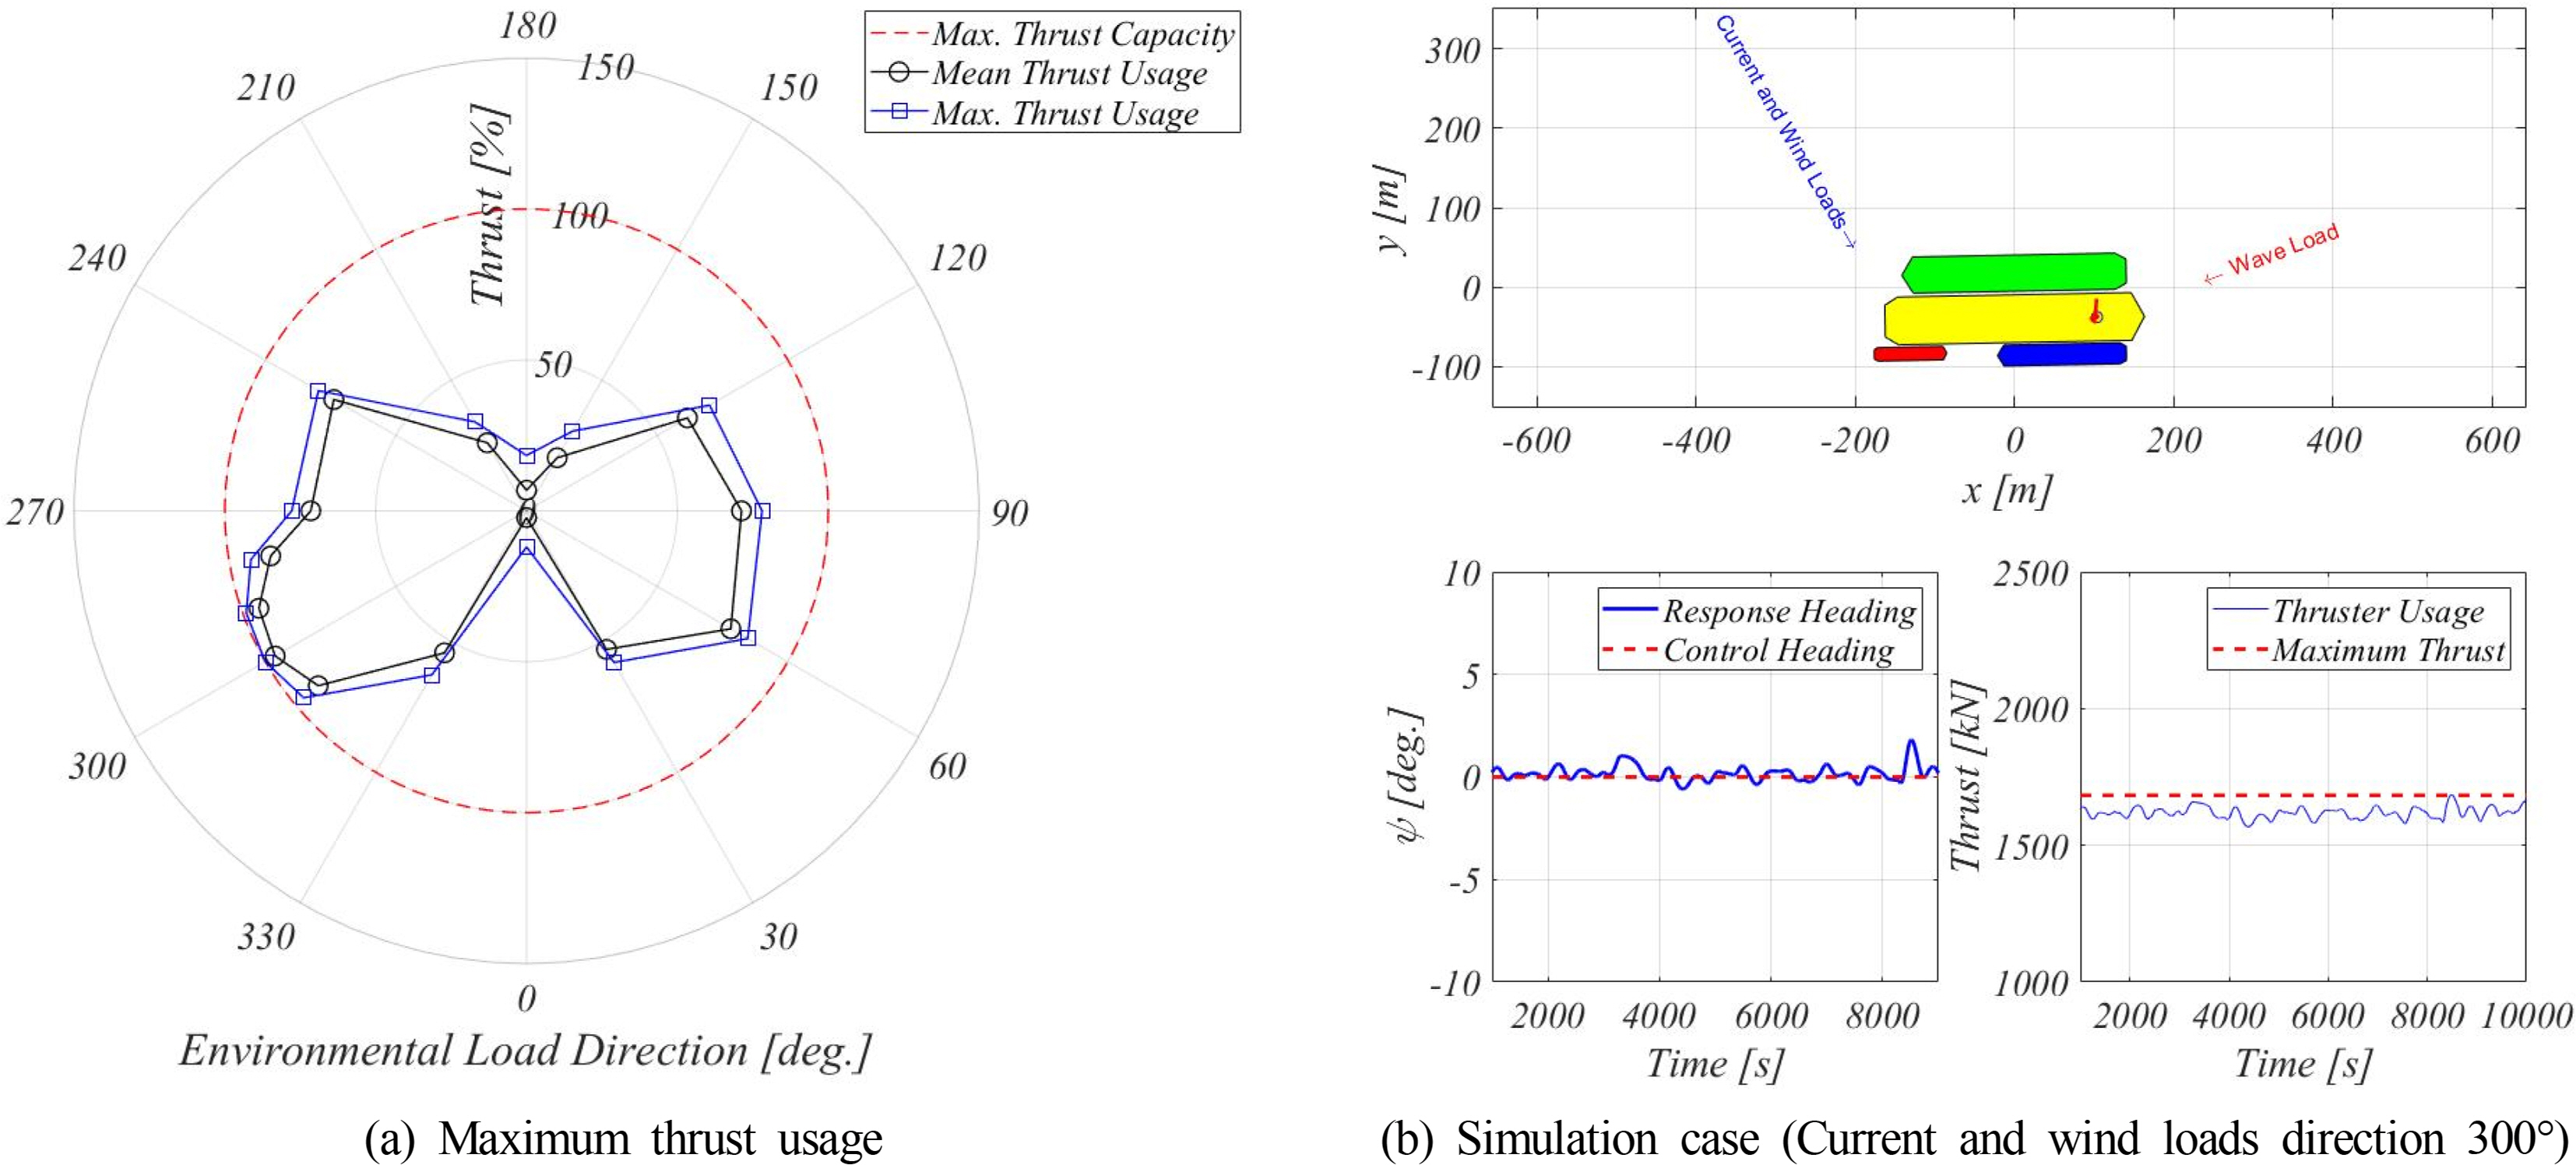
Simulations under combined environmental conditions with DP control (Pseudo-operating condition)
4. Conclusion
In this study, the heading angle characteristics and control performance were confirmed to improve the loading and off-loading performances of an FLBT. For the purpose of the study and efficiency of the analysis, a simplified model was used assuming that there was no relative motion of the moored vessel in the FLBT. The simulation result was compared with a model test result to confirm the effectiveness of the simplified model in which the environmental load and inertia of several floating bodies, including the FLBT, were replaced with the loads and inertia of a single vessel. The low frequency planar motion of the heading angle of the FLBT, in which several vessels were moored, was simulated using a simplified model. Through the simulation, the heading angle characteristics and control performance were analyzed by reflecting the environmental conditions calculated based on the estimated installation area, and the following conclusions were drawn.
The validity of the simplified model was confirmed through a comparison with a model test result. Although this model is only applicable to the same operating conditions under low maritime conditions, this study will be useful to determine the operational range.
Through the heading angle characteristic under the operating conditions defined in this study, it was confirmed that the current load, which is the largest component, has the most significant effect on the static heading angle and this suppresses the long period slewing motion that occurs when the wind and wave drift loads act individually. Long period slewing motion against the wind and wave drift loads is due to the yawing instability, and it was observed from the numerical analysis that the stability could be improved by increasing the surging resistance.
The static heading angle due to the operating conditions was the angle at which 5K and 30K LNG-BSs were exposed to environmental loads, and it was confirmed that the ocean wave shielding effect of the FLBT and LNG carriers cannot be obtained, which indicates that the loading and off-loading performances are degraded. This heading angle characteristic suggests that heading angle control using a stern thruster is necessary to improve the loading and off-loading work performances.
A numerical analysis was performed under the collinear environmental load conditions to verify the general heading angle control performance. Through the results of numerical analysis, it was confirmed that heading angle control is possible for the environmental loads ranging from 90° to 270°.
To estimate the environmental conditions under which the loading and off-loading work performances can be improved, the direction of the wave drift load that can have a shielding effect was fixed, and the heading angle control performance was examined while changing the remaining environmental disturbances. Consequently, it was possible to control the wind and current loads in all the directions. This indicates that it is possible to have the shielding effect against the ocean wave for the operating conditions defined in this study with the capacity of the currently designed stern thruster.
The operating range of the FLBT was confirmed through these heading angle characteristics and control performance. As the reviewed results reflect various assumptions, some limitations need to be corrected through actual sailing data. However, the analysis and results using the simplified model and model tests can be used as a guide for establishing an operating procedure before construction.
Acknowledgements
This study is supported by the Ministry of Ocean and Fisheries in South Korea, “Development of Technology for Floating Offshore LNG Bunkering System (PMS4140)”. All support is gratefully acknowledged.