Review of Ice Characteristics in Ship-Iceberg Collisions
Article information

Abstract
The International Ice Patrol (IIP) was established after the Titanic collided with an iceberg off the eastern coast of Canada in 1912 and sank, killing more than 1,500 people. Recently, the IIP has analyzed satellite images and provided safe operation information to vessels by tracking the occurrence and movement of icebergs. A large number of recent arctic studies mainly deal with sea ice formed by freezing seawater related to sea routes and resource development. The iceberg that collided with the Titanic was land-based ice that dislodged from a glacier and fell into the sea. The properties of these two types of ice are different. In addition, vessels operating in ice-covered waters such as the Arctic sea have an ice-breaking function or minimum ice-strengthened functions. Ships operating on transatlantic routes including the eastern coast of Canada do not necessarily require ice-strengthened functions. Hundreds to thousands of icebergs are discovered each year near the area where the Titanic sank. In this study, the status of ship-iceberg collision accidents was investigated to provide useful information to researchers, and the physical and mechanical characteristics of icebergs were investigated and summarized.
1. Introduction
Over 100 years have passed since the Titanic, one of the world’s most widely known ships, sank after hitting an iceberg. According to Dasgupta(2019), the International Ice Patrol (IIP) was established to properly monitor icebergs generated in the wake of the accident. However, in his article describing 10 ships that sank due to a collision with an iceberg, Dasgupta emphasized that the Titanic was not the first ship that sank after striking an iceberg and would not be the last one to suffer such an accident, either.
Ship collisions are considered an important problem in maritime accidents (Wikipedia, 2021). First, ship collisions can result in the loss of human lives. The Titanic hit an iceberg and sank in the North Atlantic Ocean about 740 km south of Newfoundland, Canada, on April 14, 1912, causing an estimated maximum of 1,522 deaths (Hill, 2001 - 1,503 people; Bigg and Billings, 2014 - 1,514 people; Dasgupta, 2019 - 1,522 people). Ship collisions can also cause environmental disasters, including oil spills. In 1989, the Exxon Valdez ran aground off the coast of Alaska and leaked 41,640 kL of crude oil into the sea, causing an ecological disaster that threatened the local marine ecosystem. Analysis data on the cause of the accident (Paik, 1992) revealed that it was related to a glacier: the ship ran aground on a reef while trying to steer clear of a group of floating ice packs that broke off from a glacier. Ship collisions generally entail substantial financial losses for ship owners. In 1989, the Trave Ore paid about 4 million dollars for ship repair alone after it struck a bergy bit (Hill, 2001). This amount did not include the amount of compensation for the loss of cargo or the operating deficit for ship operations.
Icebergs are chunks of ice that float above the water surface and have broken off from land-based ice. They are made of frozen fresh water with little salt, they are lighter than sea water and are more likely to float above the water surface than sea ice. For smaller icebergs, the fractions exposed above the water surface generally have a length of several meters, so they are not easily detected by instruments such as radar. However, the total mass, including the mass of the portion below the water surface, is tremendous, so an iceberg can generate huge energy when it collides with a ship. This energy is very dangerous when ship-iceberg collisions occur. When the iceberg responsible for the sinking of the Titanic was reconstructed based on the accounts of survivors, it was estimated to have a depth of 100 m and a length of 125 m, and its mass was estimated to be as large as over 2 million tonnes (Bigg and Billing, 2014).
This study reviews the data of previous investigations to investigate the characteristics of ice related to ship-iceberg collisions. For this purpose, we first reviewed statistical data on ship-iceberg collision accidents. This review was conducted to gain a proper understanding of the historical status and the overall characteristics of the occurrences of ship-iceberg collision. In addition, among major ice parameters related to ship-iceberg collision accidents, key properties such as the size, mass, shape, and strength of icebergs were reviewed with focus on previous research data. This analysis is expected to serve as a starting point for a more practical engineering approach to the problem of ship-iceberg collision. Finally, current efforts to prevent ship collision accidents due to icebergs were briefly summarized.
2. Statistics on Ship-Iceberg Collision Accidents
Table 1 shows 10 ships that collided with an iceberg (Dasgupta, 2019) based on the number of fatalities. Among the 10 accidents, the exact causes have not yet been clarified for the Naronic and the Hans Hedtoft, but since they are presumed to have been caused by icebergs, they were also included in the article. The 2,857-ton freighter Hans Hedtoft set out on a voyage bearing the prideful label of the “safest afloat,” but when the accident happened, the fishing boat that arrived at the location after receiving a distress signal did not find any traces of the ship, and the mystery remains unsolved. As shown in Table 1, aside from the Islander, 9 accidents occurred in the North Atlantic, and they mostly occurred between January and April regarding the seasonal time of the accident.

10 ships sunk by accident with iceberg
The National Research Council of Canada (NRC) has built an iceberg-ship collision database using MS Access. This database includes 670 collision accidents that occurred in the Northern Hemisphere (Hill, 2001; Hill, 2006). Most of these accidents occurred in the Grand Banks area southeast of Newfoundland Island in Canada (Fig. 1). Hill (2001) analyzed the number of ship-iceberg collisions per year and the extent of sea ice using data from the database for a period of almost 200 years from 1810 to 2004. The results showed significant correlation between collisions and sea ice (Fig. 2). Kujala (1991), Hanninen (2005), Marchenko (2012), and Marchenko (2014) provided related information for ship-iceberg collision accidents outside the east coast of Canada or the northwestern part of the North Atlantic.
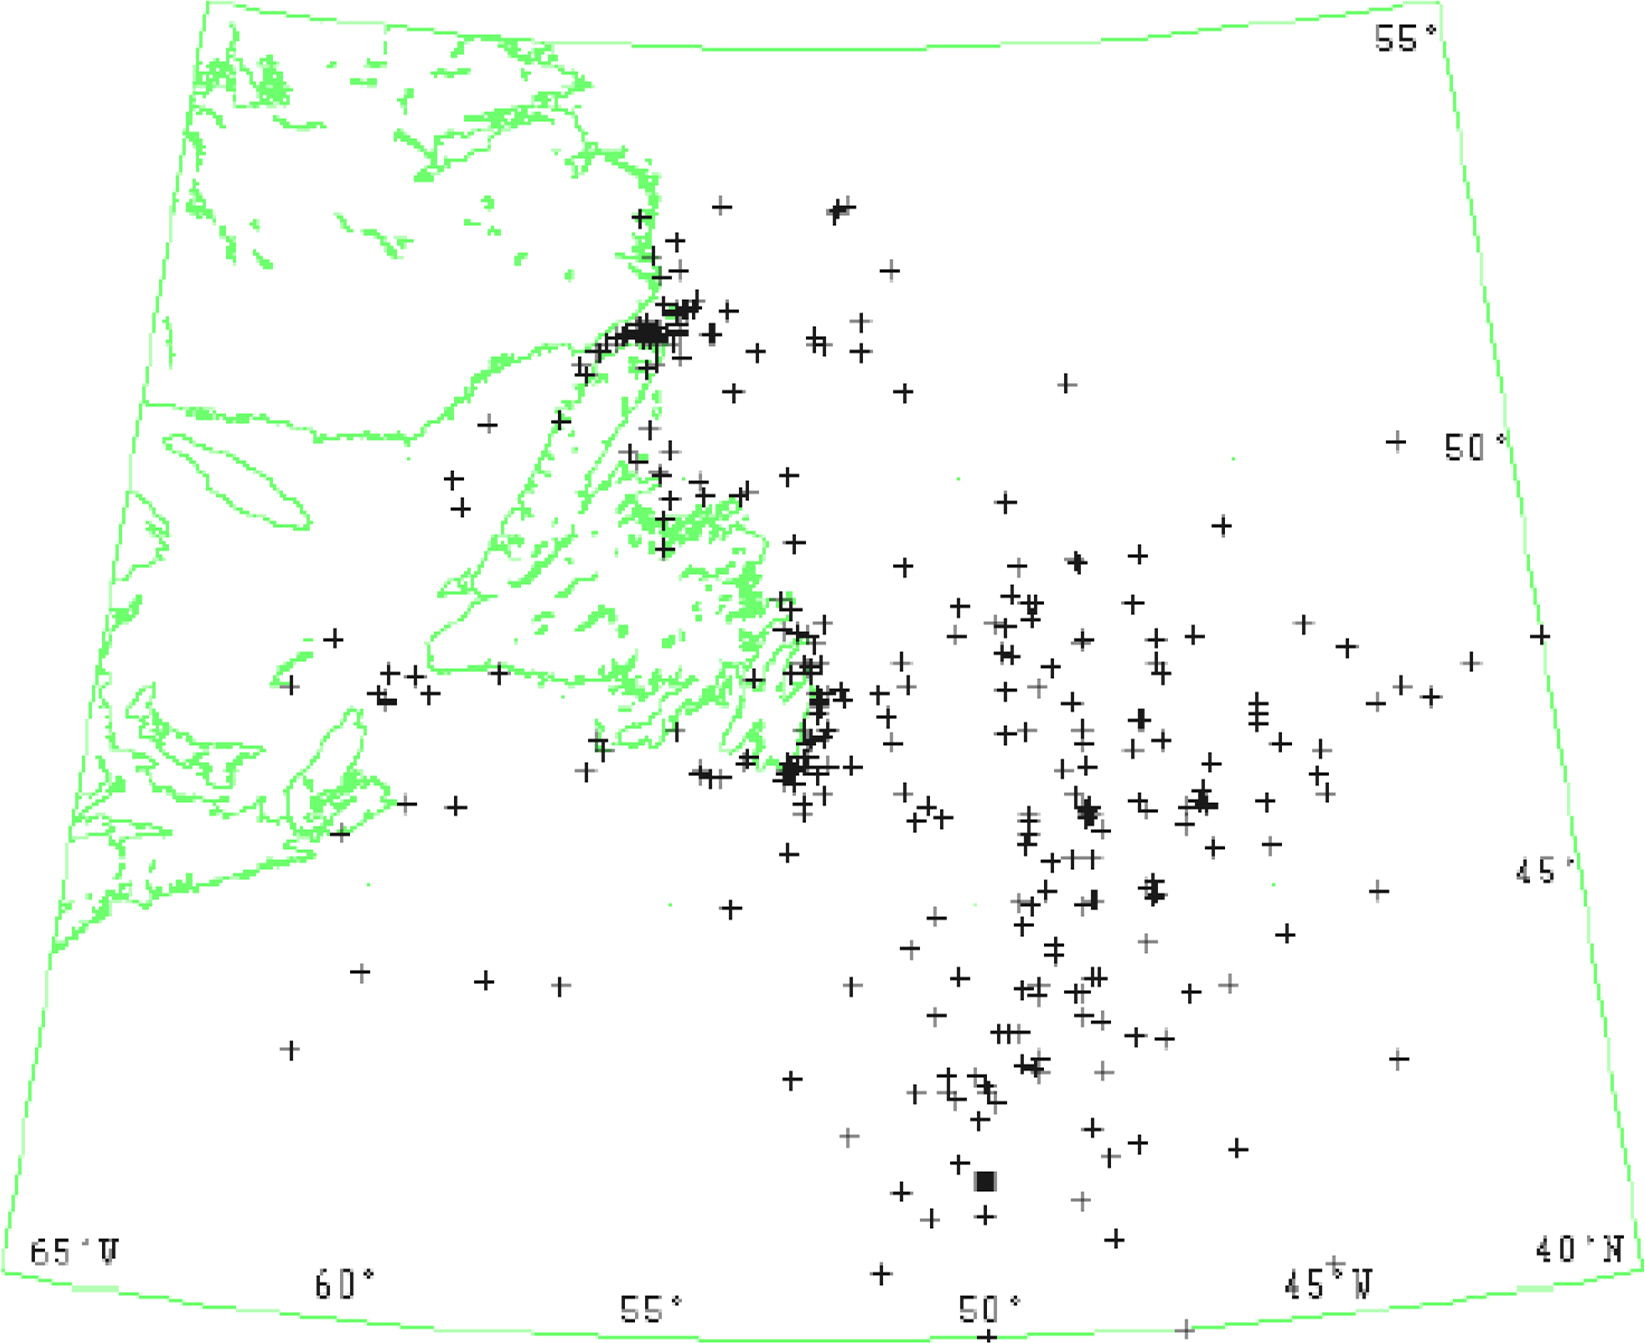
Chart of the approximately 300 known locations of iceberg collisions off Newfoundland with the Titanic location marked as a square (Hill, 2001)

Inter-annual variation of iceberg collisions and sea ice extent with a 7-year period moving average (Hill, 2006)
Hill (2001) presented the monthly distributions of the number of collisions and the average number of icebergs, as shown in Fig. 3. It can be seen that the monthly distributions of the two variables show close similarity. However, as pointed out by the author, this data does not include changes in the marine traffic volume. In addition, Fig. 2 shows that the number of collisions reached a maximum of 31 at the end of the 19th century, but it has largely remained at a low level with a maximum of 3 collisions per year since the 1940s. The analysis of the types of ships that crashed into an iceberg using this database showed that ships colliding with an iceberg were mostly passenger ships and general cargo ships until 1940, but fishing vessels and bulk carriers have made up a large proportion of them since 1990. In addition, there have been no casualties due to a collision with an iceberg since the 1960s (Hill, 2006).
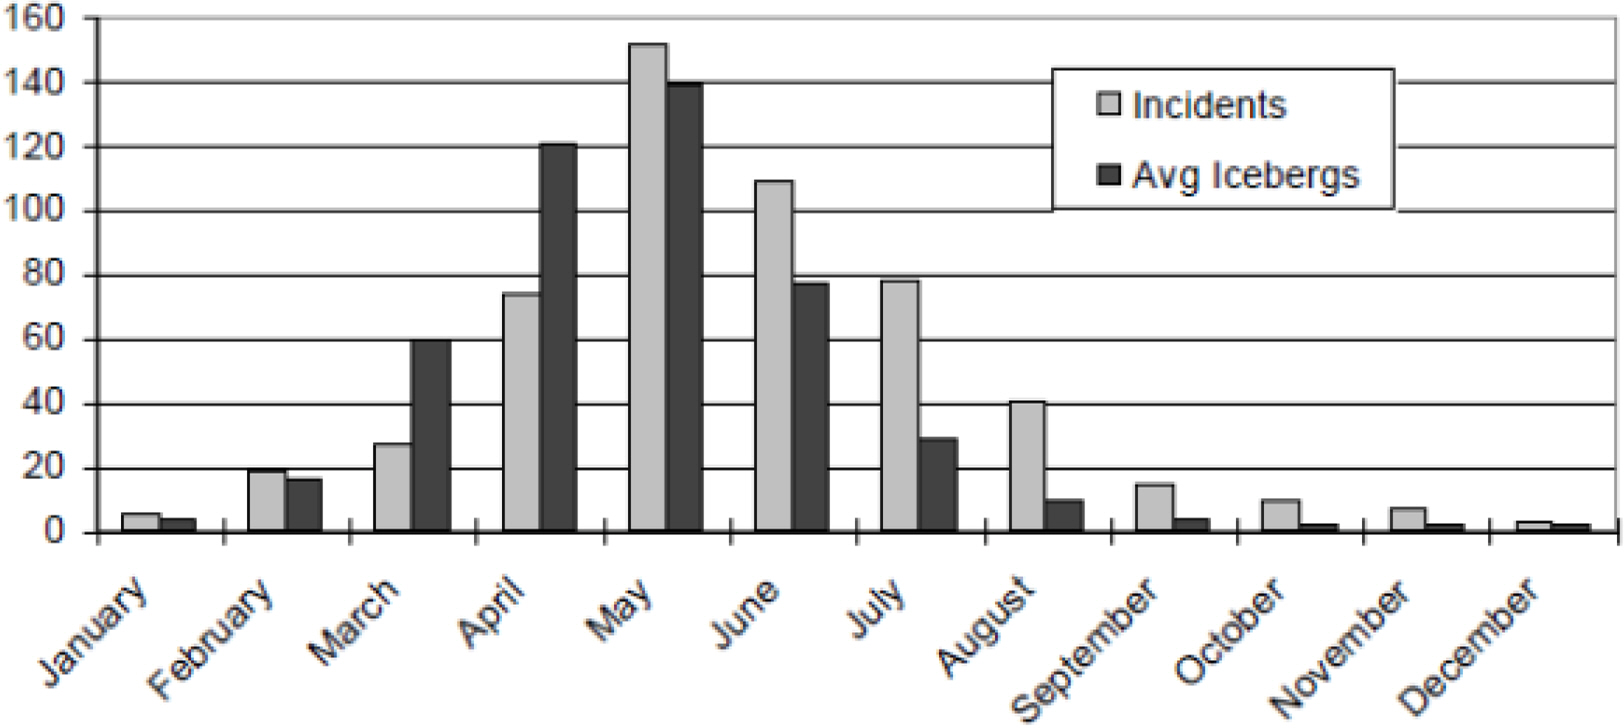
Comparison of 545 incidents in the North Atlantic sorted by month and the average monthly iceberg count (Hill, 2001)
Marchenko (2014) investigated ship accidents caused by floating ice from the accident of the icebreaker Admiral Lazarev in the East Siberian Sea in 1965 to the accident of the Akademik Shkalskiy in the Antarctic Ocean in 2013. He classified these accidents into three types: ice floe hit, nipping/trapping by ice, and ice jet. “Ice floe hit” refers to cases where a ship sailing at a relatively high speed collides with solid sea ice in a situation where a small number of pieces of sea ice are floating in the sea at a sea-ice concentration lower than about 15–20%, and visibility is reduced by fog. “Nipping/trapping by ice” refers to cases where a ship is trapped in sea ice and is unable to move. This type of accident occurred frequently in the early 20th century, which was the early pioneering period of the Arctic sea routes, but it rarely occurs in the waters with floating icebergs dealt with in this study. “Ice jet” refers to cases where a ship collides with floating ice moving at a relatively high speed (about 0.5‒1 m/s), and this type of accident is known to occur mainly in straits and bays.
Fig. 4 shows the relative moving directions of a ship and floating ice with respect to each other. Ship-iceberg collisions can be divided into cases where the bow structure of a ship sailing at a relatively high speed collides with the edge of an iceberg in a situation of poor visibility due to fog or other factors and cases where the iceberg is pressed against the side shell of the ship. In cases similar to Fig. 4(a), the impact force is determined by the ship speed and the angle of impact, and the shape and mass of the iceberg are important factors in the collision. In the case shown in Fig. 4(b), static ice load can be increased if the side shell and the iceberg move slowly in directions perpendicular to each other.
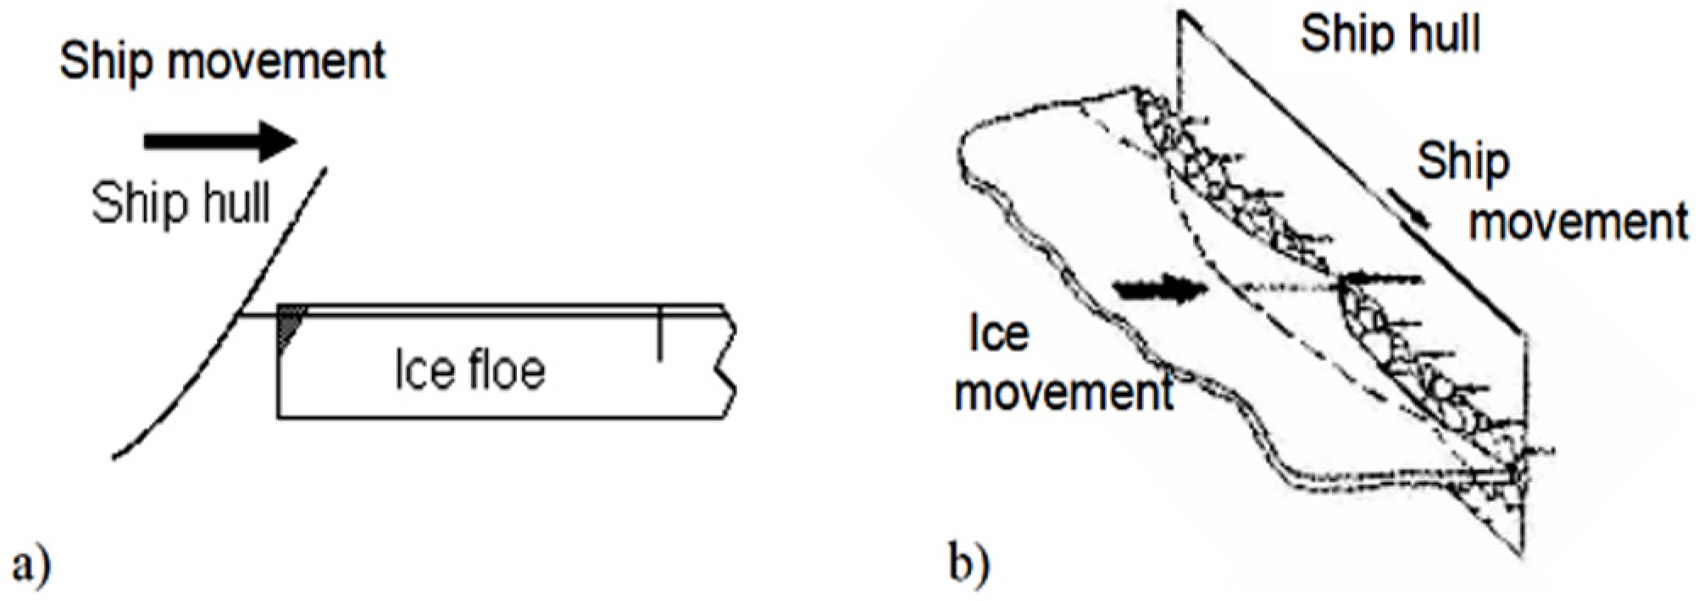
(a) Ship moves and hits an ice floe or (b) ice is pressed against ship side (Jalonen et al., 2005)
Fig. 5 shows a vessel that collided with ice at a high speed and sustained damage in the bulbous bow, even though the accident occurred in July, a summer month when ice becomes weak. This seems to correspond to the case in Fig. 4(a), and the high speed of the ship actually seems to be the main cause of the damage of the vessel (Canadian Coast Guard, 2012). In addition, the Reduta Ordona, a bulk carrier, collided with an iceberg in July 1996 and sustained heavy damage in the ship-length direction on the side shell on the forebody, which can be considered an example of the case shown in Fig. 4(b). Yu and Amdahl (2021) presented Fig. 6 as an example of sliding damage, which happens along the direction in which the ice slides

Bulbous bow of a cargo vessel with a Lloyd’s 100 A1 Ice Class 1A damaged in ice en route Iqaluit, Nunavut, in July (Canadian Coast Guard, 2012)
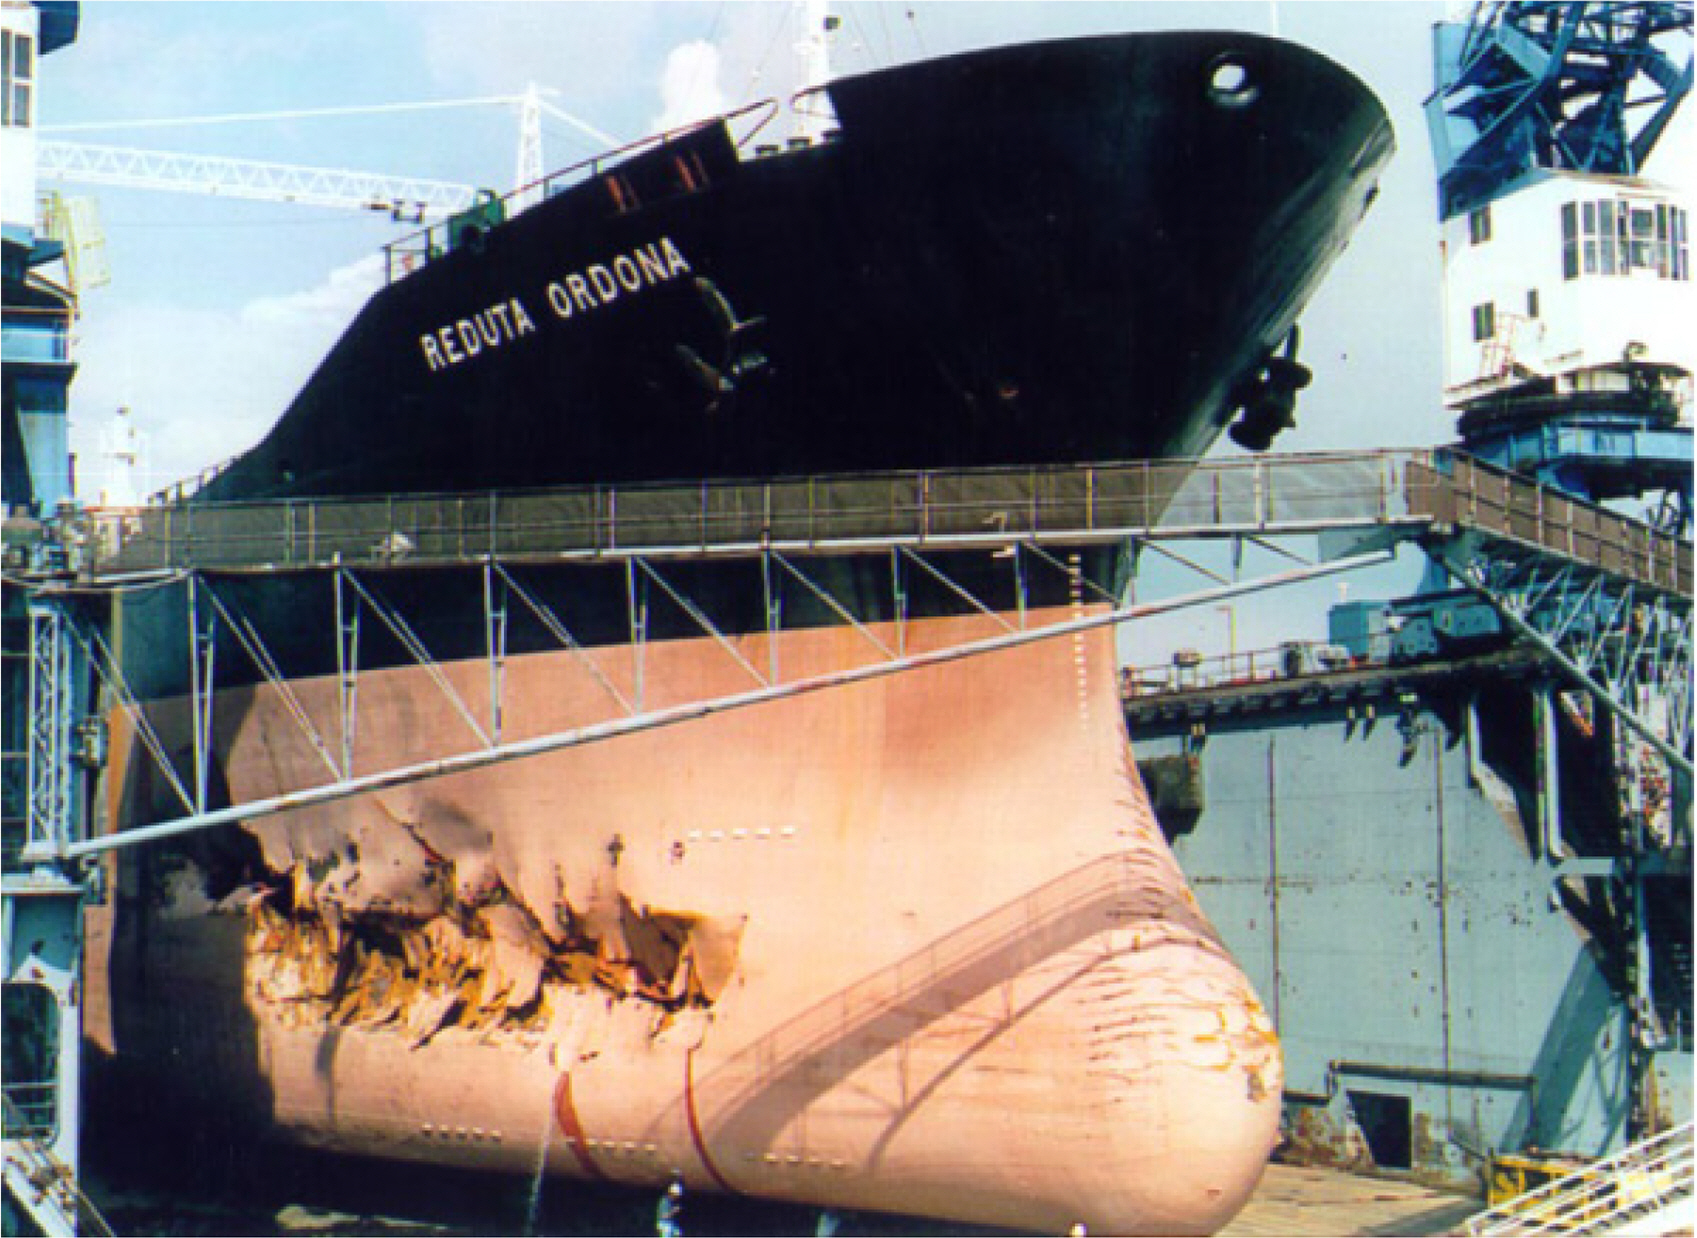
Damaged side structure of bulk carrier Reduta Ordona by collision with a growler in Hudson Strait on its way from Poland to Churchill, Manitoba, July 21, 1996. Quebec City, MIL Davie shipyard (Foumler et al., 2020).
A ship that recently sank due to a collision with sea ice was the MS Explorer registered in Liberia, which was a Det Norske Veritas (DNV) 1A1 Ice-A class ice-strengthened vessel (Bureau of Maritime Affairs, Liberia, 2009). Although this accident was related to sea ice and not icebergs, we describe it briefly since it occurred recently. The ship was a cruise ship built in Finland in 1969 and operated around Ernest Shackleton via the Drake Passage in the Antarctic Ocean, which is known for rough waves (see Fig. 7 for the sea route of the ship). When the accident occurred, the ship collided with sea ice in the Bransfield Strait near King George Island and sustained a gash similar to a deep cut, which caused seawater to flood into the ship. This ship eventually capsized, as shown in Fig. 8, but 154 people aboard including passengers and the crew were all rescued.
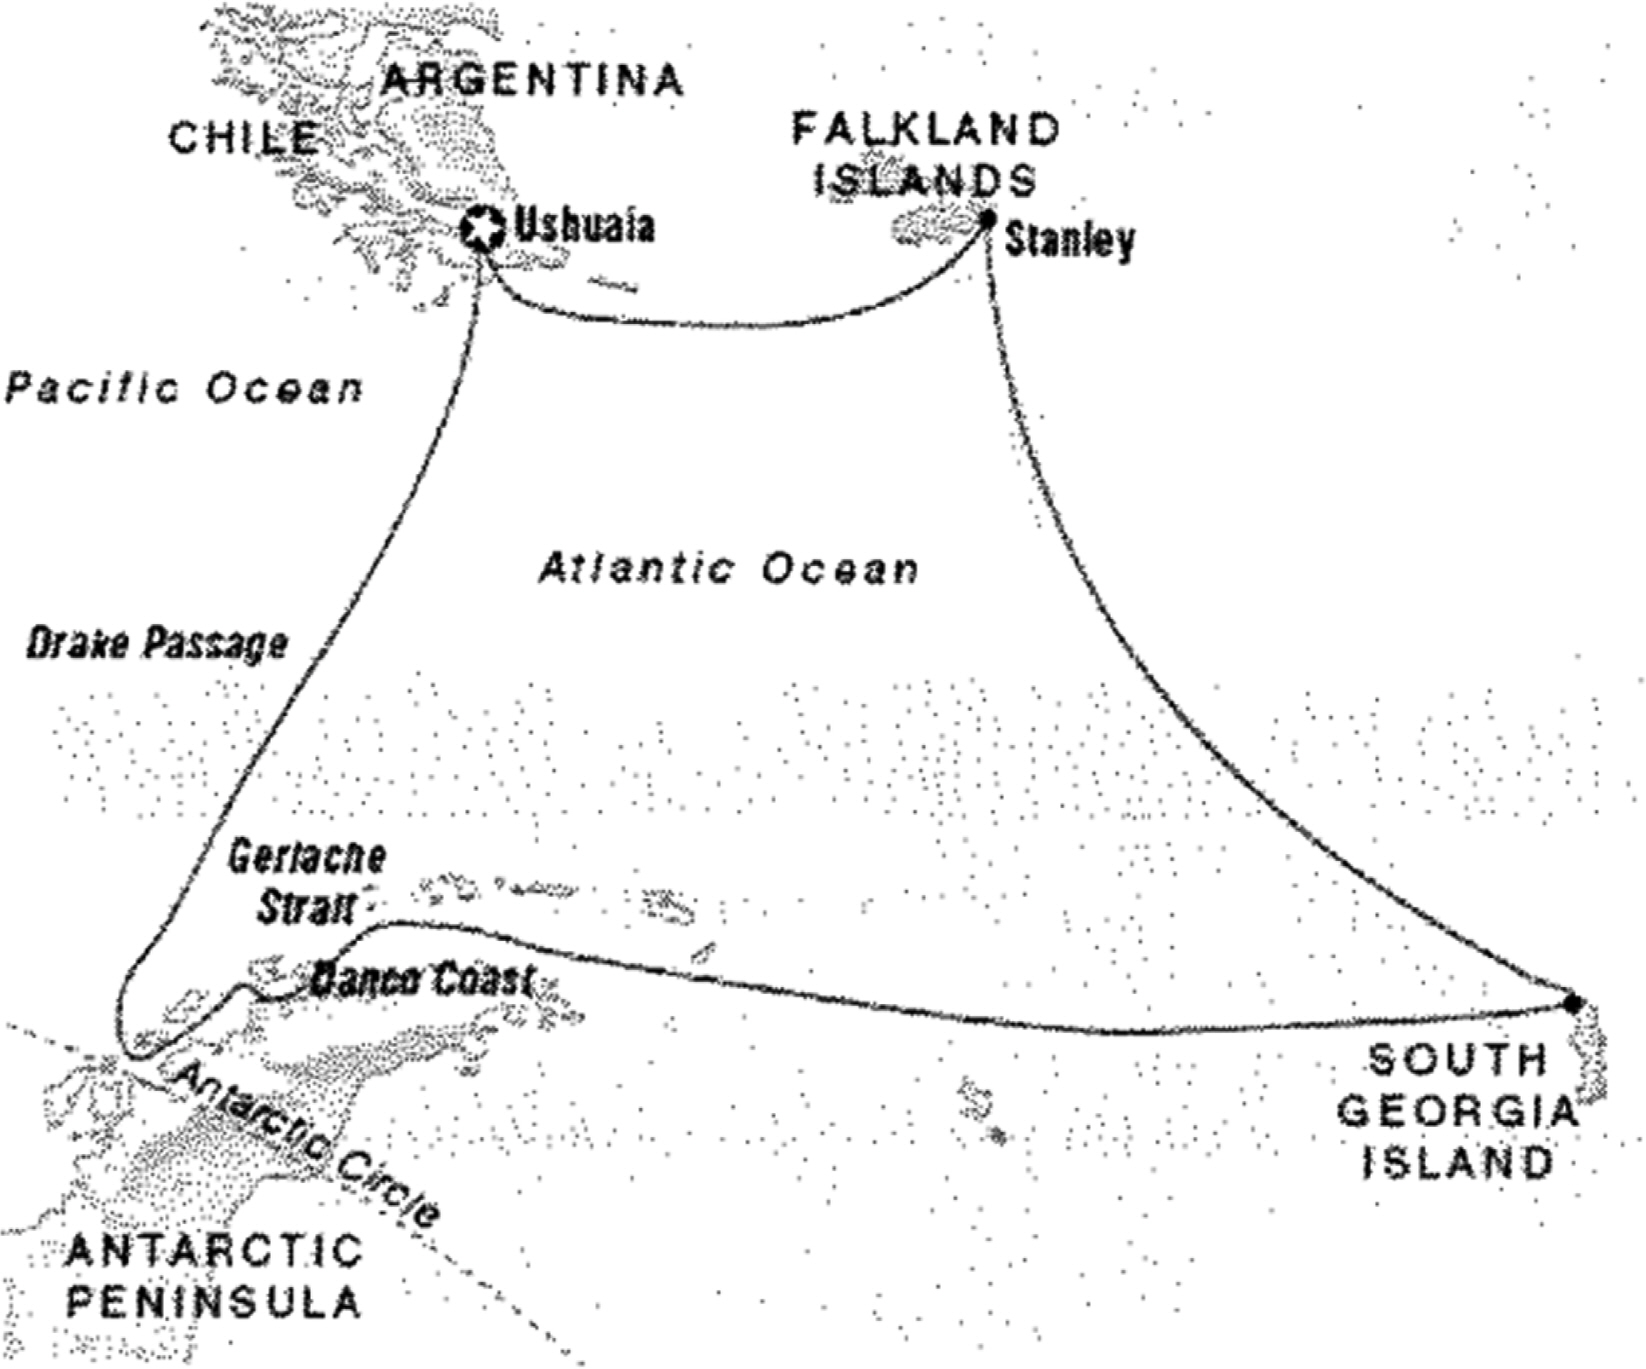
Route for Spirit of Shackleton Tour by the MS Explorer (Bureau of Maritime Affairs, Liberia, 2009)

The Explorer lying over its side after collision with ice wall (BBC News, 2007)
A final report on the investigation of the accident stated that damage of punctures and slices with a minimum length of 3.6 m occurred along with the shell plating in the longitudinal direction of the ship (Bureau of Maritime Affairs, Liberia, 2009). The report mainly attributed the accident to misjudgment based on the experience of the ship operator, who entered the ice-covered waters despite the fact that the sea ice that formed in the accident location was thicker and harder than general first-year sea ice. In connection with this, the Sea Ice Nomenclature of the World Meteorological Organization (WMO) (WMO, 2015) classifies first-year sea ice as three types according to the thickness: thin, medium, and thick first-year ice. First-year ice with a thickness of 30‒70 cm is classified as thin, first-year ice with a thickness of 70-120 cm as medium, and first-year ice with a thickness of more than 120 cm as thick.
3. Characteristics of Colliding Ice and Sea Ice Extents
3.1 Size of Ice with a High Likelihood of Colliding with a Ship
Generally, floating ice can be classified according to size. “Growlers” are smaller pieces of floating ice with the size of a truck or grand piano. They have a height of less than 3 ft (about 0.91 m) above the sea surface but cover a large area of up to about 215 ft2 (about 20 m2). “Bergy bits” are larger than them and typically have a height of 3‒ 16 ft (about 0.91‒4.9 m) above the sea surface and an area of approximately 1,000‒3,000 ft2 (about 93‒279 m2). Pieces of floating ice larger than bergy bits are referred to as icebergs (Bigg and Billing, 2014). Fig. 9 shows a comparison between the sizes of an iceberg, bergy bit, and growler, which can be figuratively described as follows (Thompson-Munson, 2021):
- Growler : Human-sized or smaller
- Bergy bit : Car-sized to house-sized
- Iceberg : Building-sized or larger
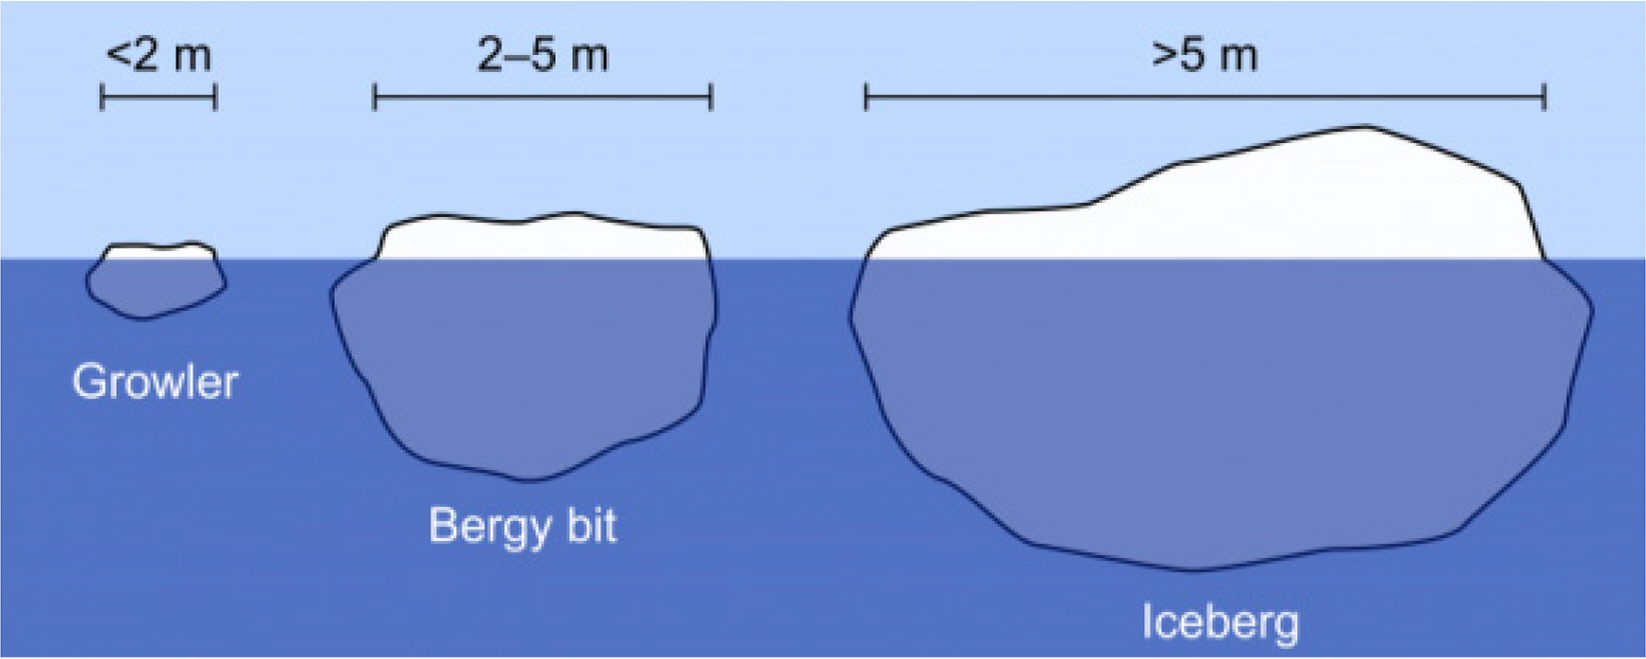
Three iceberg size categories: growler, bergy bit, and iceberg (Thompson-Munson, 2021)
Icebergs are chunks of ice that have broken off from land-based glaciers into the sea and are made of fresh-water ice. The specific gravity of an iceberg ranges from 0.85 to 0.91, so the portion visible above the sea surface is merely a fraction of the iceberg. Since the specific gravity of sea water is generally about 1.03, approximately 12 ‒17% of the total mass of an iceberg floats above the sea surface. Icebergs are mainly created around the western coast of Greenland in the Northern Hemisphere and on the ice cap of Antarctica in the Southern Hemisphere (Choi, 2013; Jacka and Giles, 2007). Other regions where icebergs are formed include Axel Heiberg Island, Svalbard, and Novaya Zeml’ya. Icebergs are not found in Arctic seas since they originate in the mentioned regions and are moved south by the wind and currents (Palmer and Croasdale, 2013).
According to the WMO Sea Ice Nomenclature (WMO, 2015), floating ice refers to all types of ice floating in water and is classified as lake ice, river ice, and sea ice. Data related to river ice were published by Korzhavin (1971/2002) and the US Army Corps of Engineers (2002/2005). Sea ice refers to the ice formed from the freezing of sea water and discovered in the sea. With respect to the classification of floating ice by size, the terms floe and iceberg are related to the formation process of floating ice. Floes are formed as sea ice adheres together, while icebergs are chunks of ice that have broken off from glaciers. Floes are classified according to the length in the horizontal direction as follows: floe giant (10 km or more), floe vast (2 ‒10 km), floe big (0.5‒2 km), floe medium (100‒500 m), floe small (20 ‒100 m), ice cake (20 m or less), and small ice cake (2 m or less). Although it was published quite a long time ago, the book by Sanderson (1988) is one of the best books on sea ice mechanics, and another useful book currently available is that by Cammaert and Muggeridge (1988). Sea ice is not fully dealt with in this study, and further information concerning sea ice can be found in the two books.
Icebergs are classified according to size as follows based on the height and length of the part of the iceberg visible above the sea surface. Icebergs with a sail height of 75 m or greater and a length of 200 m or greater are classified as very large icebergs, those with a sail height of 46‒75 m and a length of 121‒200 m are large icebergs, those with a sail height of 16‒45 m and a length of 61‒120 m are medium icebergs, and those with a sail height of 5‒15 m and a length of 15‒60 m are small icebergs. Bergy bits refer to large pieces of floating glacier ice with a sail height of 1‒5 m and an area of 100‒300 m2, and growlers are defined as smaller pieces of ice than bergy bits (WMO, 2015).
In dealing with the problem of ship-iceberg collision, Addario et al. (2014) argued that it is a valid approach to estimate the size of icebergs, which is a major variable, from the size of detectable icebergs. They thought that since detectable icebergs can be avoided, they no longer pose hazards to ships. Based on the results of previous investigations, they determined that the size of icebergs identifiable by airborne radar is about 20 m. In addition, they also mentioned that it may be difficult to detect icebergs with a height less than 2 m in the sea conditions commonly encountered in the Arctic region. Based on these factors, they presumed that the maximum size of icebergs that are highly likely to collide with a ship is a sail height of 2 m and a waterline length of 20 m. The DNV data (Mejlaelander-Larsen and Hysing, 2006) considers the length of icebergs identifiable by airborne radar to be 15 m or more. In addition, explanation data on icebergs from the National Snow and Ice Data Center in the U.S. (NSIDC, 2021) states that only icebergs with an area of 500 m2 or larger can be tracked.
Fig. 10 shows a diagram of the appropriate navigation method when bergy bits (relatively large fragments of ice that have broken off from glaciers) are present together with icebergs. It is advised that a ship sail in the windward direction with respect to the iceberg to the left of the ship. In addition, the Canadian Coast Guard (2012) recommends taking extra care in monitoring bergy bits and growlers since they pose a great danger in that it is difficult to discern them from white caps in the open sea, as shown in Fig. 11, and they are sometimes hidden in rubbed ice in ice-covered waters. Even relatively large ones are difficult to detect by marine radar because the freeboard above the sea surface is small, and the sides of bergy bits and growlers reflect radar energy away from the antenna. For these reasons, bergy bits and growlers are considered to present the greatest hazard to ships in ice-covered waters (Canadian Coast Guard, 2012).
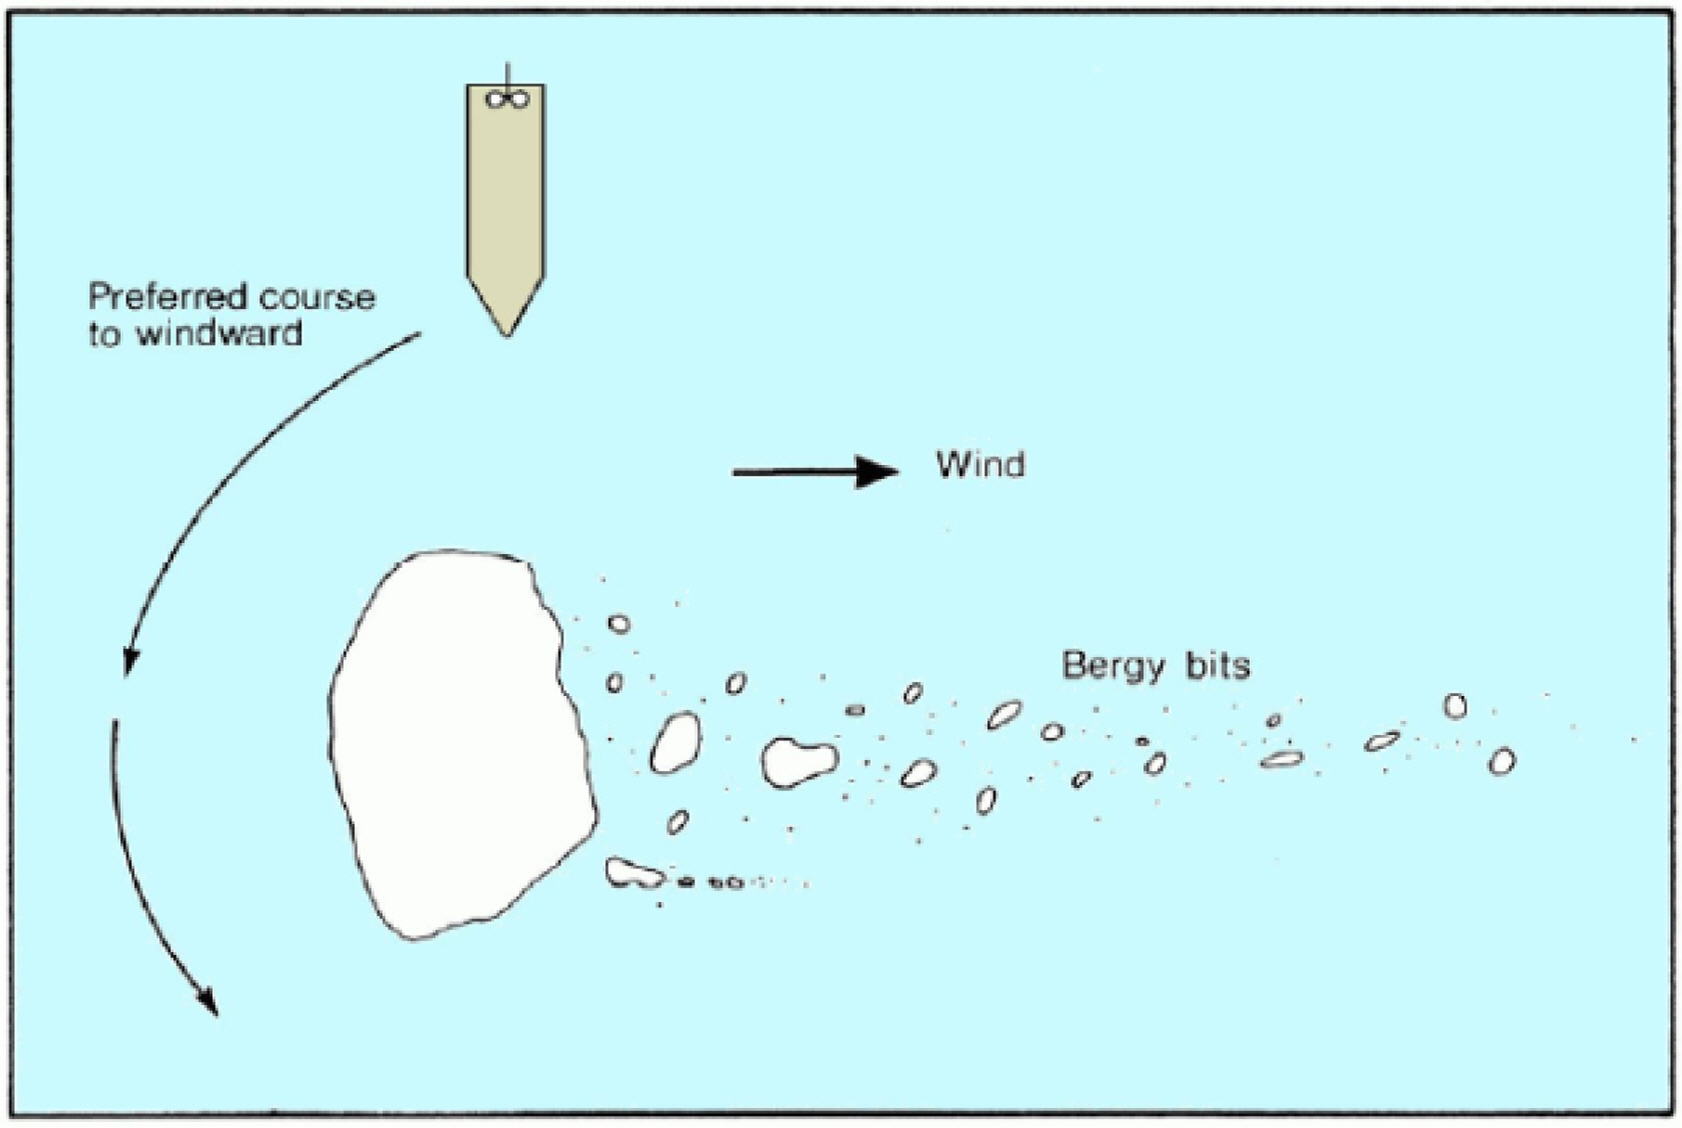
Navigating around an iceberg and bergy bits (Canadian Coast Guard, 2012).

Iceberg and growlers in the open sea (Canadian Coast Guard, 2012)
3.2 Shape of Colliding Icebergs
The actual shape of icebergs varies widely. Studies that performed measurements of shape data of these icebergs are summarized in Table 2. McKenna (2004) conducted shape characterization of icebergs by developing a method that allows us to connect the parts above and below the water surface in a consistent manner, satisfy hydrostatic considerations, and express the relationships between measured values of waterline length, waterline width, sail height, keel depth, and mass. Fig. 12 shows a representation of the overall shape of the iceberg named “Julianna” among the icebergs measured by the Dynamics of Iceberg Grounding and Scouring (DIGS) project. The iceberg had a waterline length of 292 m, a waterline width of 258 m, a sail height of 70 m, and a keel depth of 170 m (McKenna, 2005). McKenna (2005) also derived the relationships between the major parameters mentioned above for engineering application of the shape of icebergs.
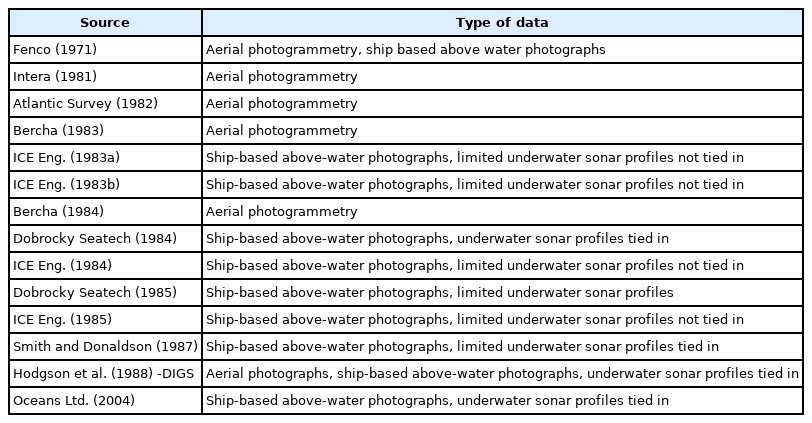
Summary of measured iceberg shape data (McKenna, 2004)
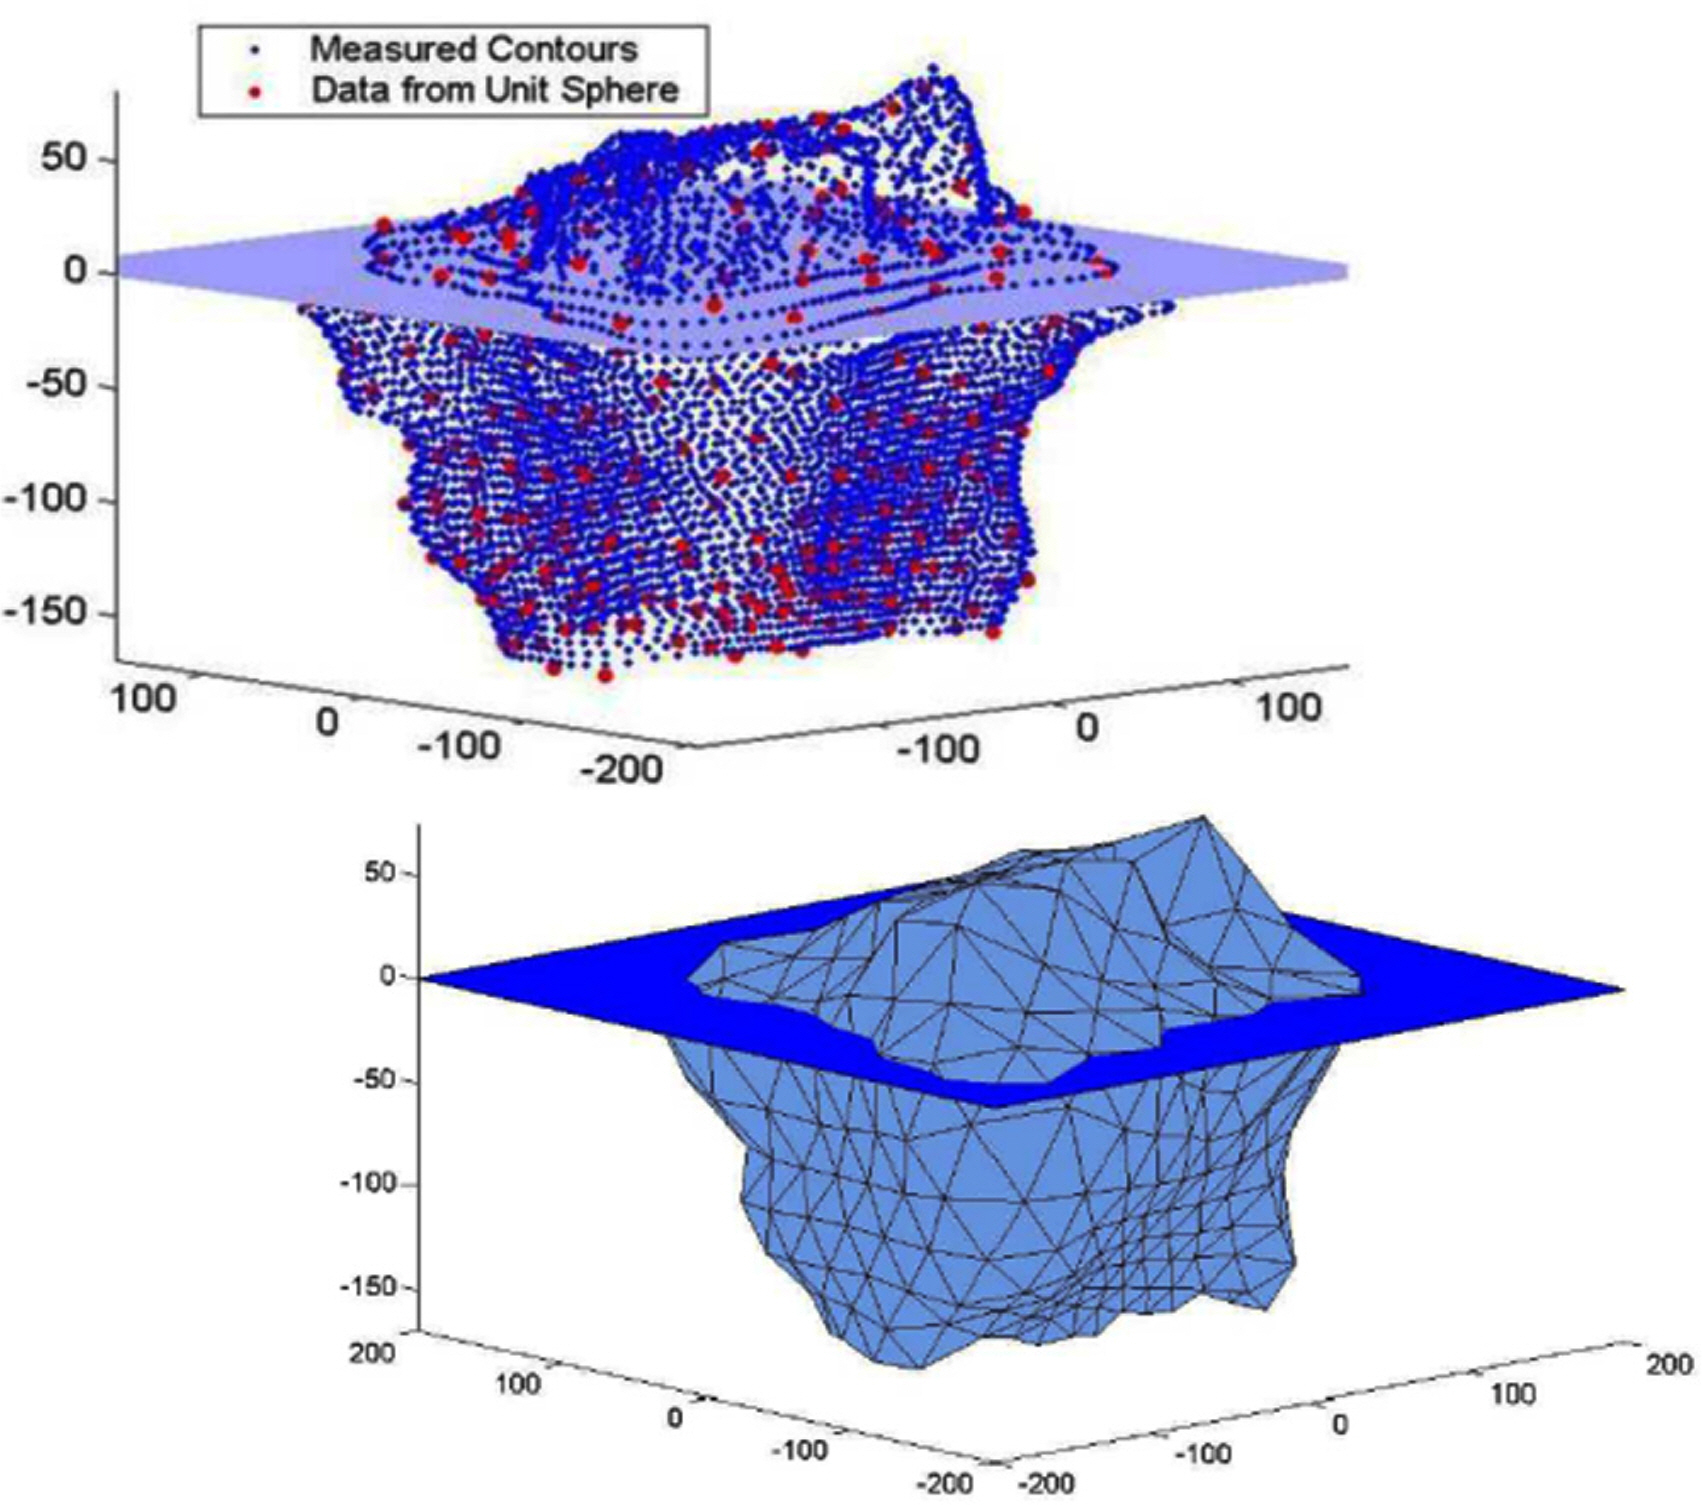
Iceberg “Julianna” showing measured contours and surface points associated with radial representations; triangular patch representation of surface points.
Liu (2011) described the following three possibilities in his analysis on the shape of icebergs in terms of the potential damage to the hull structure:
Icebergs with a sharp protrusion have the potential to cause great damage.
A blunt surface of icebergs may be less likely to cause damage since it has a large energy dissipation capacity. However, since it has greater energy at the same time, it may cause deformation of the internal structure.
The shape that can inflict the greatest damage to a ship may be somewhere between the shapes described in (1) and (2).
In connection with these possibilities, Addario et al. (2014) posited the three shapes of icebergs shown in Fig. 13 and conducted a collision analysis. Icebergs can also be classified according to the shape, as shown in Fig. 14 (Turnbull et al., 2015), which is important for the record of iceberg detections by ships. In this regard, materials on the method of classification of icebergs according to the shape can be easily found on the Internet. Generally, the data also includes the average ratio of the sail height to the keel depth.
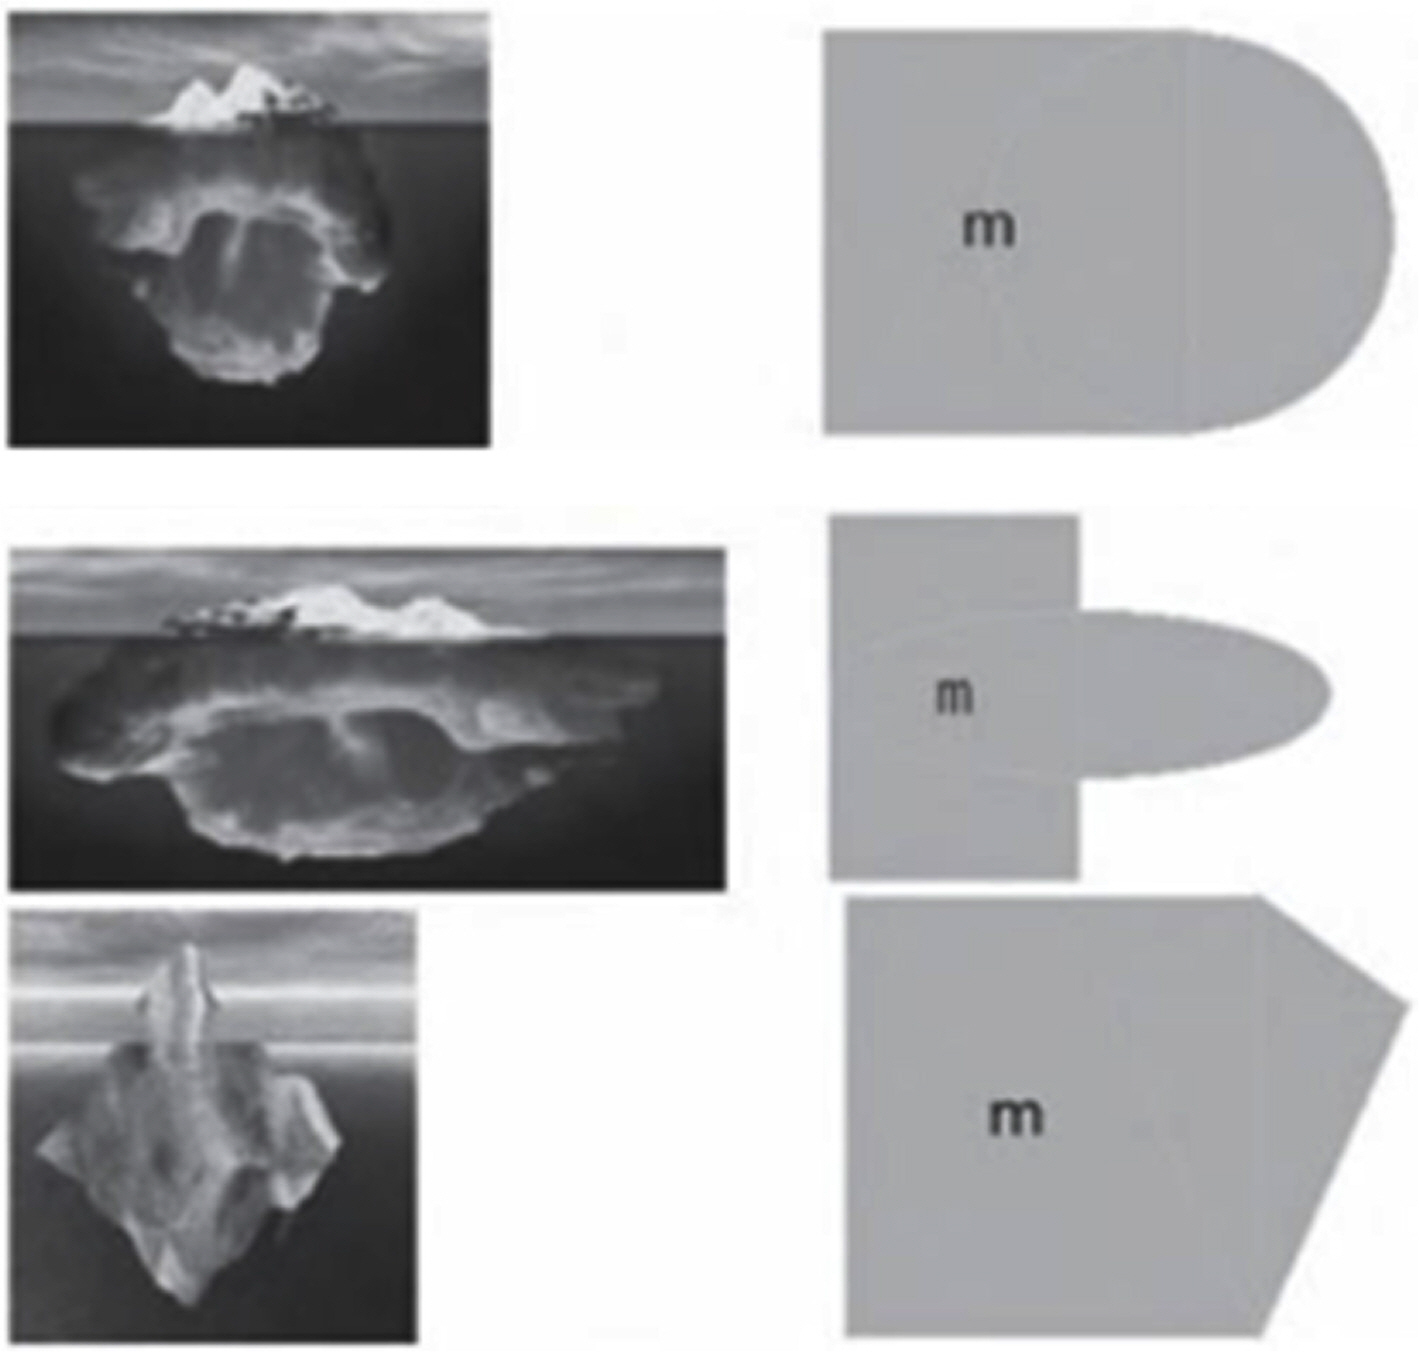
Selected shapes of iceberg (Addario et al., 2014)
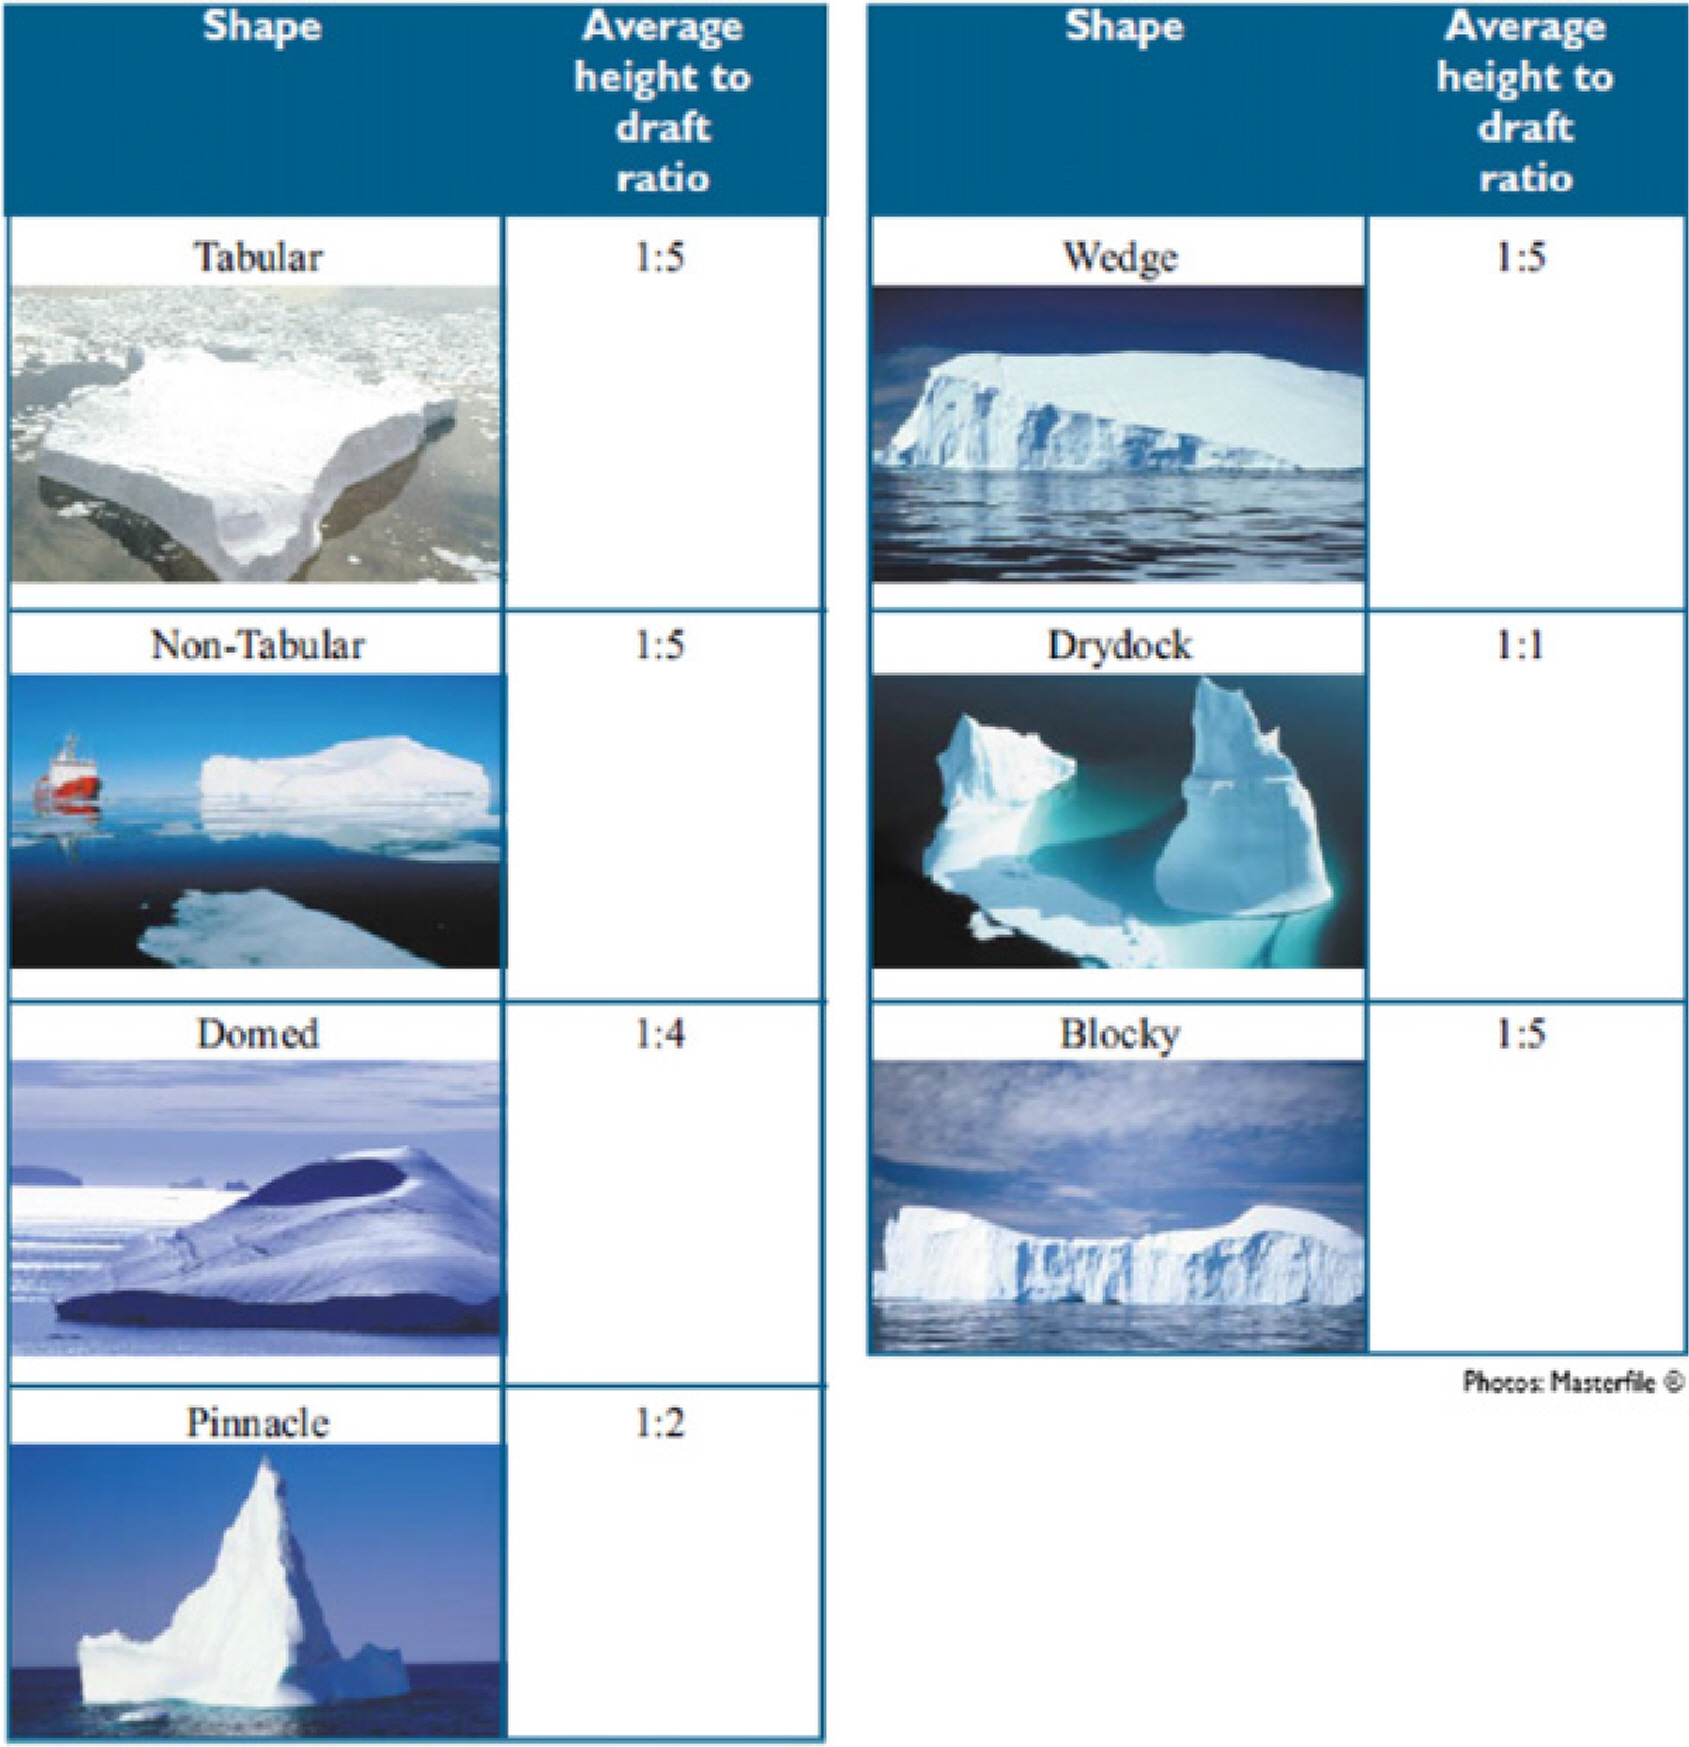
Sample photographs of seven standard icebergs shapes and their sail height to keel depth ratios (Turnbull et al., 2015)
In an ice collision analysis for LNG vessels, Suh et al. (2008) assumed that the shape of a bergy bit as a striking body is classified as three types: conical, spherical, and cubic. This is based on the data of DNV (Mejlaelander-Larsen and Hysing, 2006), and they are typical shapes of bergy bits that are likely to collide with LNG vessels sailing on the sea routes from Murmansk to the coast of the United States. For the bergy bit with a conical shape, it was assumed that the cone angle with the horizontal plane was 60°, the diameter of the base was 2.5 m, and the diameter at the water surface was 1.15 m. For the bergy bit with a spherical shape, it was posited that the diameter was 5.1 m, and the diameter at the water surface was 4.05 m to consider the characteristics of general icebergs.
3.3 Mass of Icebergs
Among the laws of physics related to general collisions, the law of conservation of energy is considered the most fundamental principle. This law means that the energy of the entire system must be conserved regardless of the situation in which a striking body collides with a struck body. Let us consider a situation immediately before a collision occurs in relation to the ship-iceberg collision problem. Presumably, the most reasonable scenario is to assume that the ship and the iceberg are both in motion. It is likely that the ship is naturally moving toward its destination and that the iceberg is moving slowly under the influence of currents and the wind. A huge problem in this situation is the enormous mass effect of the iceberg.
As mentioned earlier, the mass of the iceberg that collided with the Titanic was estimated to be about 2 million tonnes. Even if an iceberg with such a huge mass moves very slowly, its kinetic energy would be very large. The portion of an iceberg exposed above the sea surface is typically only 12‒17% of the total volume, and the size of the fraction exposed above the water surface is generally measured. Therefore, the mass of an iceberg is estimated based on the size and shape of the fraction of the iceberg above the water surface. Rudkin et al. (2005) presented a simple estimation formula for the mass M (units: t) of icebergs:

Iceberg shapes and their shape factors (Rudkin et al., 2005)
The mass of a blocky iceberg with a waterline length of 20 m and a sail height of 2 m posited by Addario et al. (2014) is calculated to be about 2,848 ton by Eq. (1). Sanderson (1988) presented a table of classification of icebergs according to the size and provided the estimated mass of each type of iceberg. According to Sanderson (1988), the mass of a growler is about 100 tons, and that of a bergy bit is about 1,000 tons. When the mass of a bergy bit with maximum size is calculated by this formula (for a sail height of 5 m and a length of 15 m), the mass of the bergy bit is determined to be about 4,000 tons. Gagnon (2007) conducted a numerical analysis of an impact experiment using an actual growler, and the growler used in the experiment was reported to have a size of 1.73 m × 0.88 m × 0.98 m and a mass of 1,068 kg.
Canada’s National Research Council Institute for Ocean Technology (NRC/IOT) conducted an experiment on bergy bit impact using the Terry Fox, a Canadian Coast Guard ice breaker, near St. Anthony on the northeast coast of Newfoundland in June 2001. During this experiment, data on icebergs was collected by methods such as aerial photography, exploration by sonar, and stereo photography. Ralph et al. (2008) calculated the size of icebergs using the data and presented the estimated mass of icebergs from several methods. Table 4 shows the mass of 5 icebergs with all dimension values among a total of 18 icebergs studied by Ralph et al. (2008). In Table 4, “ 0.3L3” indicates an empirical equation derived from measured data and is a useful estimation formula for mass when only the maximum waterline dimension values are given. R. cont indicates “revolved contour” and was considered to produce the best estimates by Ralph et al. (2008). It starts from the assumption that if an iceberg is homogeneous in density in all parts, the total volume (V) and the volume of the fraction exposed above the water surface (Va) are proportional to the density of surrounding water and the difference between the density of sea water and that of ice. In addition, uw cont represents “underwater contour” and is the mass calculated using the profile of the iceberg obtained by multibeam sonar.
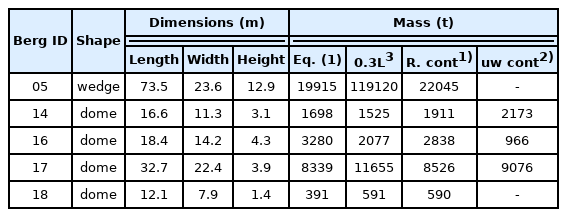
Calculated iceberg dimensions and mass based on photographic measurement (Ralph et al., 2008)
3.4 Strength of Iceberg, River Ice, and Sea Ice
According to the US Army Corps of Engineers (2002, 2005), the elastic modulus varies depending on the measurement techniques. Specifically, they reported that the measured values of elastic modulus obtained by in-situ measurements ranged from 0.4 to 9.8 GPa, the elastic modulus values of freshwater ice grown in a large laboratory tank ranged from 4.3 to 8.3 GPa, and the measured values of small specimens used for laboratories were higher. Yu and Amdahl (2021) conducted a numerical analysis of glacial ice impact, and for this purpose, ice density was posited to be 900 kg/m3 based on ISO 19906 (2019). Also, the elastic modulus and Poisson’s ratio were assumed to be 9.5 GPa and 0.3, respectively, based on the study by Timco and Weeks (2010). A friction coefficient of 0.15 was also used.
The mechanical properties of ice are known to vary depending on the measurement environment, such as in situ measurements and the laboratory, as well as the specimen size. Thus, to standardize a cold room test, Kim (2007) focused on the uniaxial compression test of fresh water ice grown in a laboratory. He reported that ductile failure occurred when the strain rate was 10−5‒10−4 (1/s) or lower.
According to a review study on the mechanical properties of ice and snow (Petrovic, 2003), the tensile strength of ice ranges from 0.7 to 3.1 MPa, and the compressive strength ranges from 5 to 25 MPa. In addition, as the temperature decreases or as the strain rate increases, compressive strength increases. Tensile strength is not very sensitive to these variables, and as the ice grain size increases, the tensile strength decreases. In addition, elastic modulus ranges from 9.7 to 11.2 GPa, and Poison’s ratio ranges from 0.29 to 0.32, which is summarized based on previous data (Haynes, 1978; Gold, 1988; Lee and Schulson, 1988; Schulson, 1999).
Glacial ice in which icebergs originate is formed from snow, which gradually changes into ice. This change depends on temperature and pressure, and ice is formed at a density of about 830 kg/m3. The density of pure ice is about 917 kg/m3, and air bubbles can be formed within ice at up to 10% of the total volume of the ice (Daley and Veitch, 2000). The density of freshly deposited snow is 50–300 kg/m3, and the density of wet snow or firm snow is about 400–830 kg/m3 (Paterson, 1994). The average density estimated from the measured porosity values of 5 icebergs that drifted to the coast of Newfoundland was about 893±7 kg/m3, and the grain size was measured to be about 15 mm (Gammon et al., 1983).
Gammon et al. (1983) performed a uniaxial compression test for glacial ice at an average temperature of −4.2°C and a constant strain rate of 1.085×10⁻³(1/s). The average values of elastic modulus and uniaxial compressive strength were 6.092 GPa and 5.34 MPa, respectively. They also carried out experiments on freshwater ice and found that the strength of glacier ice is about 35% higher. Gagnon and Gammon (1995) performed a flexural strength test using specimens obtained from icebergs, and the average density estimated from the measured value of porosity was 895 kg/m3. Another study repeatedly performed the flexural strength test 24 times under the conditions of a strain rate of 10−3/s and a temperature of −1 to −16°C. The flexural strength Sf (MPa) was temperature dependent, as shown in the equation below (Veitch and Daley, 2000):
Jang et al. (1997) proposed a crushable ice model of spherical icebergs when they conducted an iceberg collision simulation for ice-class shuttle tankers. This model has the form of a sphere and a rigid shell element with an external surface covered with a crushable solid element that has constant thickness. The material properties of icebergs assigned to the crushable solid element were as follows: elastic modulus of 9.5 GPa, Poisson’s ratio of 0.3, yield strength of 10 MPa, hardening modulus of 95 MPa, and maximum plastic strain of 0.01. These elements were also adopted in an ice collision analysis by Suh et al. (2008) for a membrane tank-type LNG carrier. They adopted the nominal ice crushing strength of the winter season of 4‒5 MPa (Meilaelander-Larsen and Hysing, 2006).
Korzhavin (1971, 2002) presented a summary of the material properties of river ice in the USSR region for the period up to the 1950s. The data includes the values of the stress-strain curve, elastic modulus, shear modulus, and ultimate strength. The elastic modulus of river ice was reported to be a maximum of 206 MPa under bending conditions, a maximum of 491 MPa under expansion conditions, and a maximum of 824 MPa under compression conditions. The shear modulus measured under a torsion load was a maximum of 177 MPa.
Timco and Weeks (2010) examined engineering characteristics of sea ice through an extensive investigation. They found that the material properties of sea ice are affected by the degree of salt content (that is, salinity and porosity related to the formation and growth of ice). In addition, they reported that the properties of sea ice vary according to the formation period or whether it is first-year or multi-year sea ice. Among the properties of sea ice, salinity depends on the thickness of ice, and porosity depends on salinity and temperature. For example, the average salinity (Si) of first-year sea ice can be determined by the empirical equation below:
Timco and Weeks (2010) reported that first-year sea ice had a density of 920 kg/m3 and multi-year sea ice showed a density of 910–915 kg/m3. In addition, it was found that the tensile strength of first-year sea ice is 0.2‒0.8 MPa in the direction horizontal to the sea ice sheet, which increases up to 2 MPa when a load is applied in the direction parallel to the growth direction of columnar sea ice. The flexural strength of first-year ice decreases as porosity increases, and the maximum value is about 1.5 MPa, but collected data revealed that flexural strength at a medium level of porosity was 0.3‒0.8 MPa. Generally, compressive strength is greatly affected by the loading strain rate, and the compressive strength of first-year sea ice ranges from 0.4 to 5 MPa.
The borehole jack test is widely used to measure ice strength in situ. A borehole jack is lowered into a hole from the surface of ice, and an ice core sample with a diameter of 15–20 cm is collected from the ice sheet. Borehole ice strength refers to the degree of resistance of ice in this process, and this method has a great advantage in that there is no need to remove the ice sample from the ice sheet. The mid-winter ice strength value of first-year sea ice is generally 25‒30 MPa, and since the value varies significantly depending on the temperature, the ice strength level in July is about 10% of the mid-winter ice strength level.
Timco and Weeks (2010) reported that first-year sea ice has an elastic modulus in the range of 7‒10 GPa, and the elastic modulus of multi-year sea ice was shown to be 5% lower. Generally, the average value of Poisson’s ratio is 0.295±0.009, but it may vary depending on the stress rate, and the maximum value of Poisson’s ratio was 0.48 at 0.01 MPa/s. In addition, they argued that in the calculation of short-term bearing capacity (50 kPa/s), an effective Poisson’s ratio of 0.42 is more appropriate than the dynamic value of 0.33. However, they reported that it changes to 0.25 in painted steel and 0.45 in corroded steel, and they pointed out that there is still a considerable lack of understanding of Poisson’s ratio, as in the case of friction, which was found to range from 0.2 to 0.6.
Jia et al. (2009) used sea ice material data provided by the Safe Ice project. According to the data, sea ice has a yield stress of 35 MPa, elastic modulus of 7 GPa, Poisson’s ratio of 0.34, and density of 920 kg/m3. In addition, Høyland et al. (2020) described ice characteristics that changed from those in the first edition of ISO 19906 (the international standard related to ice action on polar offshore structures) in the second edition (ISO, 2019). These include physical properties of ice such as temperature, salinity, porosity, density, and coefficient of friction, as well as mechanical properties, such as the elastic modulus and Poisson’s ratio.
3.5 Ice Extents
Fig. 15 shows three limits of floating ice in the Grand Banks region of eastern Canada. First, the dotted line in Fig. 15 indicates the sea ice limit in April based on statistical data from the period of 1979–2013. The dashed line represents the sea ice limit of the region for the early 20th century, which was also applied in 1912 when the Titanic accident occurred. Finally, the solid line represents the limit connecting the areas where icebergs appeared during the total period of the 20th century. In Fig. 15, the region marked as 48°N latitude represents an area in the vicinity of the city of St. John’s, and the bold “x” symbol represents the spot where the Titanic collided with an iceberg. The shades of blue indicate different ocean depths, and the lightest blue regions represent continental shelves with a water depth of 1,000 m or less (Bigg and Billings, 2014).
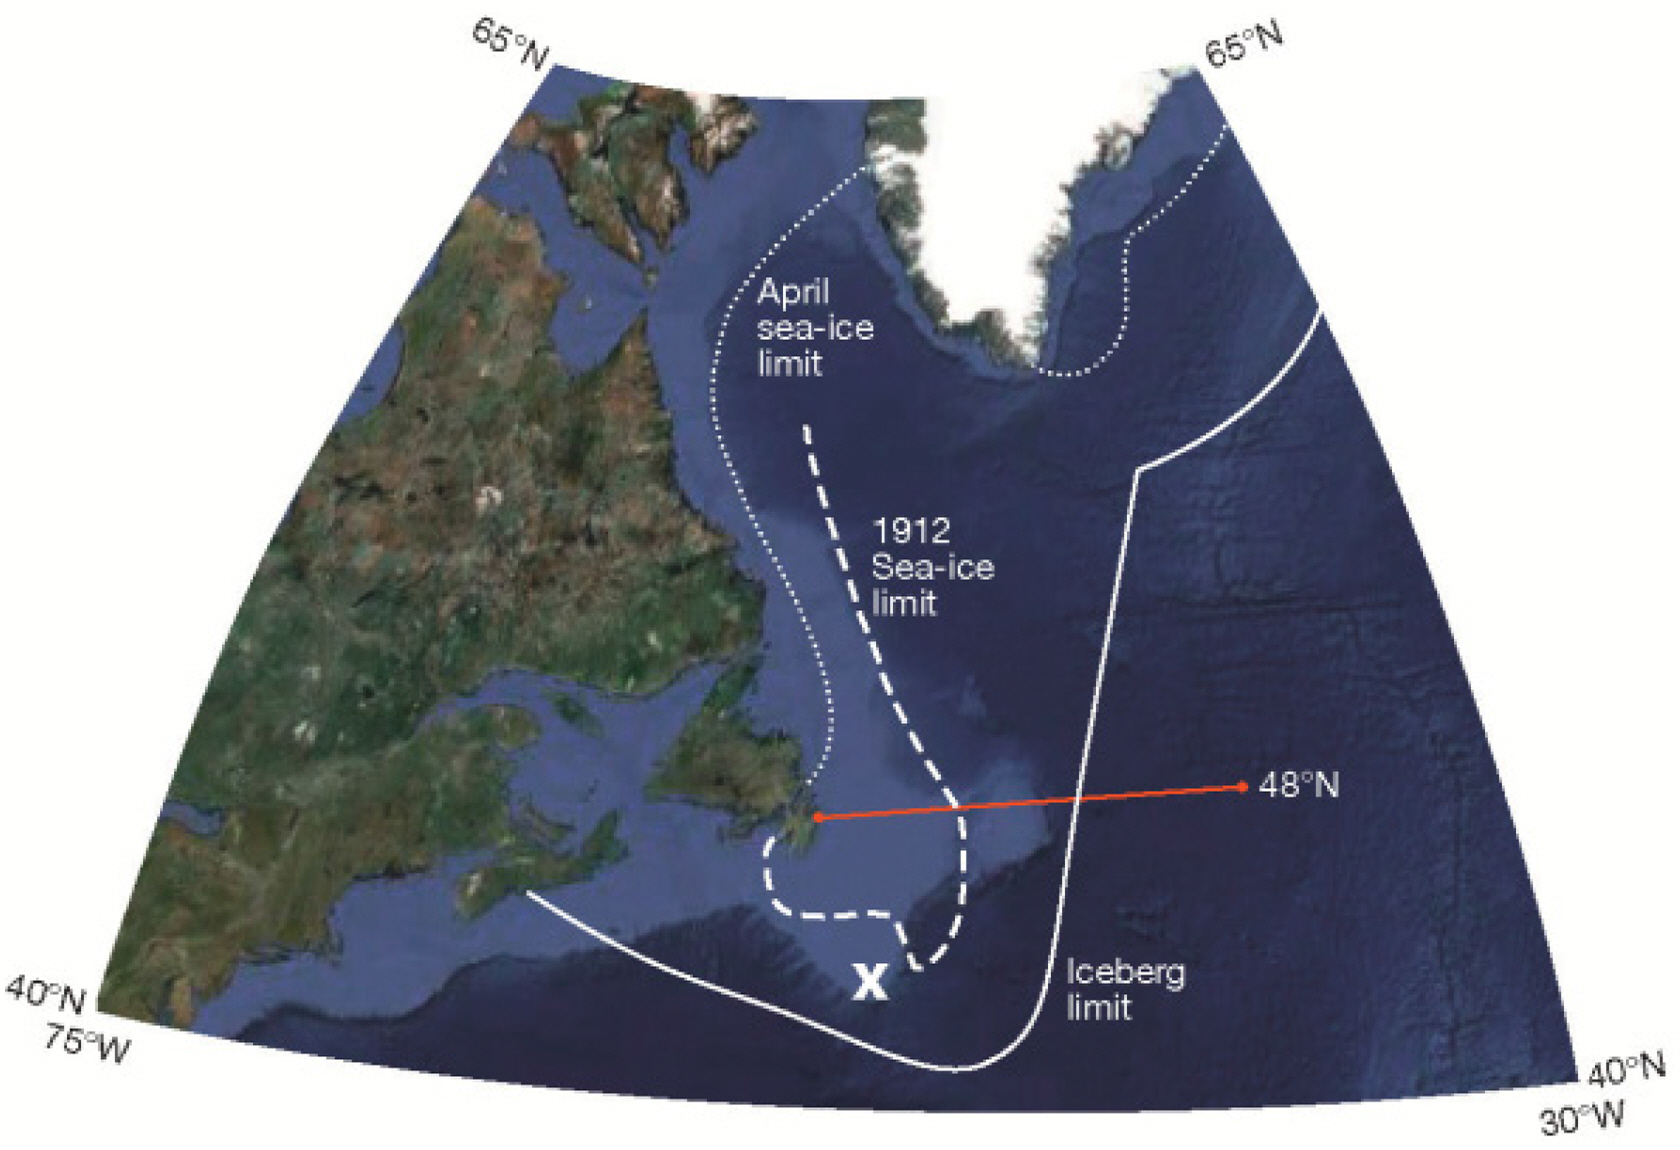
The average sea-ice limit for April 1979‒2013 (dotted line), a typical Newfoundland maximum sea-ice limit for early 20th century (dashed line and denoted as 1912), and the maximum iceberg limit for 1900‒2000 (Bigg and Billings, 2014).
1,038 icebergs were observed at 48°N latitude in 1912 when the Titanic sank following a collision with an iceberg. This number corresponds to 90% of the average number of observed icebergs per year during the past 112-year period since 1900. In 112 years of observations, there were 14 cases in which the 90% value was exceeded and the number of detected icebergs has risen since the mid-1970s. In 2009, 1,200 icebergs were detected. The iceberg that sank the Titanic was reported to be a relatively large one. Based on survivors’ reports and general characteristics of icebergs, the iceberg is estimated to have a depth of 90-185 m and a length of 125 m. The mass of the iceberg was eventually estimated to be about 2 million tonnes (Bigg and Billings, 2014), and thus, it would have had a very large impact.
In addition, the International Ice Patrol (IIP) creates iceberg charts that represent the analysis of the status of icebergs in the region on the first and 15th days of each month, as shown in Fig. 16. These charts show the number of icebergs discovered by dividing the sea area into grid cells and present the limits of icebergs and sea ice.

Semi-monthly iceberg charts by IIP (USCG, 2020)
4. Activities for Prevention of Iceberg Collisions
Currently, ice hazard warning services in the Northwestern Atlantic region are provided by the IIP, some commercial companies, and ice and weather forecast service agencies. The IIP was established in 1914 to watch icebergs in the Atlantic and Arctic Oceans and report their movements for safety. It is operated by the United States Coast Guard (USCG) with the financial support of 13 countries related to transatlantic sailing, including Canada, the United Kingdom, and France (USCG, 2020). This organization provides data by combining sightings, satellite imagery, and radar surveillance and iceberg trajectory models (Bigg and Billings, 2014). It has contributed to a dramatic reduction in the number of ship-iceberg collisions since 1913.
The IIP has collected data on sea-ice extents and iceberg locations to provide ships in the waters around the Grand Banks of Newfoundland with ice navigation hazard warnings. In earlier days, reports from ships around the region and dedicated cruises were used for observation, and in the mid-20th century, aircraft patrol was mainly used for observation. Recently, satellite image analysis and iceberg modeling were introduced for observation.
Since 2013, the number of icebergs discovered on the transatlantic sea routes was lowest in the 2020 ice year (October 2019 to September 2020) according to a recent report of the IIP (USCG, 2020). The number of icebergs that drifted into the routes of ships in the 2020 ice year was 169, which is the second-lowest number after 13 ships in 2013. These figures are based on 48°N latitude in the waters near Newfoundland, Canada.
Fig. 17 shows the changes in the number of icebergs that moved south below 48°N latitude in the region. The average number of icebergs per year was 498 for the period of 1900 to 2019 and 795 for the period of 1983 to the present day. As shown in Fig. 17, the number of icebergs discovered in 2019 was as much as 1,515. The IIP distinctively refers to the period from 1983 to the present day as the modern reconnaissance era and presents statistics by classifying icebergs detected by other sources such as satellites and aircraft.
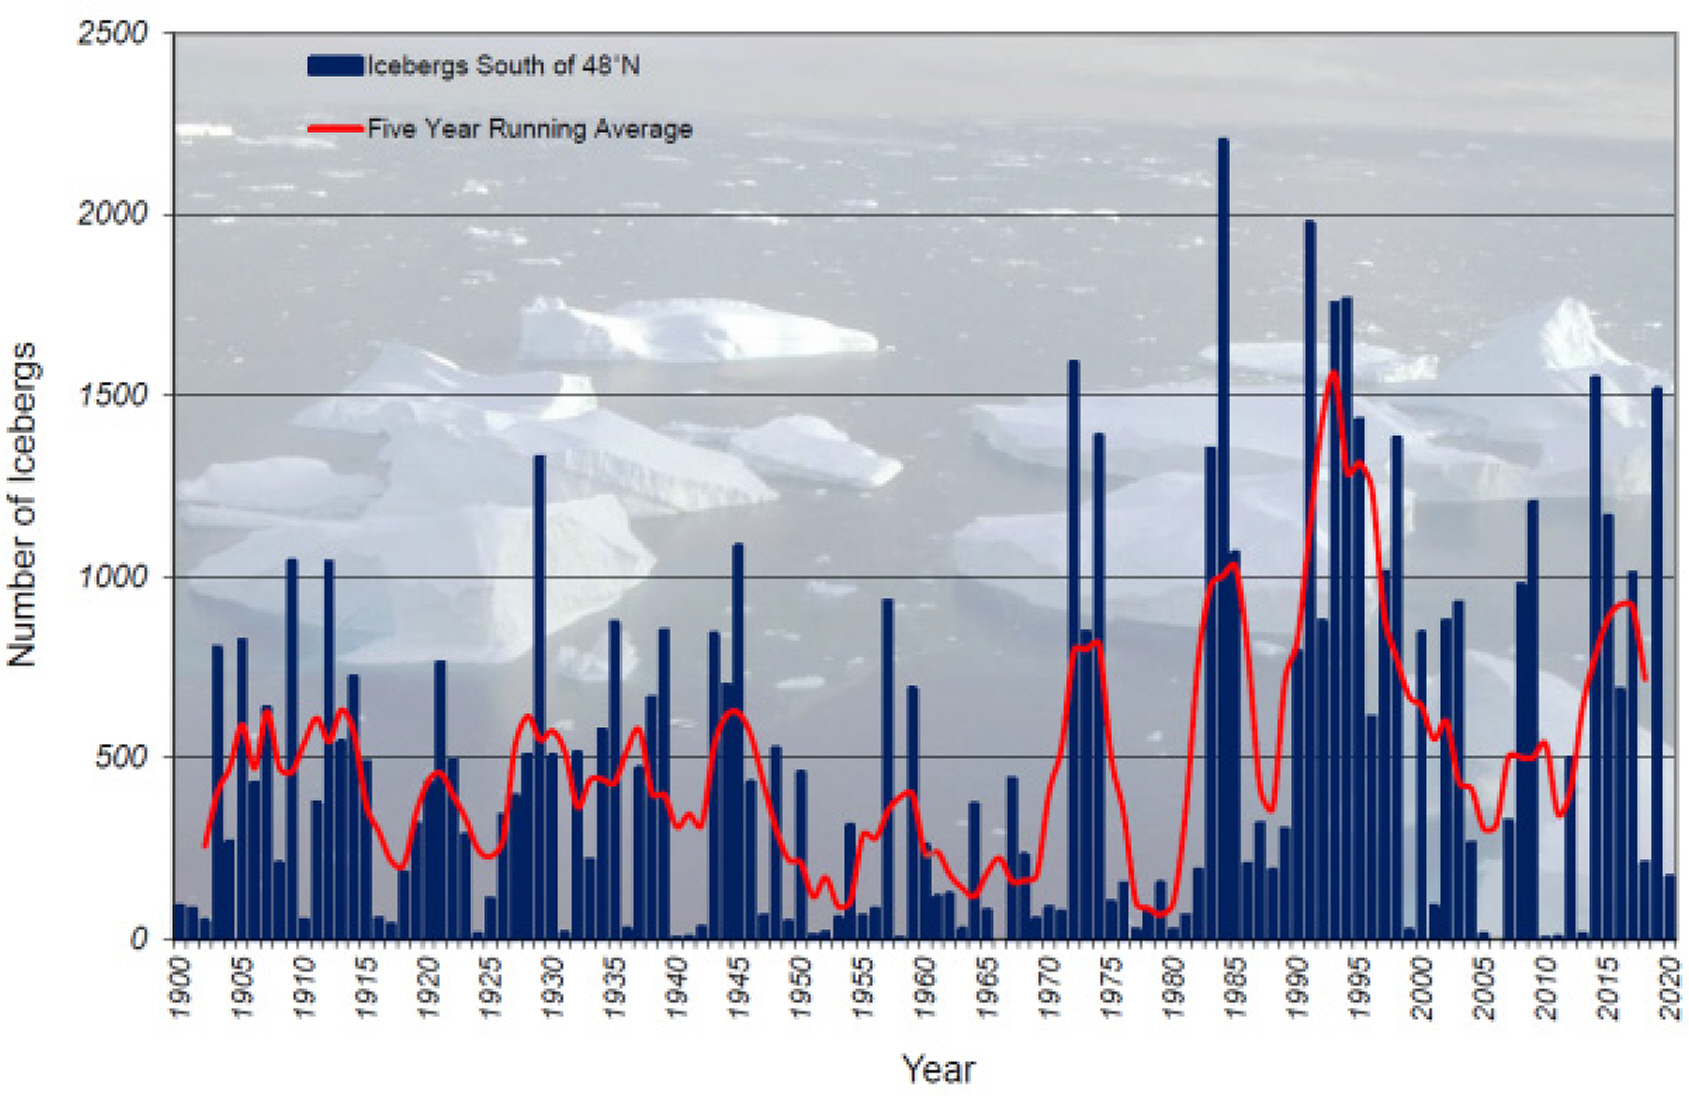
Icebergs crossing 48°N by year (blue bars) and five-year running average for 1900‒2019 (red line) (USCG, 2020)
Fig. 18 shows a bar graph representing the monthly number of icebergs moving south below 48°N latitude in the 2020 ice year. Out of the total of 169 icebergs, the highest proportion of them (76 icebergs) was discovered in May, and 98.8% appeared between March and June. The red solid line represents the average monthly number of icebergs for 120 years from 1900 to the present day, and the green solid line represents the value for the modern reconnaissance era since 1983. The average monthly number of icebergs discovered in the 2020 ice year was significantly lower than the average numbers for the two periods.
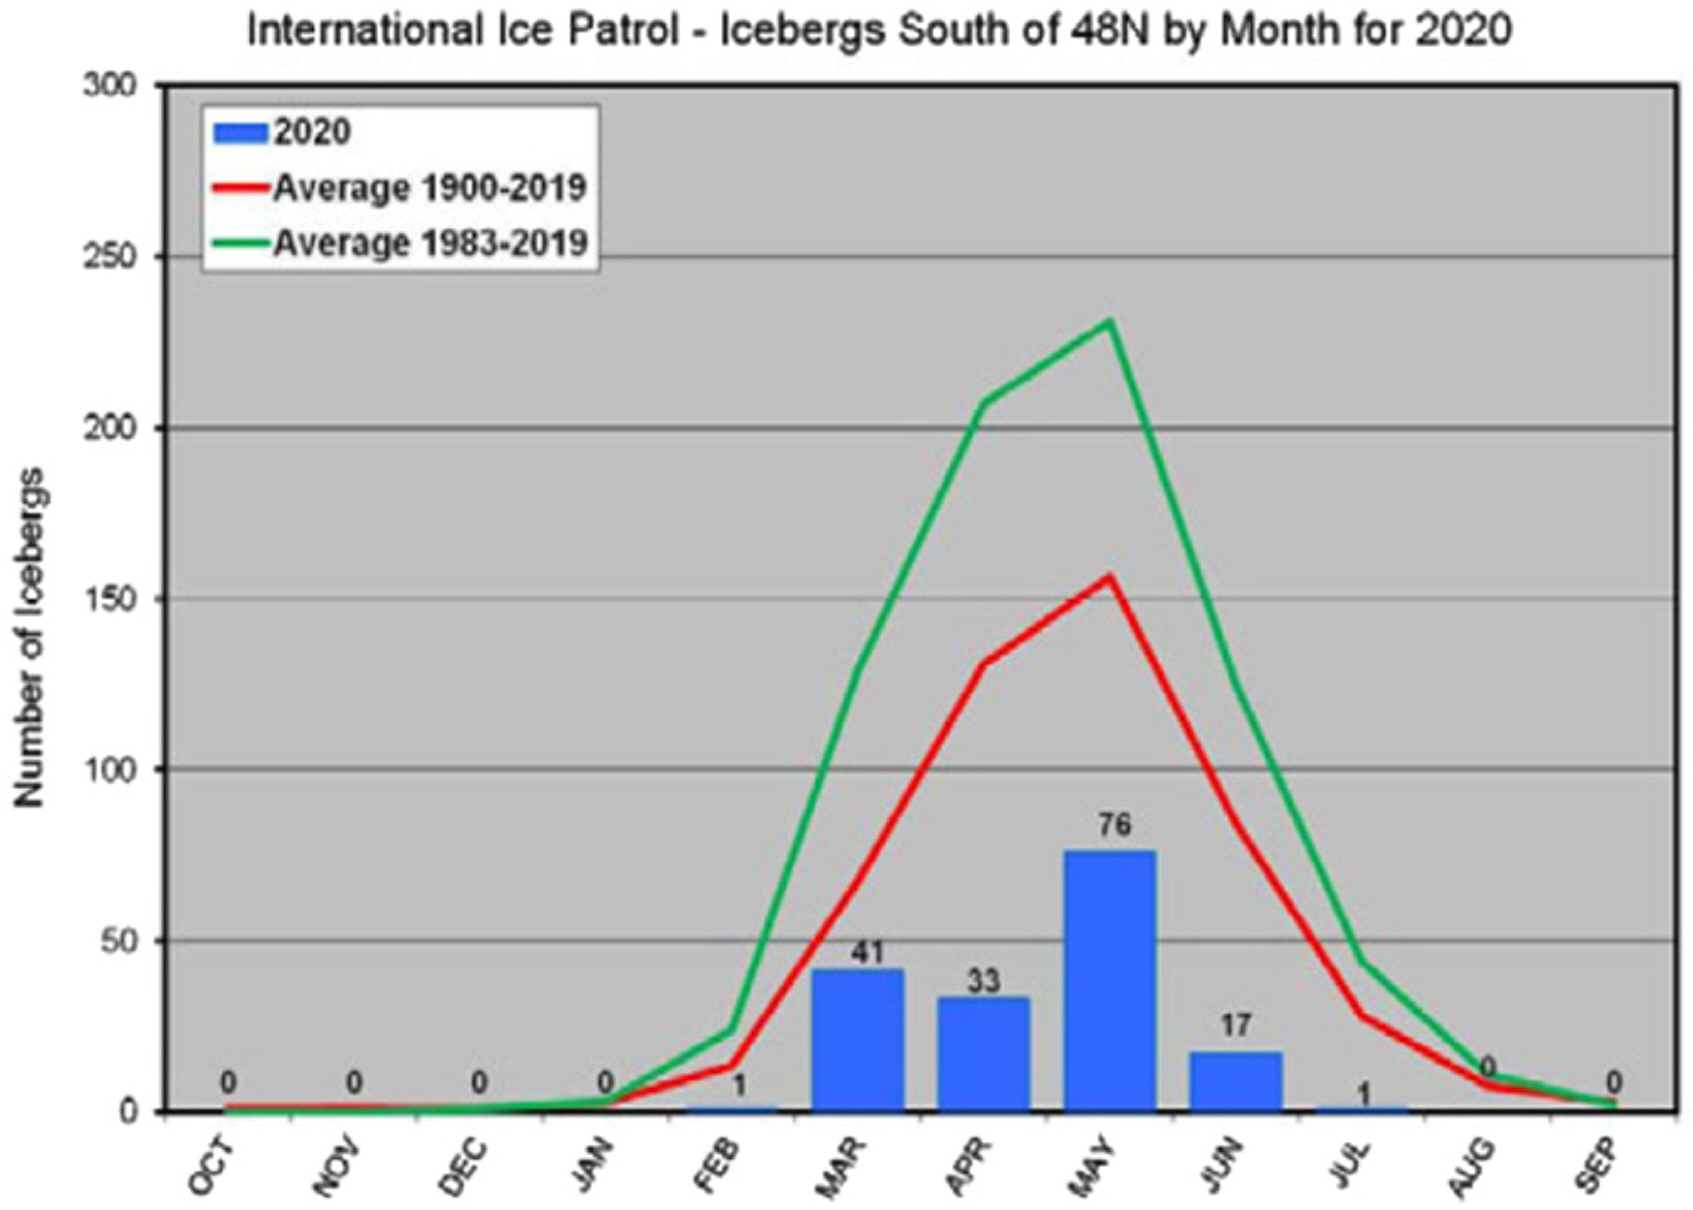
Icebergs south of 48°N by month for 2020 (USCG, 2020)
The U.S. National Ice Center is also using satellites to track large icebergs found near Antarctica. In addition, the Canadian Ice Service also provides information on ice sheets in the waters around Canada. In recent years, efforts have been continuously made to achieve highly accurate detection of even small icebergs using the image data from synthetic aperture radar (SAR), which allows us to obtain high-resolution images of extensive regions regardless of weather conditions or the time of day or night (Frost et al., 2016; Choi, 2018; Barbat et al., 2019; Soldal et al., 2019; Bailey et al., 2021).
5. Summary and Conclusions
It has been more than 100 years since the Titanic sank with the loss of over 1,500 lives, but the danger of ship-iceberg collisions is still present. Technological advances that allow more accurate detection of icebergs, such as marine radar, satellite image analysis, and aircraft patrol, have made the North Atlantic safer, but an average of 15,000 icebergs are formed each year. 2% of them move down to the area where the Titanic sank, and ships still continue to operate in the vicinity of the area (Sosnowski, 2012). Bergy bits and growlers, which refer to small icebergs, are difficult to detect by radar or satellites, so they are highly likely to present hazards for the operation of ships.
In this study, statistical data on ship-iceberg collision accidents were reviewed, and it was found that an average of three accidents occur per year, even in recent years. Additionally, in relation to such accidents, the characteristics of icebergs generated when chunks of ice break off from land-based glaciers were examined through a review of previous studies. Specifically, the size, shape, and mass of icebergs were included in the analysis. Also, properties related to ice strength were examined, such as density, elastic modulus, and Poisson’s ratio, and the tensile strength and bending strength were also investigated. Finally, overall activities to prevent accidents related to ship-iceberg collisions were described, such as the investigation of ice extents and collection and analysis of data on the generation, distribution, and movement of icebergs.
According to NASA, an average of 402 gigatonnes of mountain glaciers and ice caps disappear every year, and Professor Wadhams at Cambridge University stated that in the past 10 years, the downhill flow rate of glaciers in Greenland has doubled over the past decade. A number of icebergs are being generated, resulting in more icebergs floating in the sea than in 1912, when the accident of the Titanic occurred (Sosnowski, 2012). In this situation, ship-iceberg collision accidents are likely to occur at any time. In particular, it should be noted that despite cutting-edge technologies and continued patrol efforts, it is still possible for ships to sustain heavy damage due to a collision or contact with small icebergs that are difficult to detect, such as bergy bits and growlers.