Mechanism Development and Heading Control of Catamaran-type Sail Drone
Article information

Abstract
The need for energy harvesting in marine environments is gradually increasing owing to the energy limitation of marine robots. To address this problem, a catamaran-type sail drone (CSD), which can harvest marine energies such as wind and solar, was proposed in a previous study. However, it was designed and manufactured without considering the stability, optimal hull-form, and maintenance. To resolve these problems, a CSD with two keels, a performance estimator, V-shape hulls, and modularized components is proposed and its mechanism is developed in this study. To verify the performance of the CSD, the performance estimation using smoothed-particle hydrodynamics (SPH) and the heading control using fuzzy logic controller (FLC) are performed. Simulation results show the attitude stability of the CSD and the experimental results show the straight path of the CSD according to wind conditions. Therefore, the CSD has potential applications as an energy harvesting system.
1. Introduction
In recent years, the interest in oceans has been increasing due to the Fourth Industrial Revolution for Oceans, wind power, offshore photovoltaic power plants, and Antarctic and Arctic exploration bases. Accordingly, interest in the importance of maritime domain awareness (MDA) has also been increasing (Kim et al., 2016).
Research on marine robots for efficient mission performance in oceans has increased with the increasing interest in MDA (Yeu et al., 2019, Park et al., 2021). In the case of autonomous marine robots, there is a problem of energy insufficiency because of the size limitation. The energy insufficiency leads to severe problems, such as loss or damage of the robots caused by the lack of energy when the robots are conducting highly difficult missions and the activity radius is limited (Park et al., 2019).
To solve this problem, diverse studies have been conducted on marine-energy harvesting-based robots such as wave gliders and underwater gliders in South Korea and abroad. Among them, sailing-type robots, which have strengths in terms of speed and duration, stand out (Meinig et al., 2015).
A sail drone, a sailing-type robot, is a system that is propelled by wind and is heavily affected by wind direction and speed. Hence, it has a disadvantage that the straight path movement is not excellent because of the cross-flow forces produced by wind (Sa et al., 2019).
To solve this problem, research was conducted in South Korea on a type of sail drone, to which a keel, a cross-flow force prevention device, was attached; however, the manufacturing and maintenance costs were high because the attitude stability and modularization for maintenance and repair were not considered in the design and manufacturing process (Man et al., 2020). Furthermore, they did not consider suitable sailing control techniques for the sail drone.
In this study, therefore, we developed a performance estimation tool that can ensure attitude stability using previously produced 3D design results and the smoothed-particle hydrodynamics (SPH) method, thereby securing attitude stability in the design process. Furthermore, we considered a V-model of the bow for speed improvement and modularization for robot maintenance and repair.
We considered the shape of the catamaran-type sail drone (CSD) to increase the attitude stability and considered a hybrid propulsion method, in which the sail is used as the main propulsion method and an electric propeller is used as the auxiliary propulsion method.
Recently, studies have used neural network (NN) methods (Fang et al., 2017) and deep learning (Sun and Gao, 2020) for the heading control of marine robots. However, owing to the complexity of sailing techniques, marine robots need expert systems that operate based on expert knowledge and are sensitive to wind direction and speed, thus requiring more robust controllers.
Therefore, this study proposes a fuzzy logic controller (FLC), which has more robust control characteristics and is easy to reflect an expert system.
Section 2 presents information related to the development of the mechanism of the CSD, and Section 3 presents the performance estimation tool created to secure the attitude stability in the design process. Section 4 describes the FLC for the heading control of the CSD. Section 5 discusses the experiments and results for the validation of the developed CSD mechanism and the proposed controller’s performance, and Section 6 summarizes the conclusions.
2. Development of CSD Mechanism
The development of the CSD mechanism focuses on facilitating wind propulsion using the sails—the main propulsion method—and the attachment of solar panels. In the future, we plan to construct the system using solar panels for energy supply and the electric thruster as an auxiliary propulsion system while the sails are folded when the CSD enters a no-go zone.
The previously developed CSD ver.1.0 was not modularized and had high manufacturing and maintenance costs. Therefore, we configured the CSD ver.2.0 to facilitate easy disassembly and assembly of each module to increase the efficiency of manufacturing and maintenance. Fig. 1(a) shows the final design result of the CSD ver.2.0, and Fig. 1(b) shows the design considering the modularization, as mentioned earlier.

Mechanism of buoy robot
The keel was modularized to facilitate disassembly and assembly for the keel selection test and maintenance/repair, and the cross-sectional design of the keel was performed using a ship equipment design method.
The newly developed CSD ver.2.0 uses the same sails as the previously developed ver.1.0, but it is configured for better performance (Man, 2021).
Table 1 lists the performance and specifications of the CSD ver.1.0 and 2.0. It can be seen that because the bow of ver.2.0 was designed considering the V-model, the payload increased by approximately 1.4 times, despite the fact that the CSD’s breadth and length decreased. Furthermore, as the size of the body decreased with the same area of the sails, the speed increased by approximately 1.1–1.4 times at a wind speed of 3–5 m/s, which was under the gentle breeze category in the Beaufort wind force scale. Moreover, when propelled by electricity, the speed increased by approximately 1.3 times.
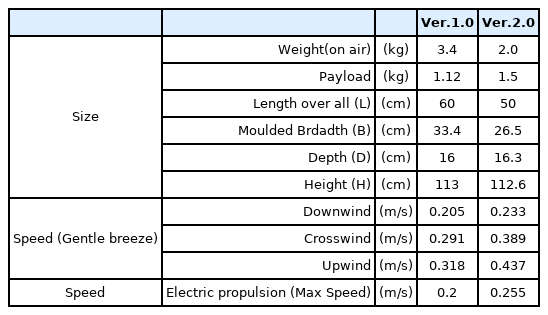
CSD ver.1.0 and 2.0 performance and specifications comparison
Fig. 2 shows the shape of the completed prototype, which was produced as a scale model for the convenience of fabrication and experiments. We used CATIA, a 3D design tool, for modeling, based on which the prototype was fabricated using a 3D printer. The control box and body cover unit were fabricated with acrylic using a laser machine.

Prototype of CSD ver.2.0
It was equipped with an attitude heading reference system (AHRS) for heading control and a weathervane for detecting wind direction. Additionally, it was configured to save data on an SD card and backup data through Bluetooth and on the host PC through wireless communication.
3. Development of Performance Estimation Tool
We developed a performance estimation tool to examine the attitude stability of the CSD before constructing it using the final 3D design data. Various sensors and devices are required to check the attitude stability using the fabricated equipment. However, if the performance estimation tool is used, it is easy to attach and use the sensors, without incurring costs.
The performance estimation tool was created using the SPH method, which allows real-time rendering based on the interaction between each particle of the fluid. Therefore, we developed the performance estimation tool using NVIDIA FleX that implemented the SPH method and using Unreal Engine 4 (UE4), which supported it.
The performance estimation tool developed based on the UE4 should convert the design files into files that can be recognized by the UE4 and receive the model as input. When UE4 receives the final model as an input, the inside of the model is empty, as shown in Fig. 3(a); further, because the final model cannot be recognized as a Flex object, the fluid particles do not interact with the model and pass through it. Therefore, conversion of the model into Flex objects is required, as shown in Fig. 3(b). The Flex objects contained inside and the fluid particles are configured in the same size. Table 2 lists the performance and specifications of the performance estimation tool.
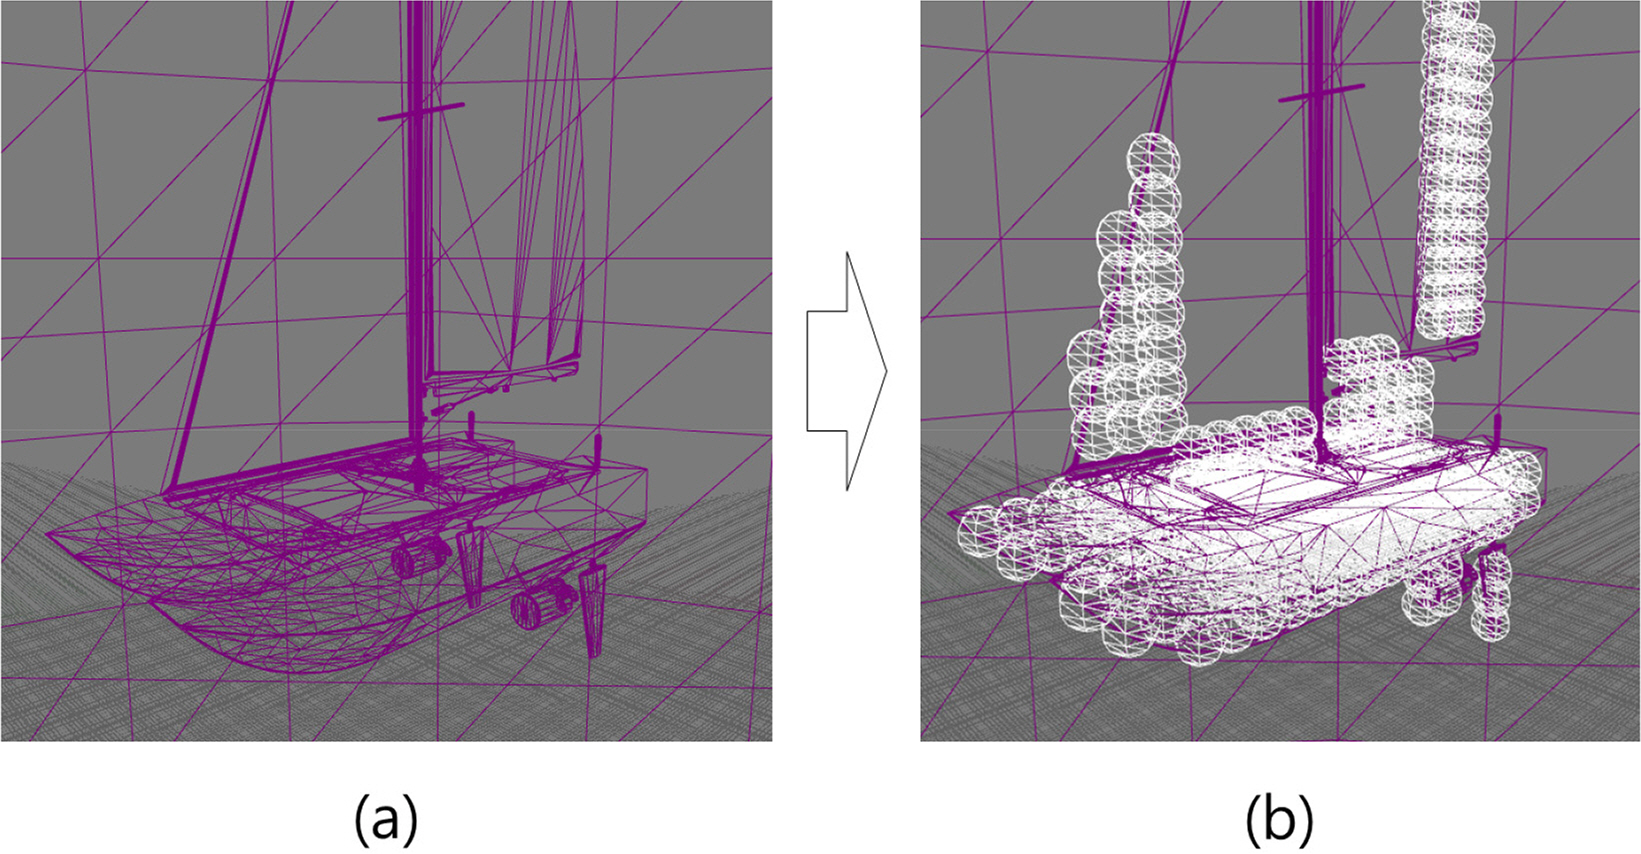
Conversion result of Flex object
Performance and specifications of performance estimation tool
For the performance estimation tool, we chose the water tank size, frames per second (FPS), maximum size and maximum quantity of particles, and life cycle to facilitate real-time rendering. The water tank size reflected the real experimental environment as much as possible. However, if the water tank size, particle size, maximum quantity, or FPS changes, the computation amount increases, causing difficulty in real-time rendering. Therefore, we determined their values through tests to facilitate real-time rendering.
We constructed the experimental water tank in a rectangular shape to examine the movement by allowing the fluid to enter in three directions. Fig. 4 shows an execution screen of the developed performance estimation tool. It provides a total of seven views, including the front, left, right, and top.
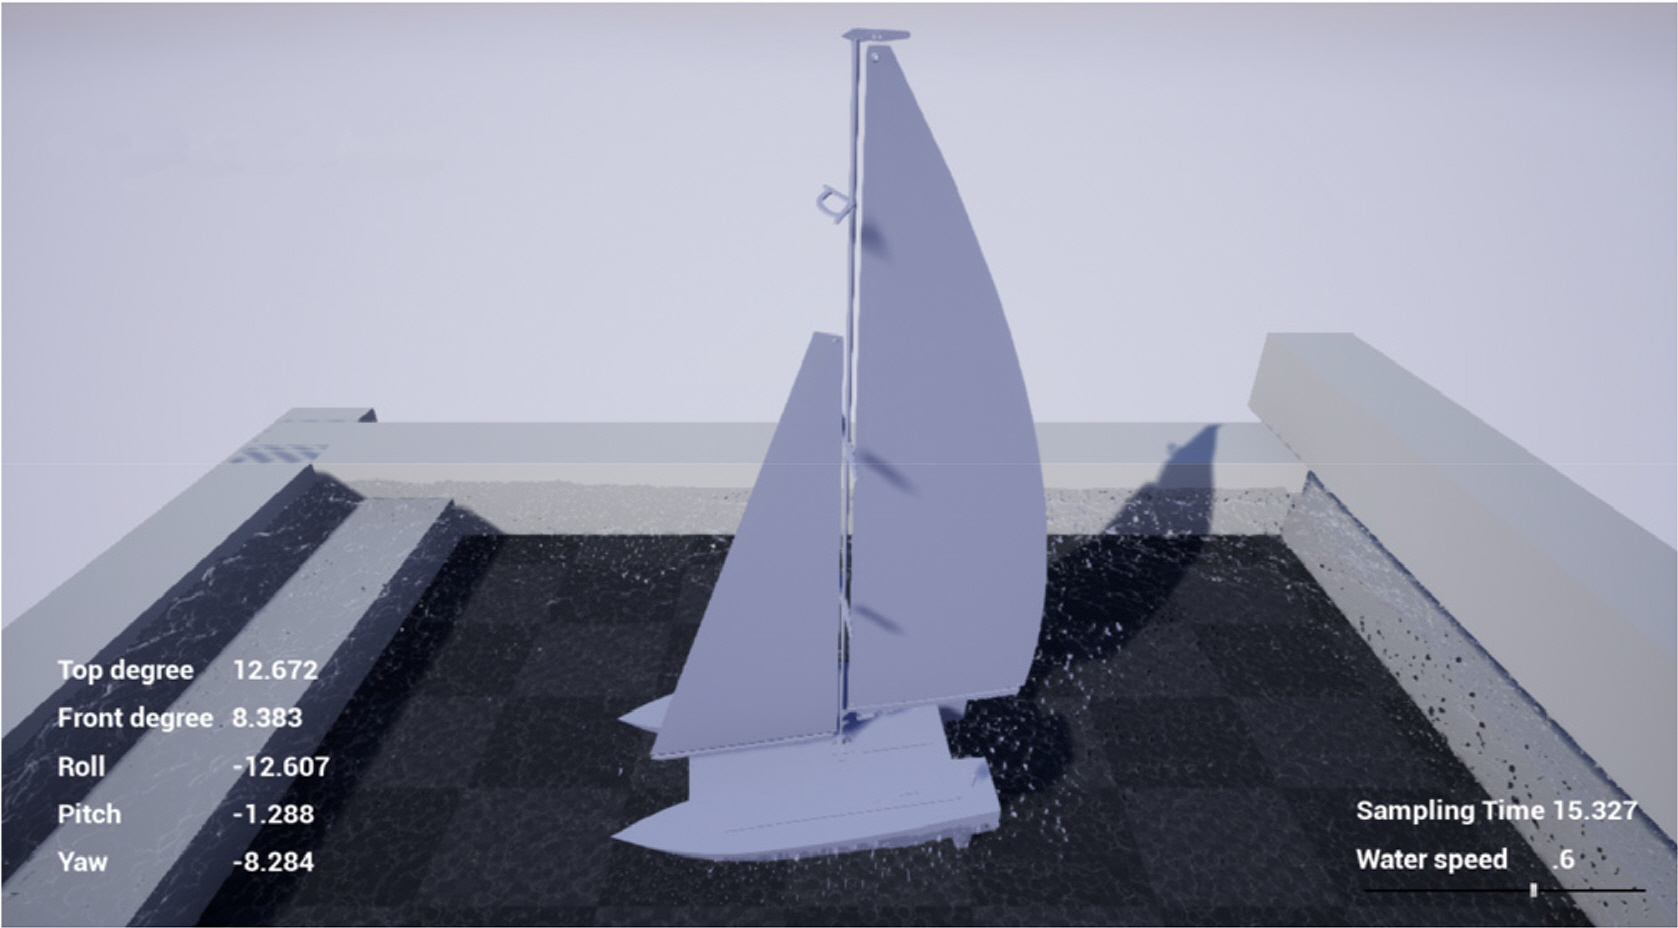
Performance estimation of developed CSD
Fig. 5 shows the algorithm flowchart. The inflow speed of the fluid can be controlled using the mouse wheel, and the flowing direction of the fluid can be controlled using the z, x, and c keys. Furthermore, to check the CSD’s attitude stability using the sensors attached to the CSD, the roll, pitch, and yaw values are output to the screen and a text file.
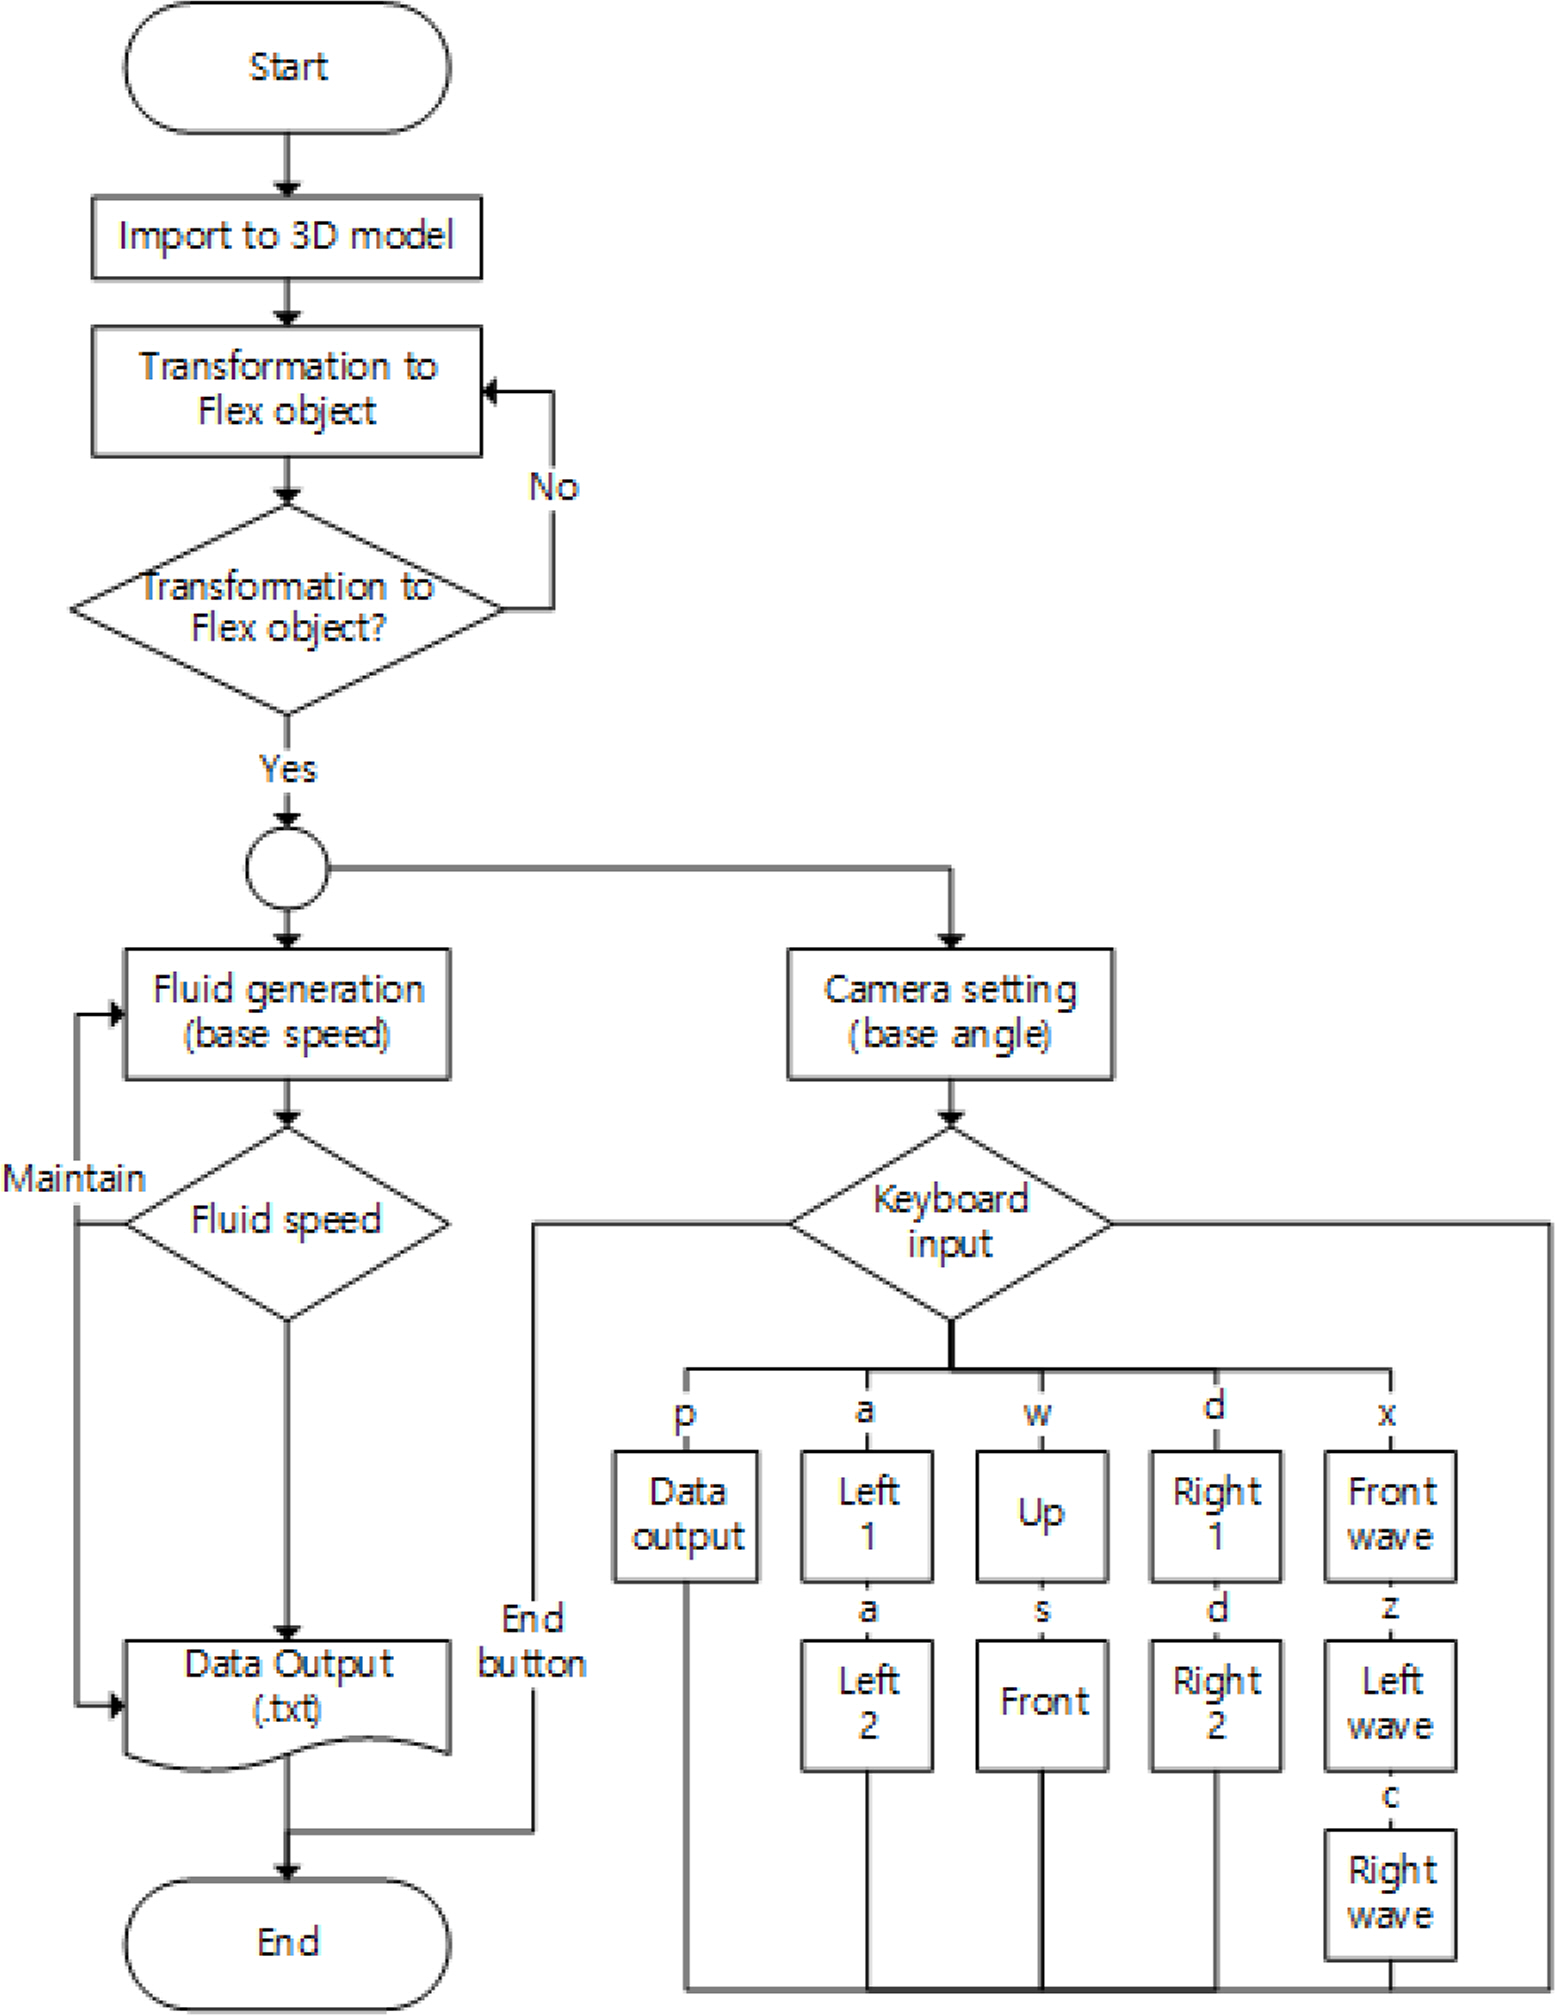
Flowchart of performance estimation algorithm
Figs. 6–8 show the roll, pitch, and yaw values with and without the keel in the CSD ver.2.0, which are results of the performance estimation tool. The solid line represents the case where the keels exist, and the dashed line represents the case where the keels do not exist.

Verification of attitude stability (Roll)

Verification of attitude stability (Pitch)
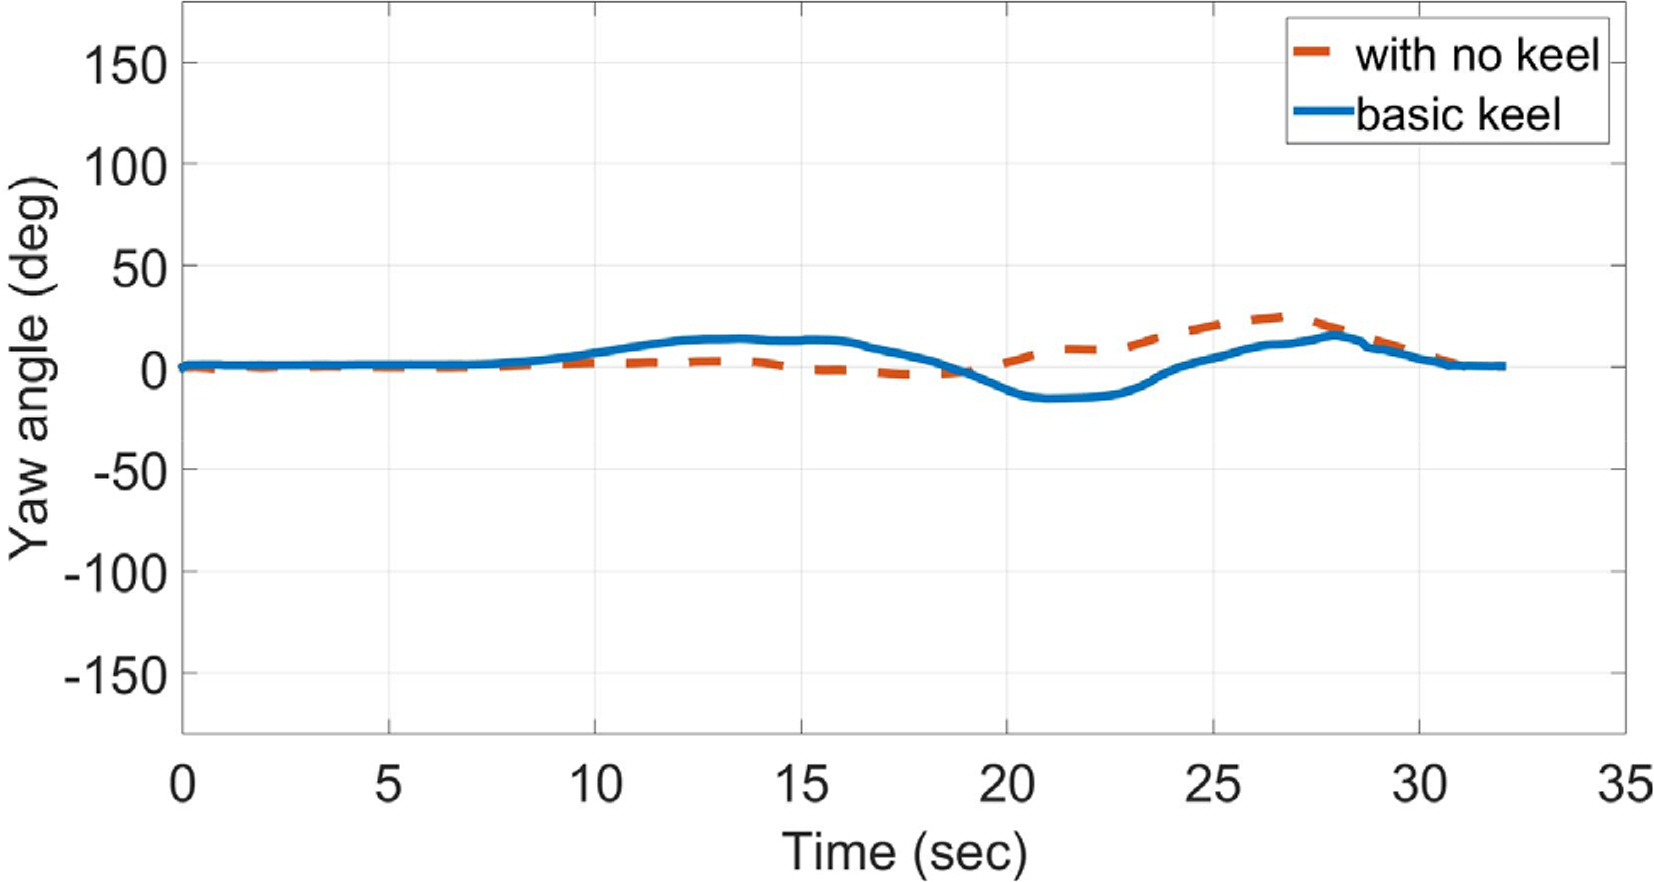
Verification of attitude stability (Yaw)
As shown in Fig. 6, when there was no keel, the roll motion occurred up to approximately −50° as the fluid entered from the side at approximately 10 s. Furthermore, the roll motion occurred up to 10° at 25 s. In contrast, when there were keels, a maximum roll motion of ±10° occurred. This shows that keels result in better performance in terms of roll damping.
In Fig. 7, a similar performance of a maximum of approximately ±10° is shown regardless of whether the keels exist or not; it is confirmed that keels do not have a significant impact on the pitch motion.
As shown in Fig. 8, when there are keels, there is a movement of approximately 10° at 12 and 20 s, and the maximum movement is approximately 15°. When there are no keels, the maximum movement is approximately 10°. It is determined that as the keels at the bow collide with the particles first, there is more movement.
The performance estimation tool shows that the keels are helpful in terms of roll damping, through which the attitude stability can be secured.
4. Design of Heading Control Part
Sailing yachts cannot go straight through no-go zones, where the wind blows from the proceeding direction. They have to use a technique such as tacking to proceed in a zig-zag manner. Furthermore, because the speed and direction change as the angle of attack, at which the wind is met, changes according to the degree of spreading the sails, the degree of spreading the sails should be based on expert knowledge. Therefore, this paper proposes a simplified method, a hybrid technique in which the consequent comes out as a constant.
For the proposed control parts, we considered two parts: the heading control part and sail angle control part. In the heading control part, the part of the helm angle is considered using the heading value of the AHRS, whereas in the sail angle control part, the spreading angle of the sails is controlled using the heading value of the AHRS.
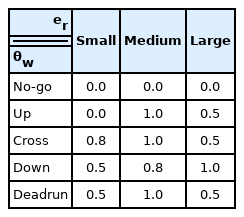
The fuzzy rule of the proposed heading control part is configured using the heading value error er and its differential ėr, as presented in Table 3. The fuzzy rule is configured with NB (negative big), NS (negative small), Z0 (zero), PS (positive small), and PB (positive big), and it has a simple and basic format.

Definition of fuzzy rule (Heading)
Fig. 9 shows the control surface that represents the fuzzy input and output relationship regarding the proposed fuzzy rule. For the membership function of the fuzzy input part, which uses the heading value error and error change rate as input values, we used a Gaussian form, as shown in Fig. 10.
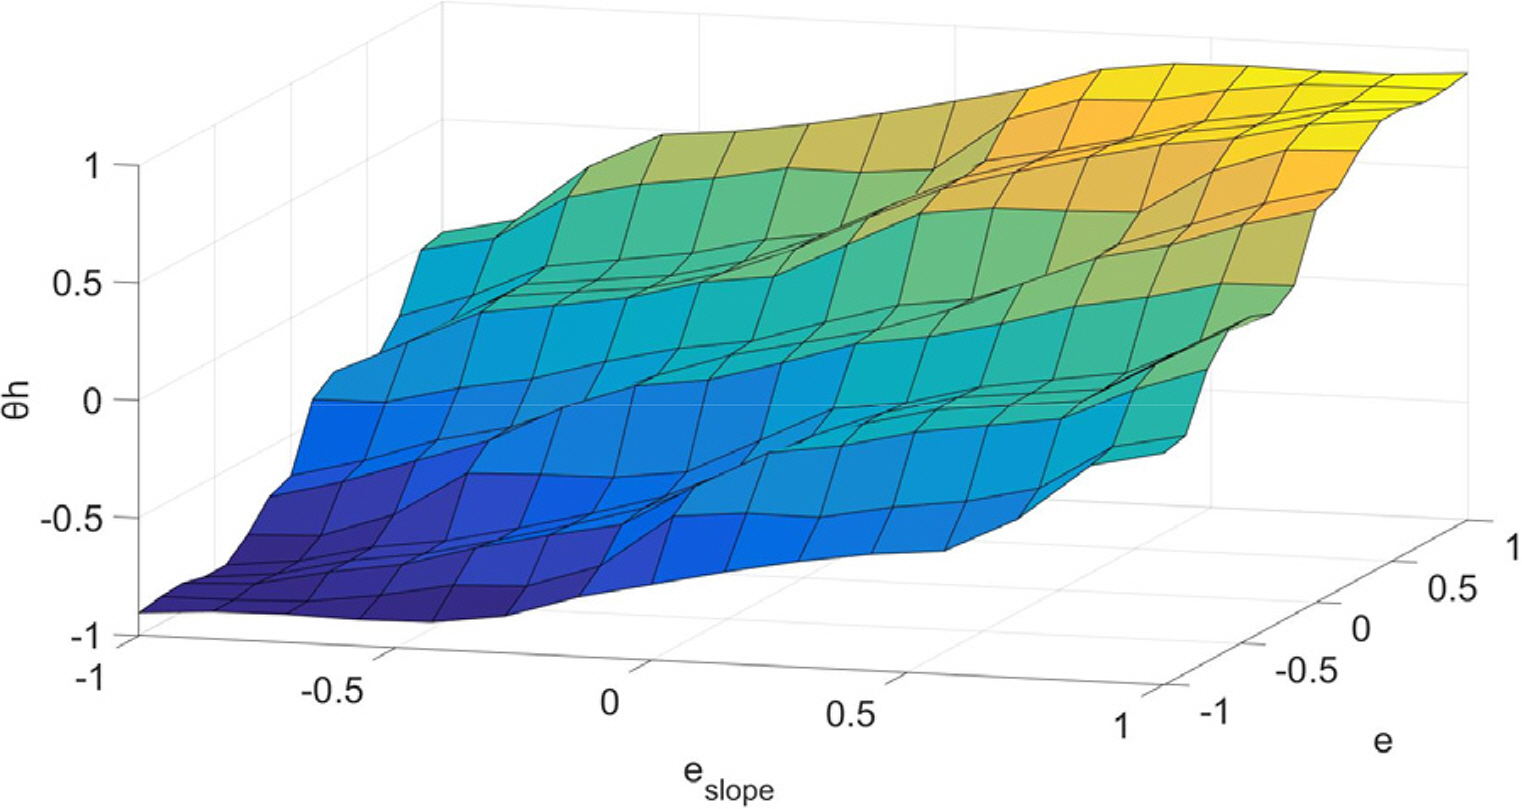
Control surface of proposed FLC (Heading)
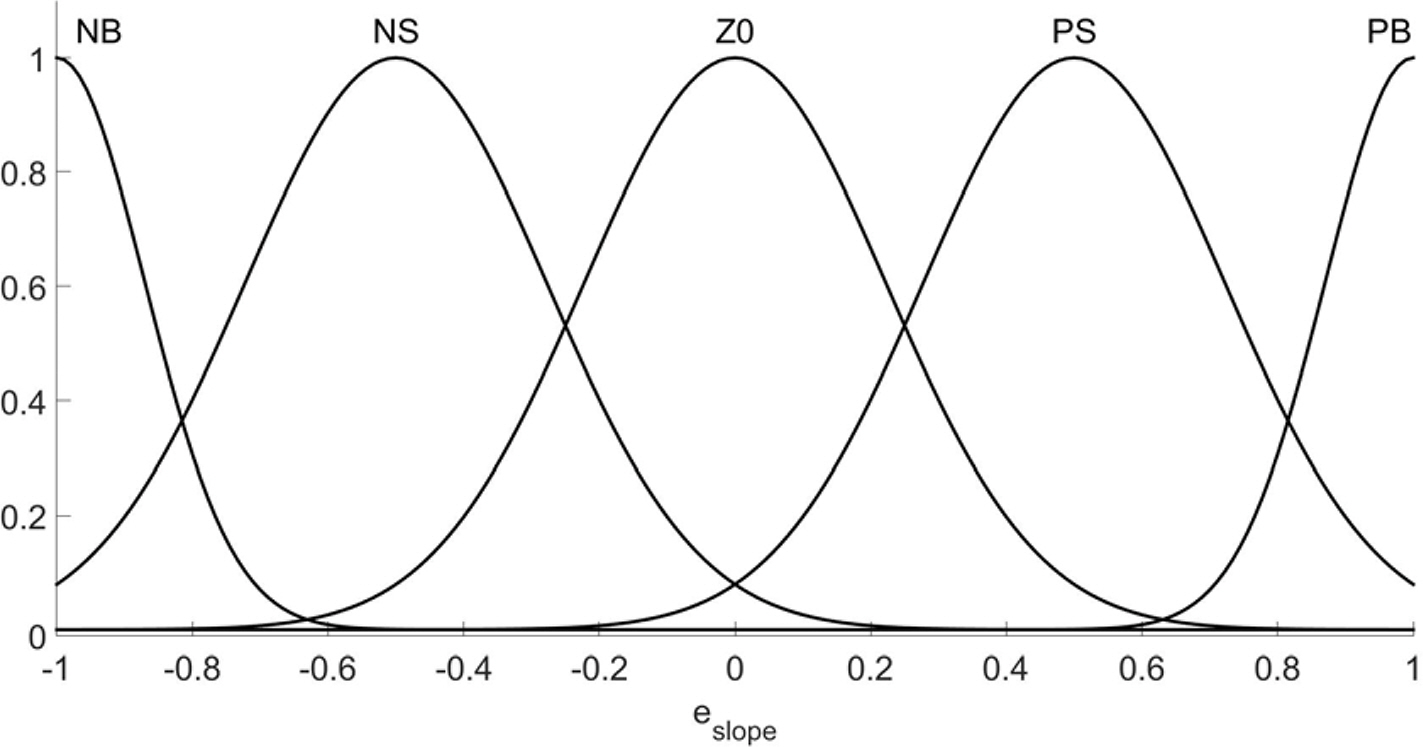
Membership function of proposed FLC (Heading)
The fuzzy rule of the proposed sail angle control part is configured using the measured wind direction angle θw and the heading value error er, as illustrated in Table 4. The fuzzy rule divides er into small, medium, and large by size. The wind direction is defined for five cases with the no-go zone as the baseline: No-go; Up, which is a case of wind blowing from the front in the straight-ahead direction; Cross, which is a case of crosswind; Down, which is a case of wind blowing from the back; and deadrun, which is a case of wind blowing from a rear direction of ±170° relative to the straight-ahead direction. In other words, we configured them based on the criteria used by experts in common sailing methods.
Proposed fuzzy rule (Sail angle)
Fig. 11 shows the control surface that represents the fuzzy input and output relationship regarding the proposed fuzzy rule. For the membership function of the fuzzy input part, which uses the heading value error and wind direction as input values, we used a Gaussian form, as shown in Fig. 12.

Control surface of proposed FLC (Sail angle)

Membership function of proposed FLC (Sail angle)
The non-fuzzification of the proposed FLC for the heading control uses a center of gravity method, as shown in Eq. (1). Here, F denotes the output value based on the center of gravity method, N is the number of fuzzy rules, Wi denotes the membership value for the i-th output variable, and ci denotes the i-th output set single value.
Fig. 13 shows the control block diagram of the proposed FLC. The upper part comprises the heading control part, whereas the lower part comprises the sail angle control part. Because the sails are pushed by the cross-flow force, we used the heading value error to configure the heading and sail angle control parts. Based on the above process, we completed the design of the algorithm that uses FLC for heading control.
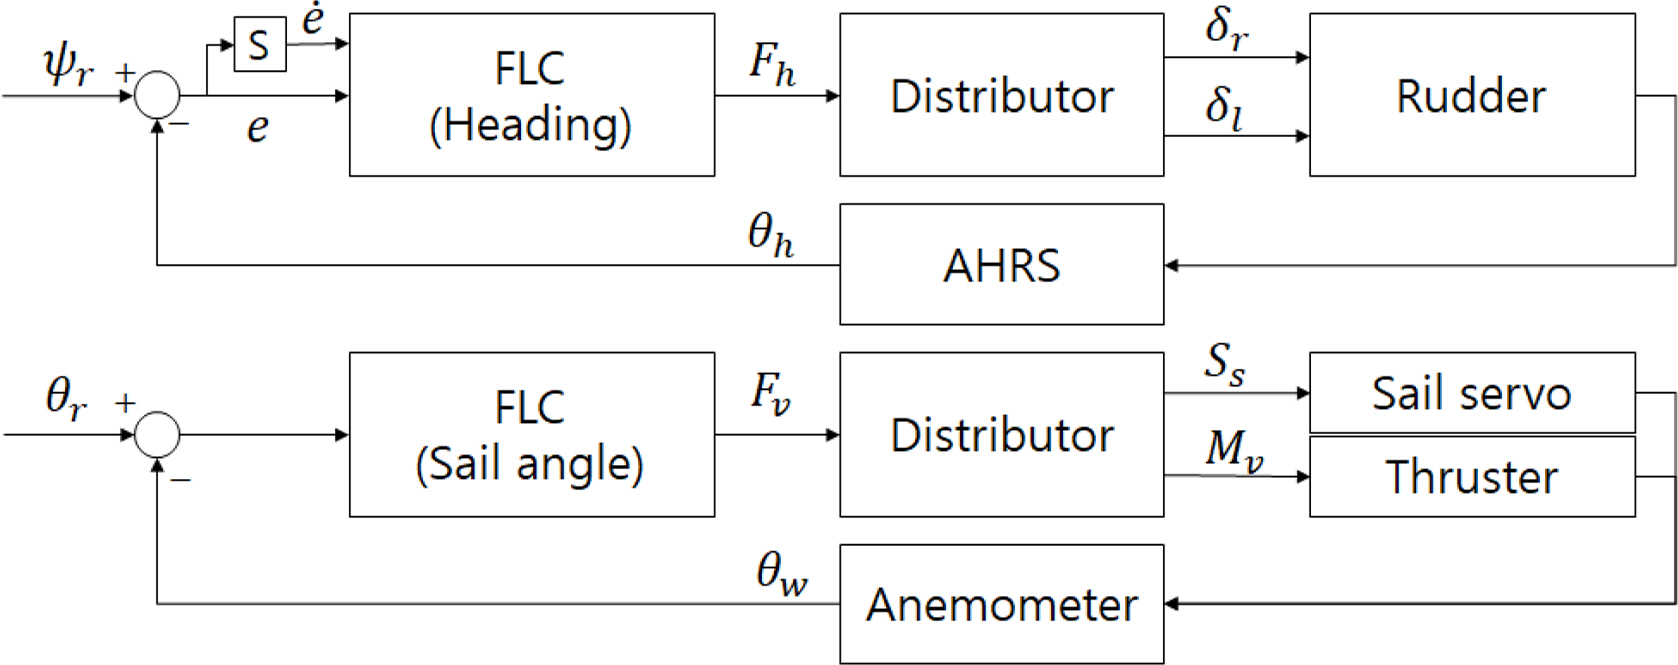
Block diagram of proposed FLC
5. Experiments and Discussion
For the performance evaluation of the constructed CSD and proposed controllers, we compared the FLC and P controller that controls the helm angle using the heading value error. The experimental environment was set up as shown in Fig. 14.
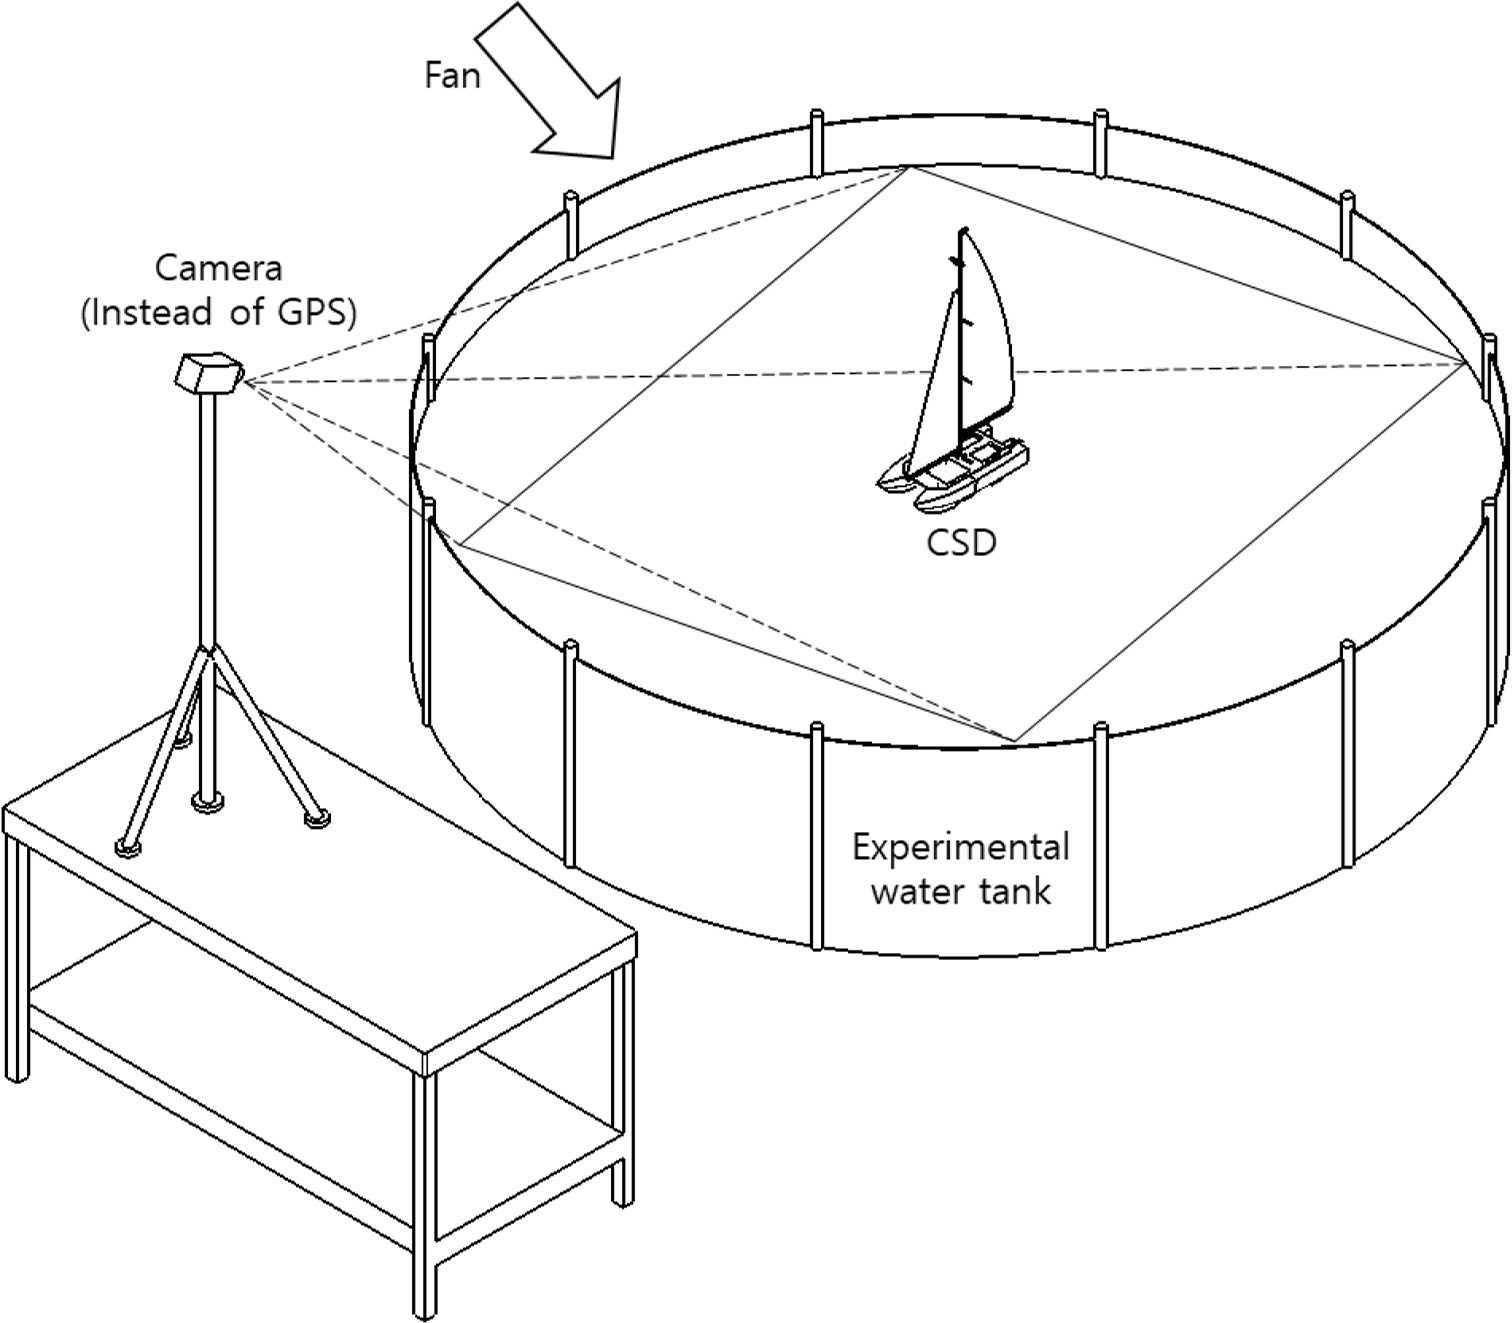
Experimental enviroment
An experimental water tank constructed with a size of 3.66 m and a depth of approximately 1 m was used indoors, and a camera was used as a substitute for the GPS. The images were corrected by a perspective transform, and according to the measurement results after the image processing, 1 pixel corresponded to approximately 1 cm. Furthermore, image processing for obtaining the location information of the CSD was implemented to distinguish and track the red color using RGB for convenience of use. Furthermore, the system was configured to output the coordinate data and processed images to files.
Table 5 presents a brief overview of the test and evaluation scenarios. Here, based on the Beaufort wind force scale and the results of measuring the wind speed using a weathervane 2 m away, the wind speeds were classified into gentle breeze (a wind speed of 3‒5 m/s) and fresh breeze (8‒10 m/s). Furthermore, the wind direction was classified into Upwind (wind blowing at approximately 50° from the front based on the proceeding direction of the CSD), Crosswind (wind blowing at 90° from the side), and Downwind (wind blowing at 130° from the rear side.

Scenario for Test and Evaluation
In all the experimental results, the solid line represents a case using the FLC, and the dashed line represents a case not using it. The desired target point in the image coordinates is (0, 165).
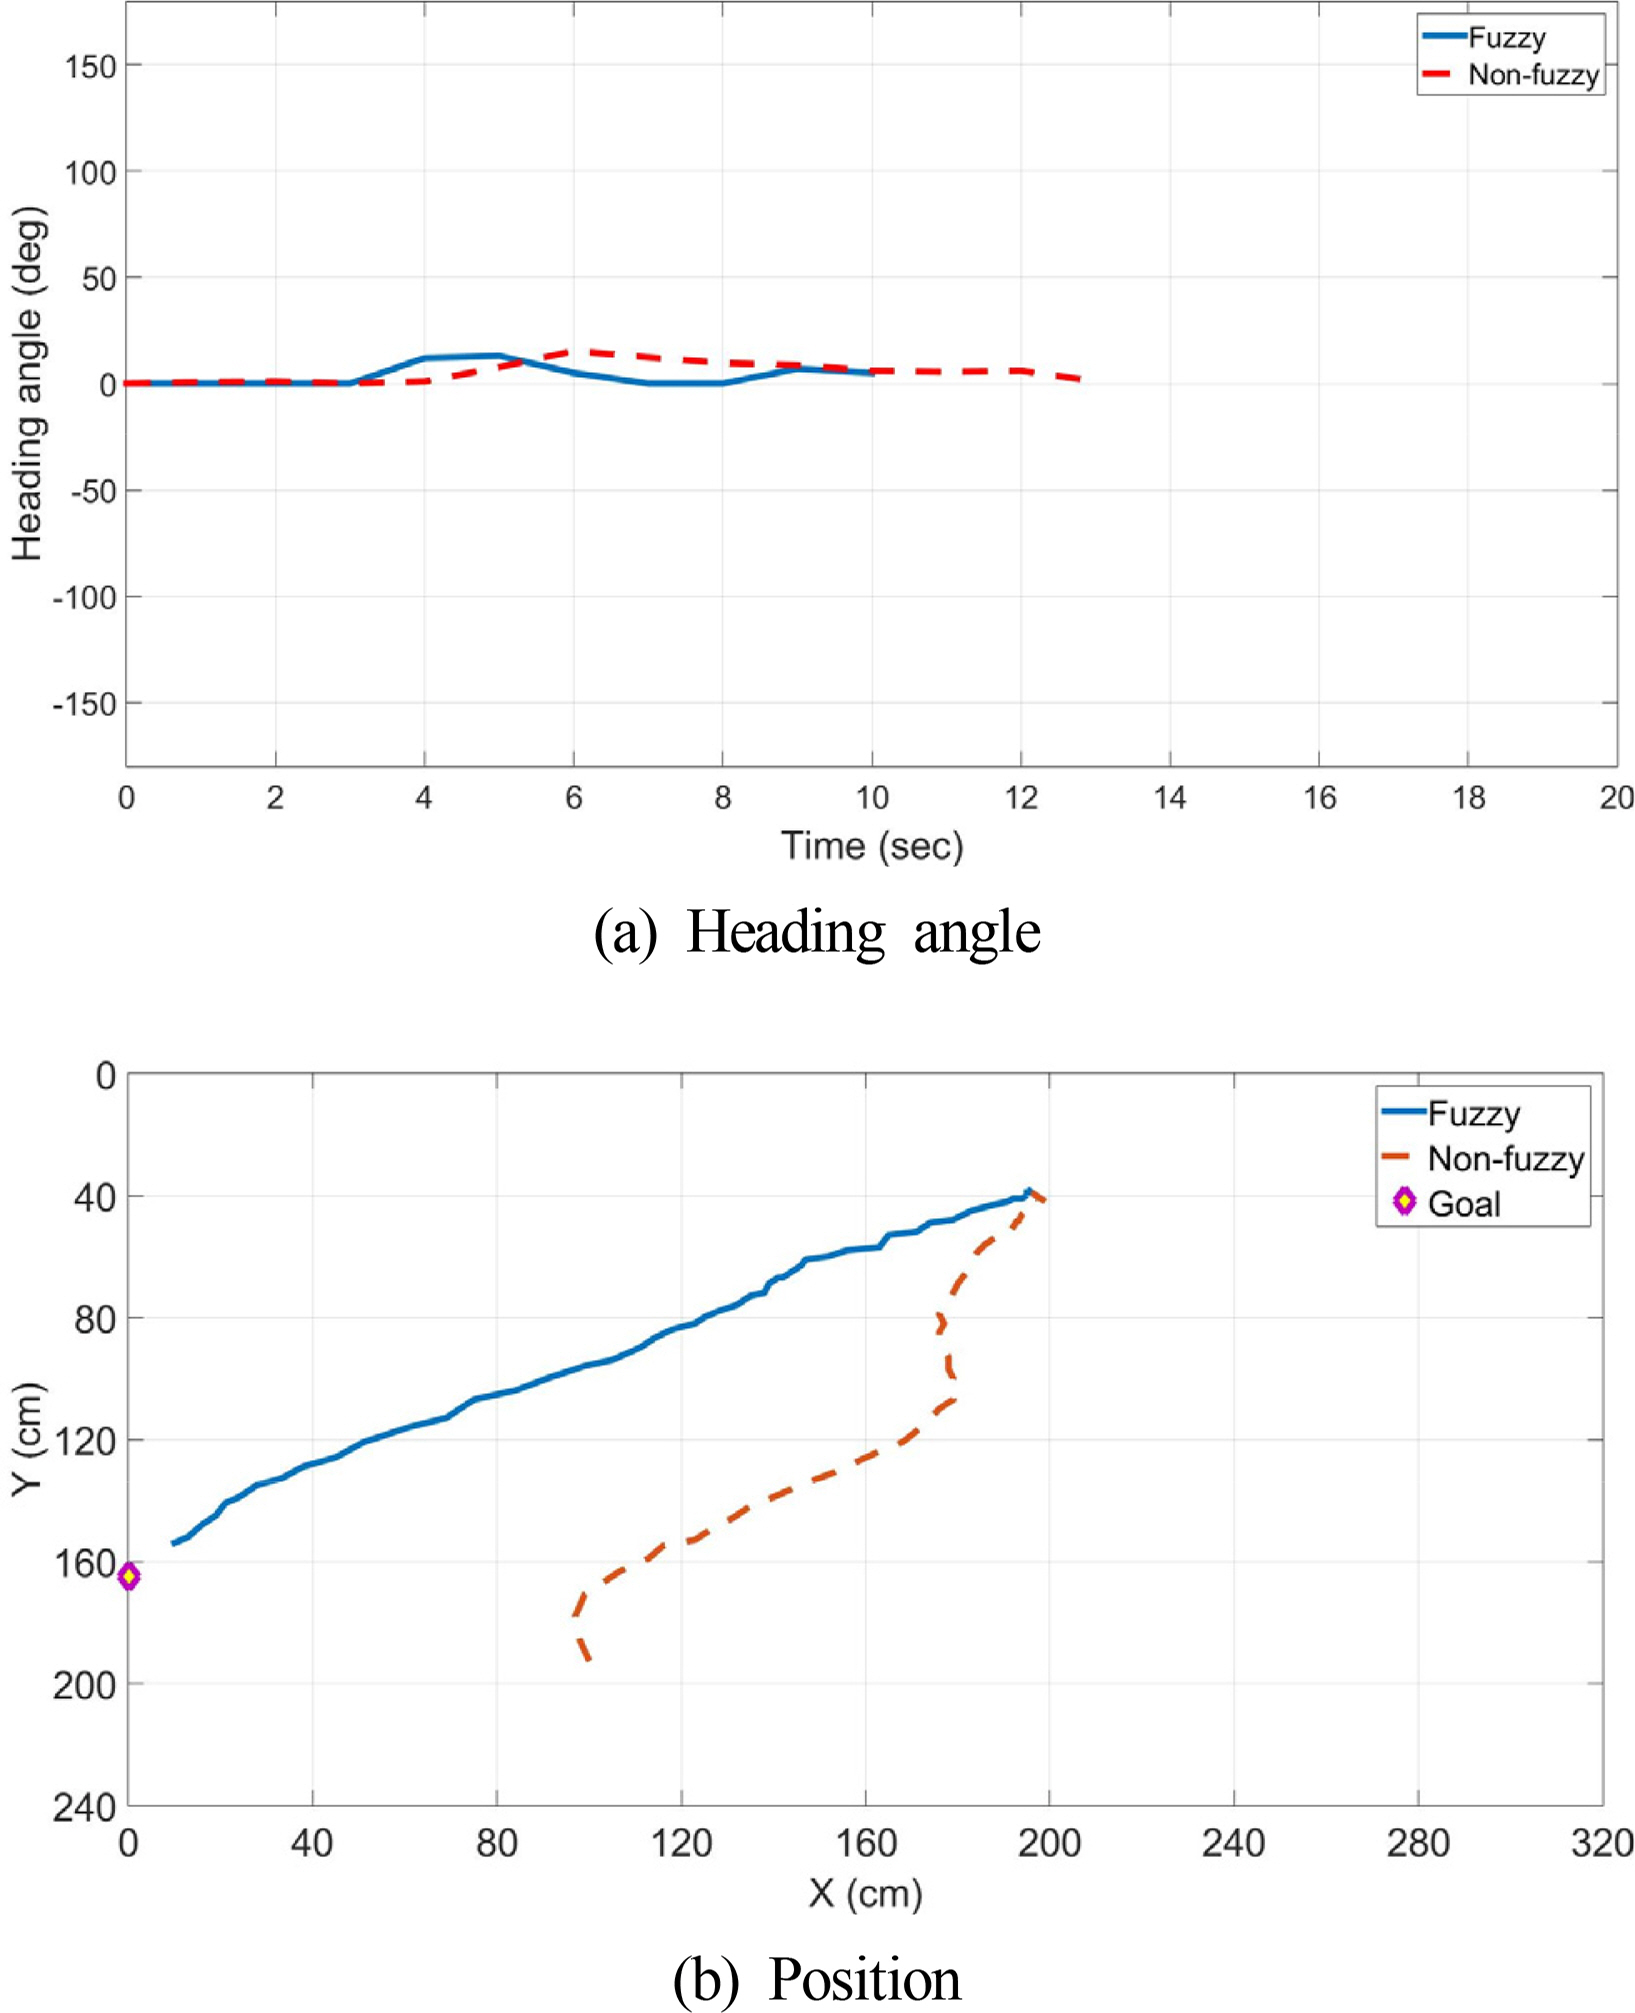
Fig. 15 shows the D-G case. In (a), the heading value graph, the maximum error is 20° identically. In the case of the dashed line, it can be seen that the direction is continuously maintained in a trajectory that has been pushed away once. The solid line shows that the direction is maintained by veering at 4 s and 8 s.
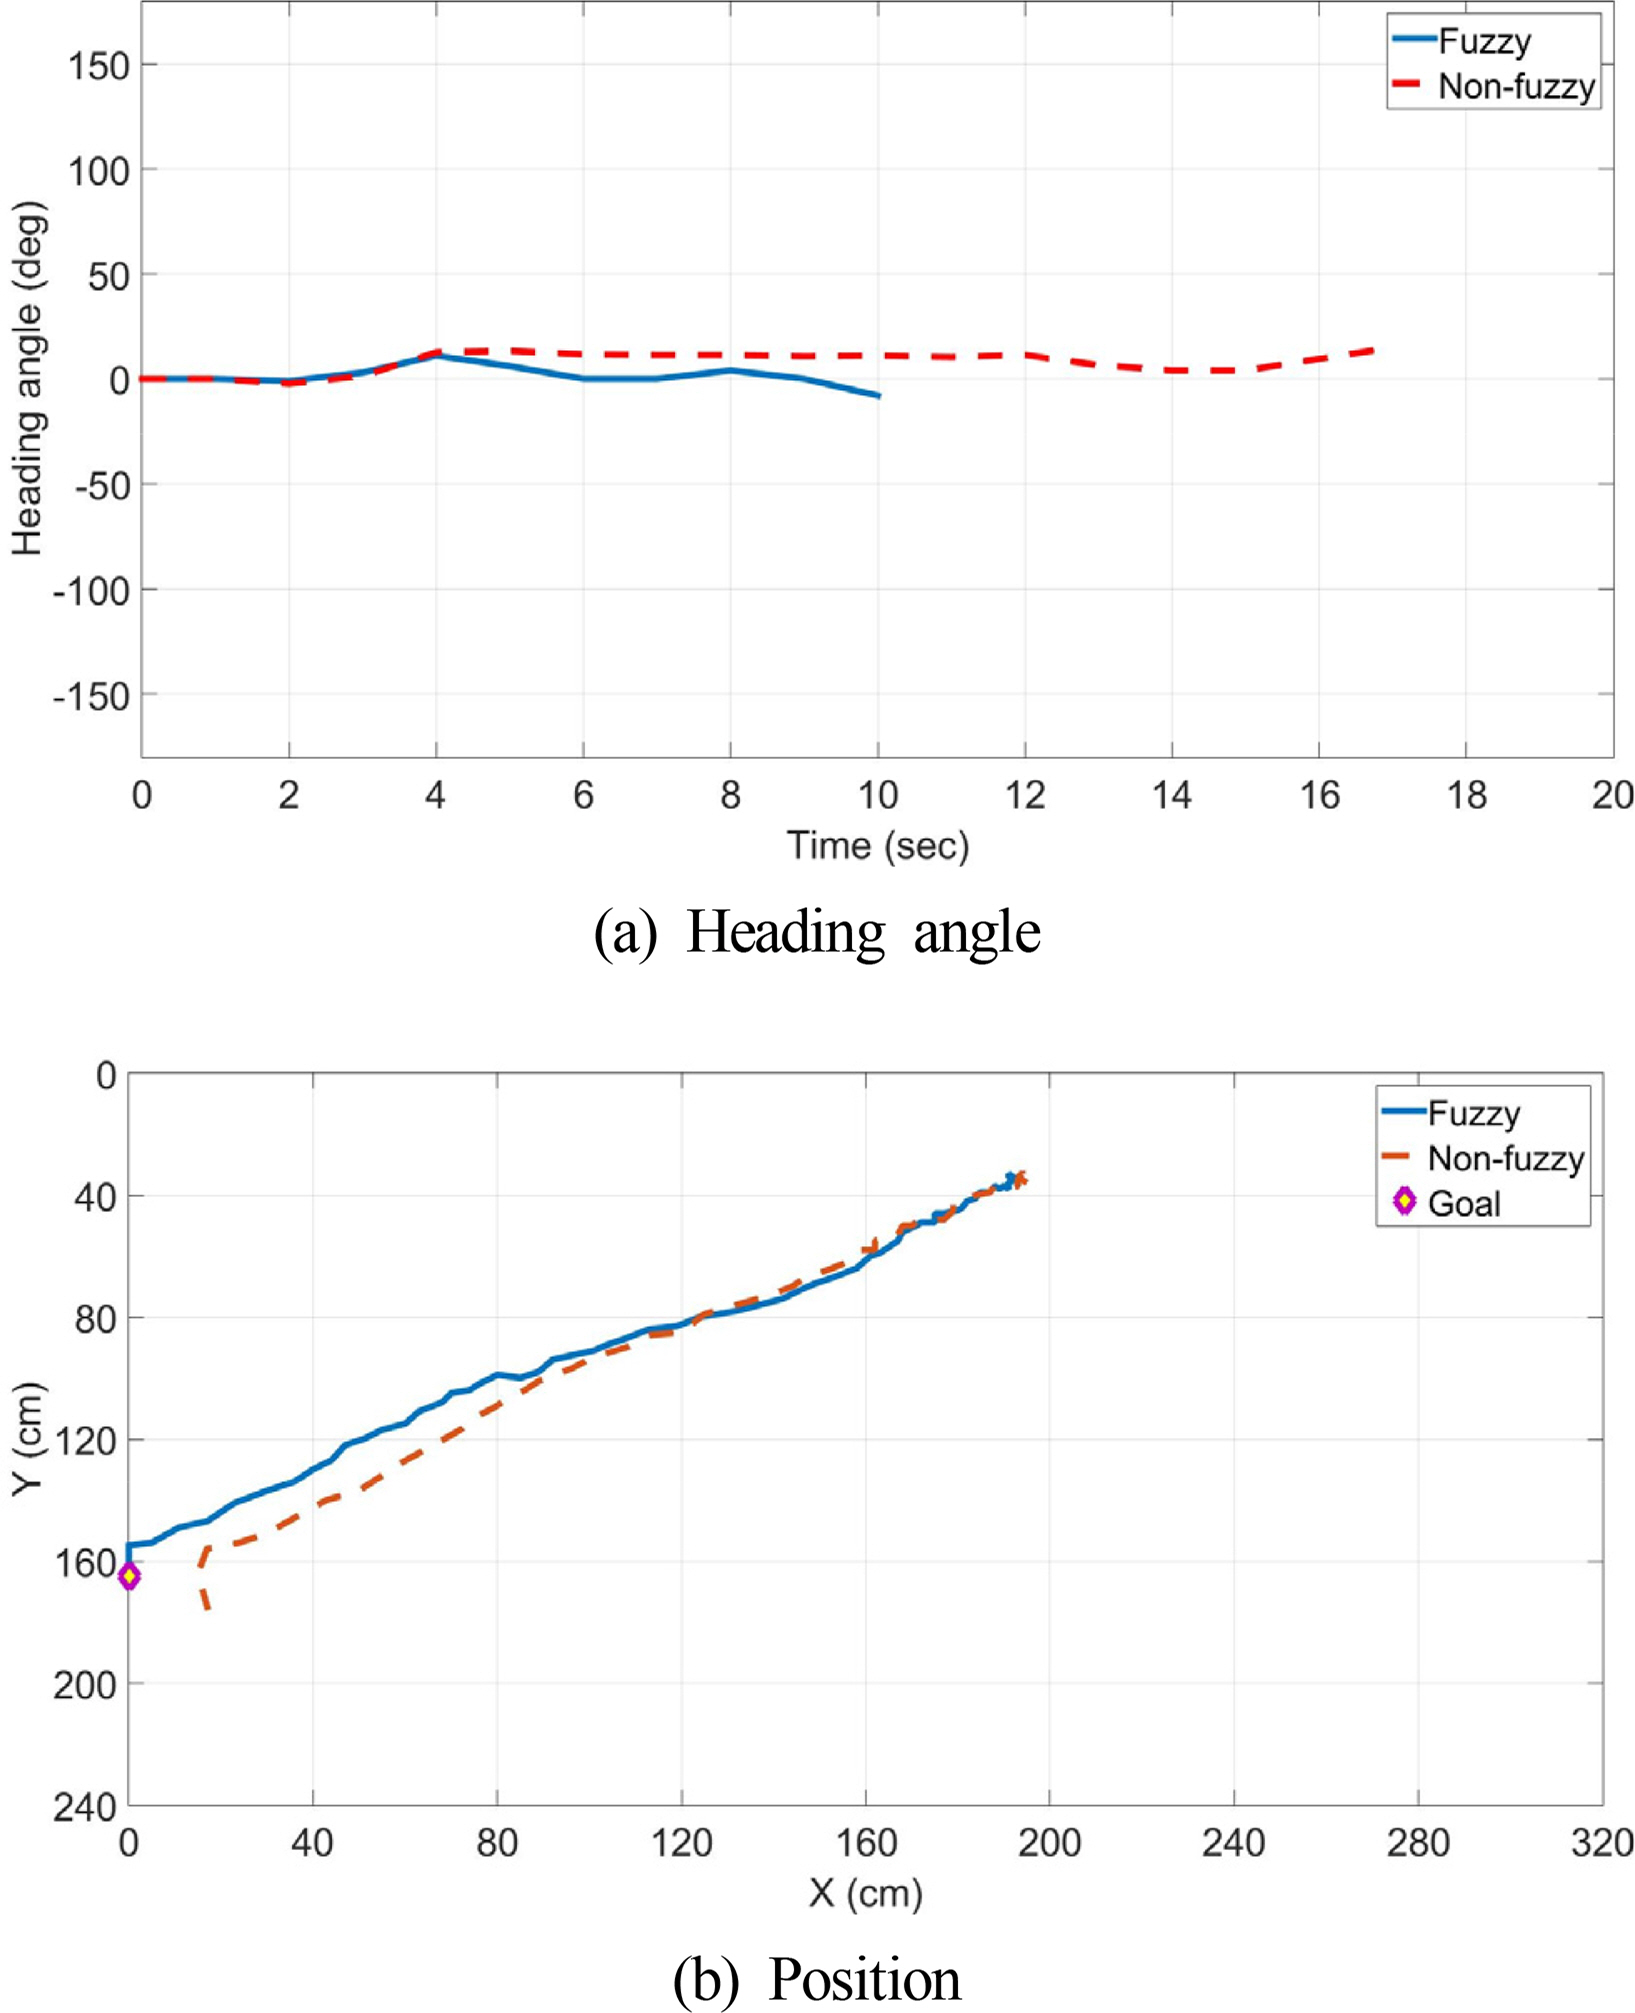
Performance of heading control (D-G case)
In the image coordinate trajectories of Fig. 15(b), the dashed line shows that the direction was maintained properly for a while, but it deviated near the destination, and the vessel arrived at a position approximately 16 cm away. However, the solid line shows that the vessel arrived at the desired destination, confirming that its performance is better.
Fig. 16 shows the D-F case, in which the wind speed increased, resulting in numerous errors in the heading values and a trajectory significantly pushed away. Fig. 16(a) shows that the maximum error was 25° in the case of the dashed line, but it decreased to 20° in the case of the solid line, where the FLC was used. Furthermore, because it veered at 5 s and maintained the direction properly, it can be seen that the response speed increased.
Performance of heading control (D-F case)
In the image trajectories of Fig. 16(b), the solid line shows that the CSD proceeded in the desired direction and arrived at a position approximately 14 cm away, but the dashed line shows that it arrived at a completely different location because the cross-flow force occurred significantly.
Fig. 17 shows the C-G case. The crosswind, the wind blowing from the side, occurs typically, where the cross-flow force occurs the most. However, in the case of a gentle breeze, the cross-flow force was not large because the wind speed was low.
Performance of heading control (C-G case)
Fig. 17(a) shows that the maximum error of the heading values is 30° in the case of the dashed line. In the solid line, it can be seen that errors occurred up to 15° at 5 s and 10 s, but the direction was maintained by veering.
In the image coordinate trajectories of Fig. 17(b), it can be observed that the desired direction was well-maintained in both cases. In the case of the solid line, the CSD arrived at a position approximately 5 cm away, and in the case of the dashed line, it arrived at a position approximately 20 cm away.
Fig. 18 shows the C-F case. As mentioned earlier, it is a case where the cross-flow force occurs the most. When the heading values are compared in Fig. 18(a), it is found that the maximum error is 20°. The solid line shows that direction is well-maintained through veering. In the case of the dashed line, however, the value increases up to 24°.

Performance of heading control (C-F case)
The image trajectories of Fig.18 (b) show that the CSD was pushed away by the cross-flow force in both cases, and it was pushed away less when the proposed controller was used compared to before using it. Nevertheless, it was pushed significantly to the side in both cases, proceeding in directions different from the desired direction.
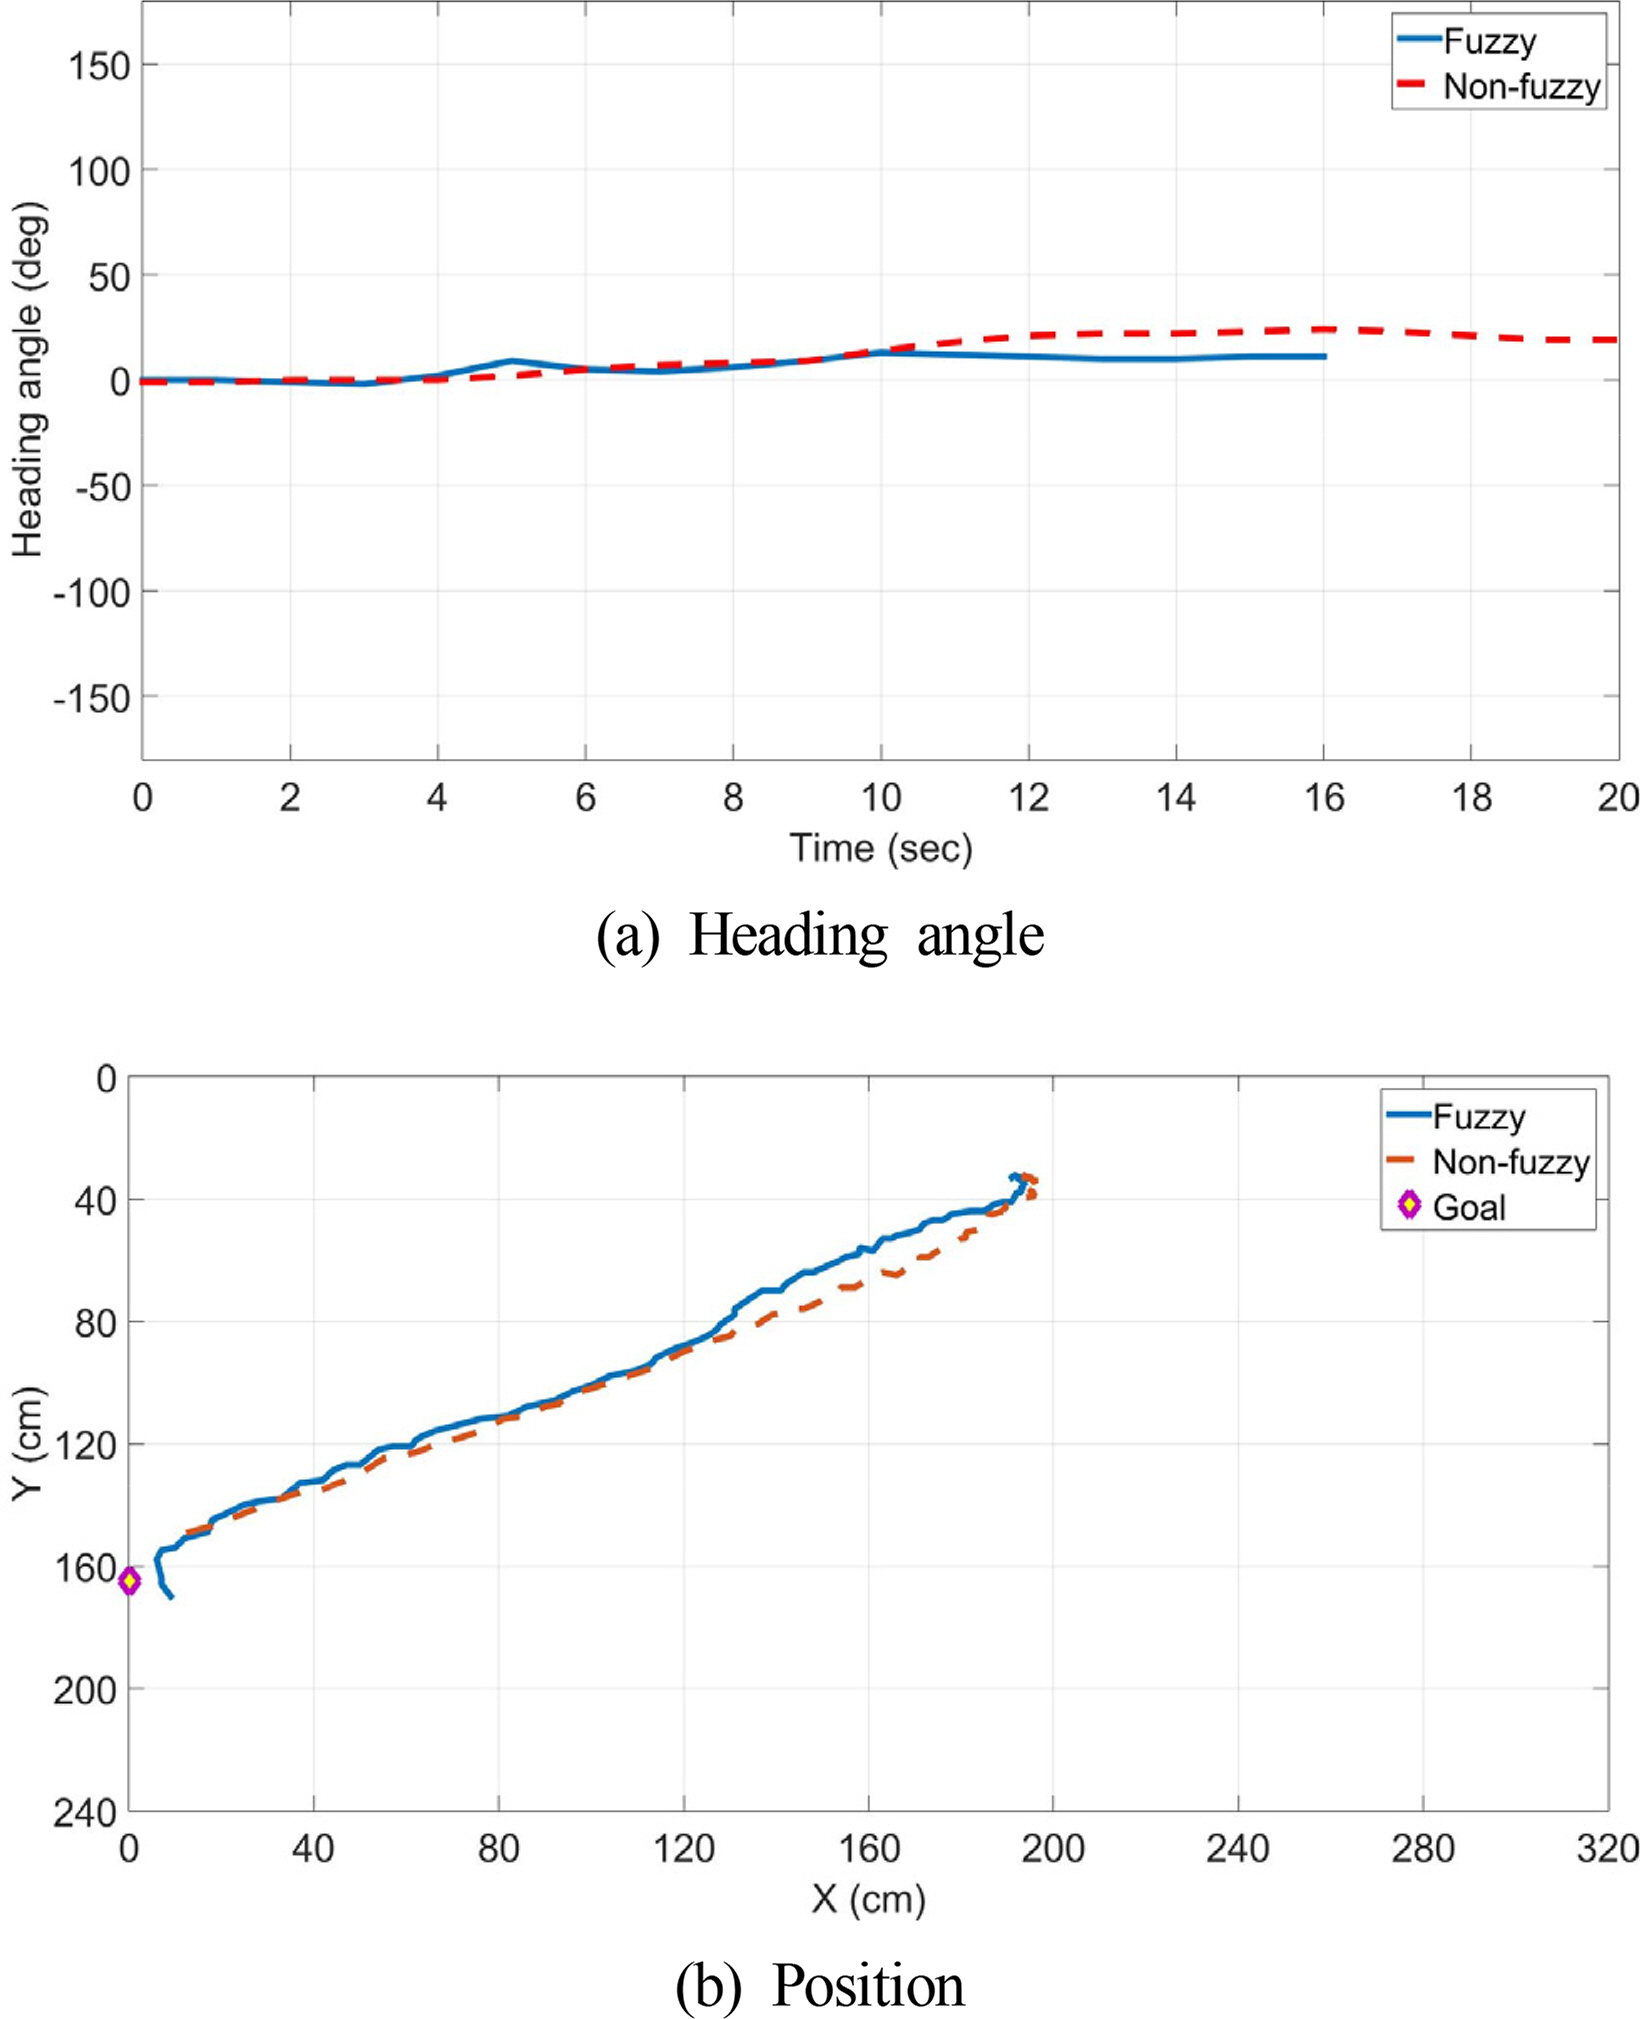
Fig. 19 shows the U-G case. In the heading values in Fig. 19(a), the dashed line shows that the direction started to turn at 6 s, turning 30° at the end. However, the solid line shows that a maximum error of 18° occurred at 6 s, but the direction was maintained by veering.
Performance of heading control (U-G case)
The comparison of the solid line and dashed line in the image trajectories of Fig. 19(b) shows similar performances. The dashed line shows arrival at a position approximately 8 cm away with a trajectory, which was pushed further away to the side compared to the solid line. The solid line shows that the direction was maintained, and the CSD arrived at the target position.
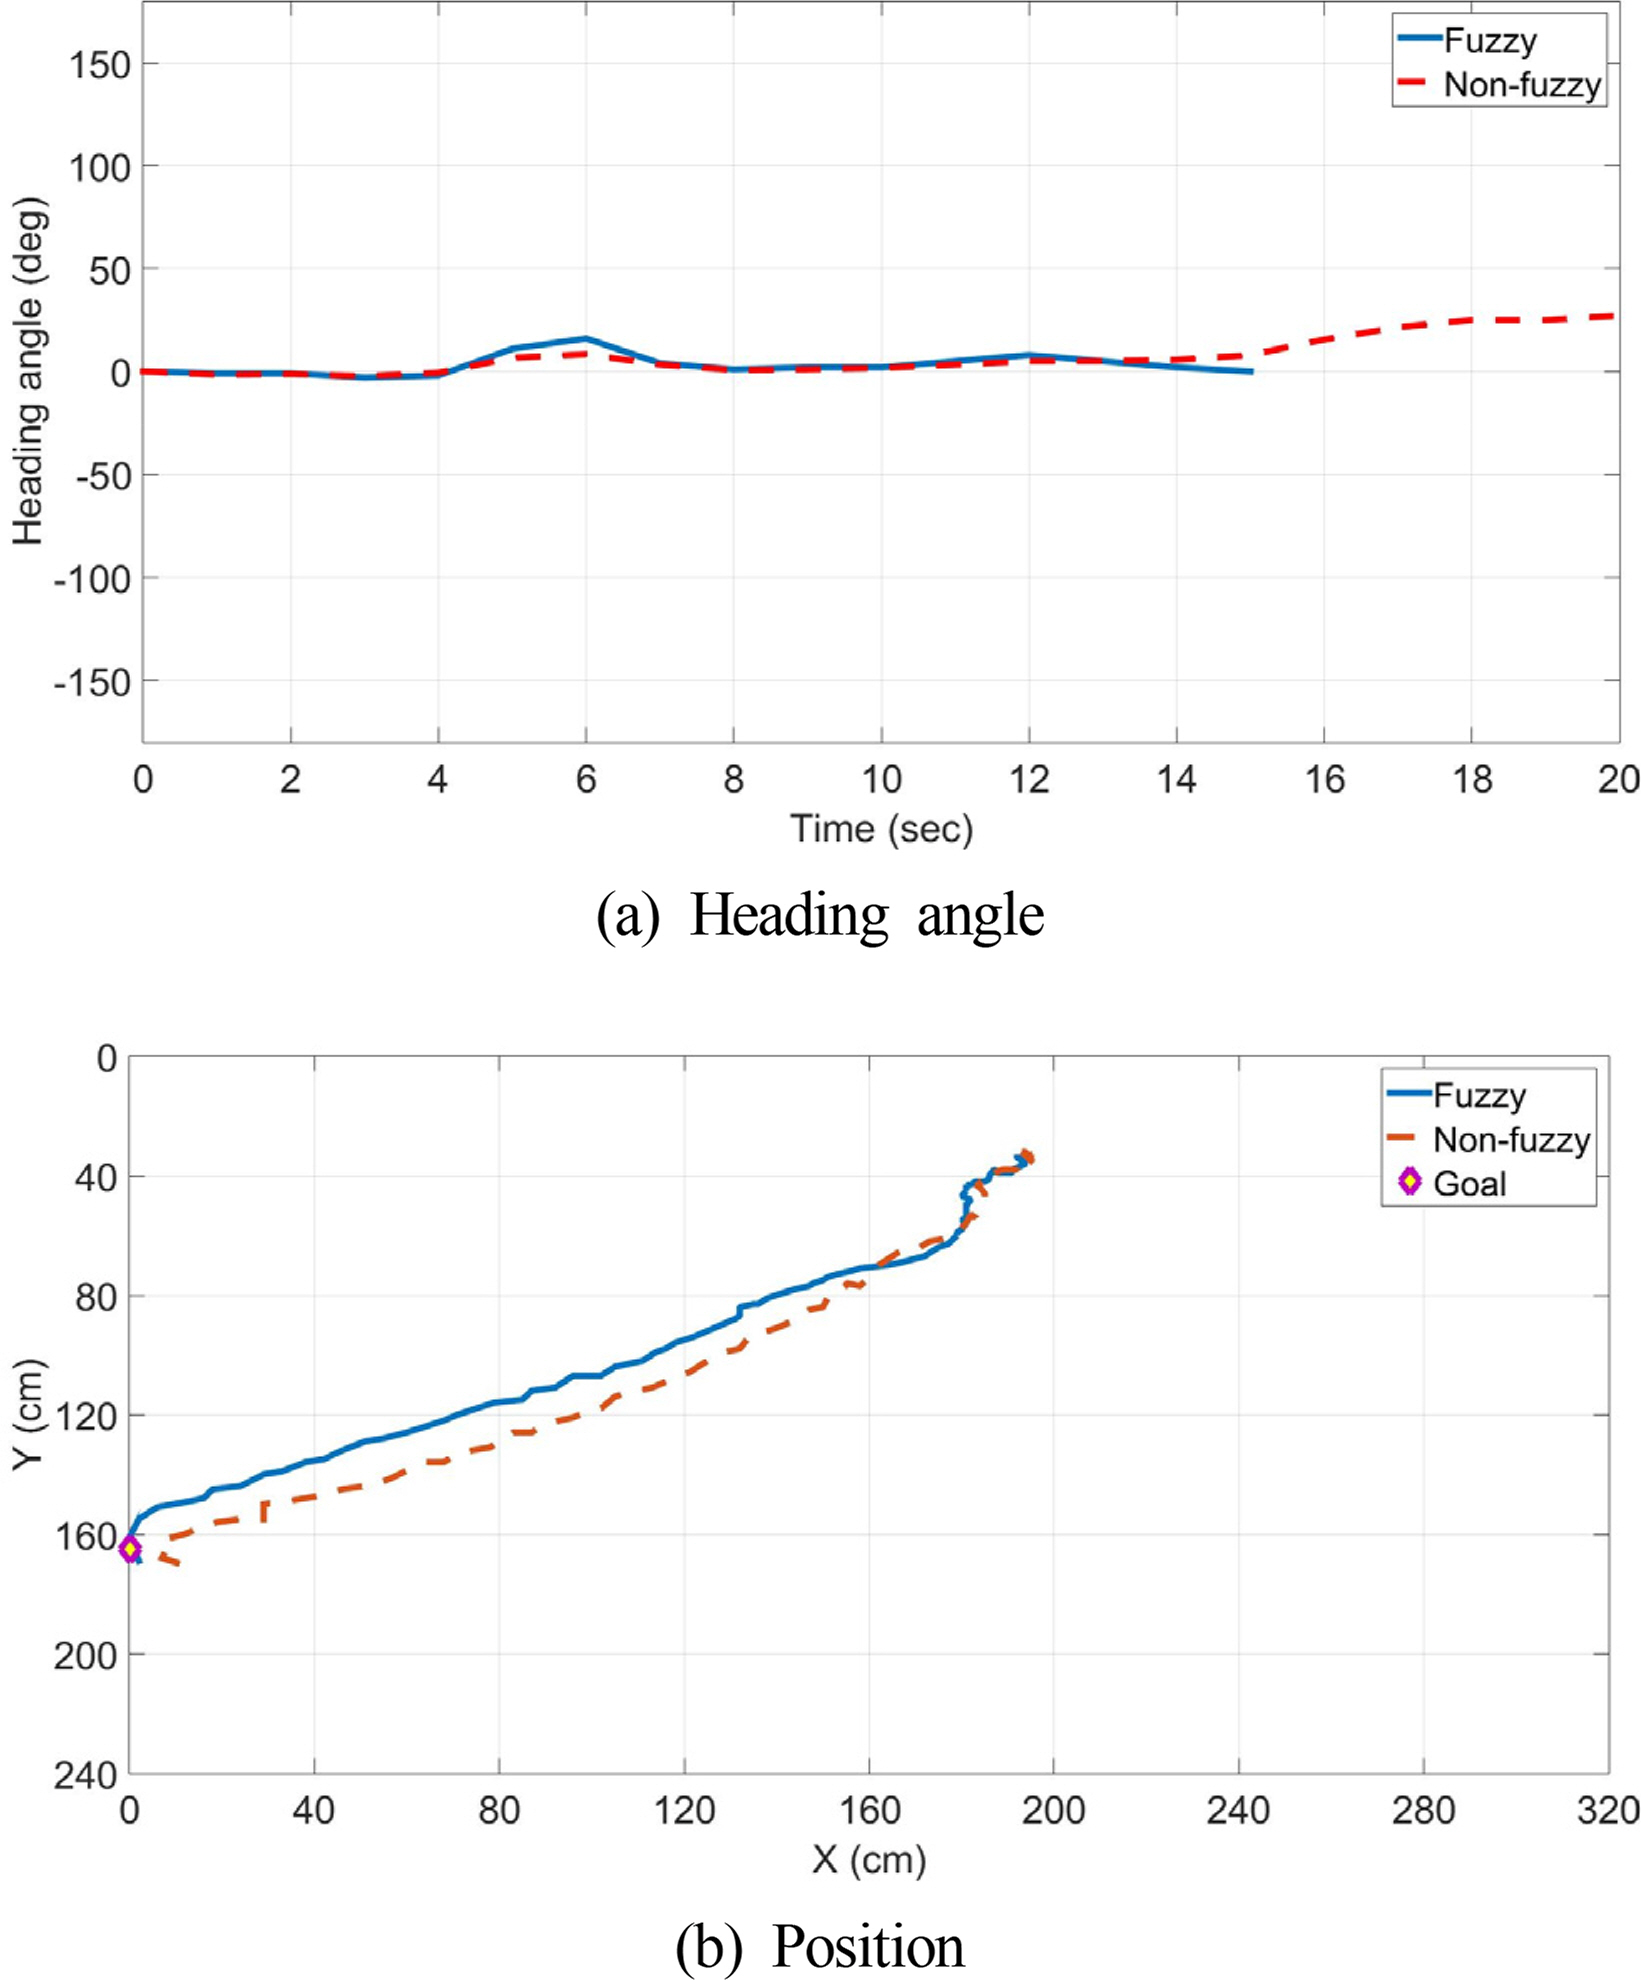
Fig. 20 shows the U-F case. In the heading values in Fig. 20(a), errors occurred significantly irrespective of the controller. The dashed line shows that an error of approximately 30° occurred, and toward the end, the maximum error increased to 45°. In the case of the solid line using the FLC, the maximum error was 30°.

Performance of heading control (U-F case)
In the image trajectories of Fig. 20(b), the dashed line shows the arrival at a position approximately 22 cm away from the target position, but in the case of the solid line, it can be observed that the CSD proceeded in the desired direction properly, arriving at a position approximately 14 cm away.
Table 6 summarizes the overall results. The heading value errors show that the use of the proposed controller reduced the maximum error by 50% overall. Furthermore, because the time spent decreased by 14–40%, it is confirmed that the speed increased.

Result of Test & Evaluation
When the capability for maintaining the heading was compared using the image coordinate values, we found that the path was well maintained overall when the proposed controller was used, except in the C-F case. Furthermore, the D-F case was the case that exhibited the greatest difference in performance, whereby the direction was maintained to the desired destination only when the proposed controller was used.
6. Conclusion
In this study, we investigated a novel CSD system that considers the maintenance/repair and model of a ship, a performance estimation tool that can check the attitude stability in the CSD design process, and an FLC that reflects the expert knowledge-based sailing operation method.
The newly developed CSD considering the model of a ship and the maintenance showed better performance than the conventional CSD. Furthermore, the proposed performance estimation tool can be used to check the attitude stability before manufacturing.
To validate the proposed expert knowledge-based FLC, the heading was controlled for three types of wind direction and two types of wind speed. As indicated by the experimental results of validating the heading control, the response speed and CSD’s speed for maintaining the heading increased in all cases, showing the performance of the proposed controller.
In this study, we have prepared a foundation for research in CSD in South Korea. In the future, we will adopt various intelligent control methods to compare the performance and continue research on the improvement of straight path movement for the cases of crosswind and fresh breeze. Furthermore, the developed performance estimation tool was studied based on the limited size of the experimental water tank for real-time rendering. However, in the future, we plan to conduct research related to simulations that reflect the real-world maritime domain environment by improving the program.