Evaluation of Structural Design Enhancement and Sensitivity of Automatic Ocean Salt Collector According to Design of Experiments
Article information

Abstract
This study provides a comparative analysis of experiments-based enhancements and sensitivity evaluations for the structural design of an automatic ocean salt collector under various load conditions. The sizing variables of the structural members were considered as design factors. The strength and weight performances were selected as output responses. The design of experiments used in the comparative study consisted of the orthogonal array design, Box–Behnken design, and central composite design. The response surface model, one of the metamodels, was applied to the approximate model generation. The design enhancement performance metrics, including numerical costs and weight minimization, according to the design of experiments, were compared from the best design case results. The central composite design method showed the most enhanced design results for the structural design of the automatic ocean salt collector.
1. Introduction
The ocean and fisheries industries are expected to become major providers of food resources in the future, and the development of these enterprises is being strengthened to ensure stable fishery resources worldwide. The market size of the ocean and fisheries equipment industry, the main supplier underpinning the ocean and fisheries industry, is expected to increase from $63.6 billion in 2017 to $89 billion in 2022, with growth particularly expected to increase in the Asia Pacific (Lee et al., 2019). However, the product competitiveness and automation rate of Korean ocean and fisheries equipment is very low, and the ratio of location to market size is only about half, making it considerably reliant on imports.
Salt collectors, a type of ocean and fisheries equipment used to collect salt from ocean salt farms, are in urgent need of development for automation owing to the poor state of salt farming. As shown in Fig. 1, the existing salt collection method in ocean salt farms involves manually unloading crystallized salt into a collection bin on a rail to transfer the salt. To enhance the safety of ocean salt collection and the production per unit of the salt collection and crystallizing pond area, the development of locations for electric automatic ocean salt collectors (AOSC) has recently begun. However, owing to insufficient domestic and foreign design regulations for ocean and fisheries equipment, it is necessary to analyze the sensitivity of the design characteristics according to structural performance conditions to ensure the safety of structural designs of new types of ocean and fisheries equipment such as the AOSC while enhancing design efficiency to minimize weight.
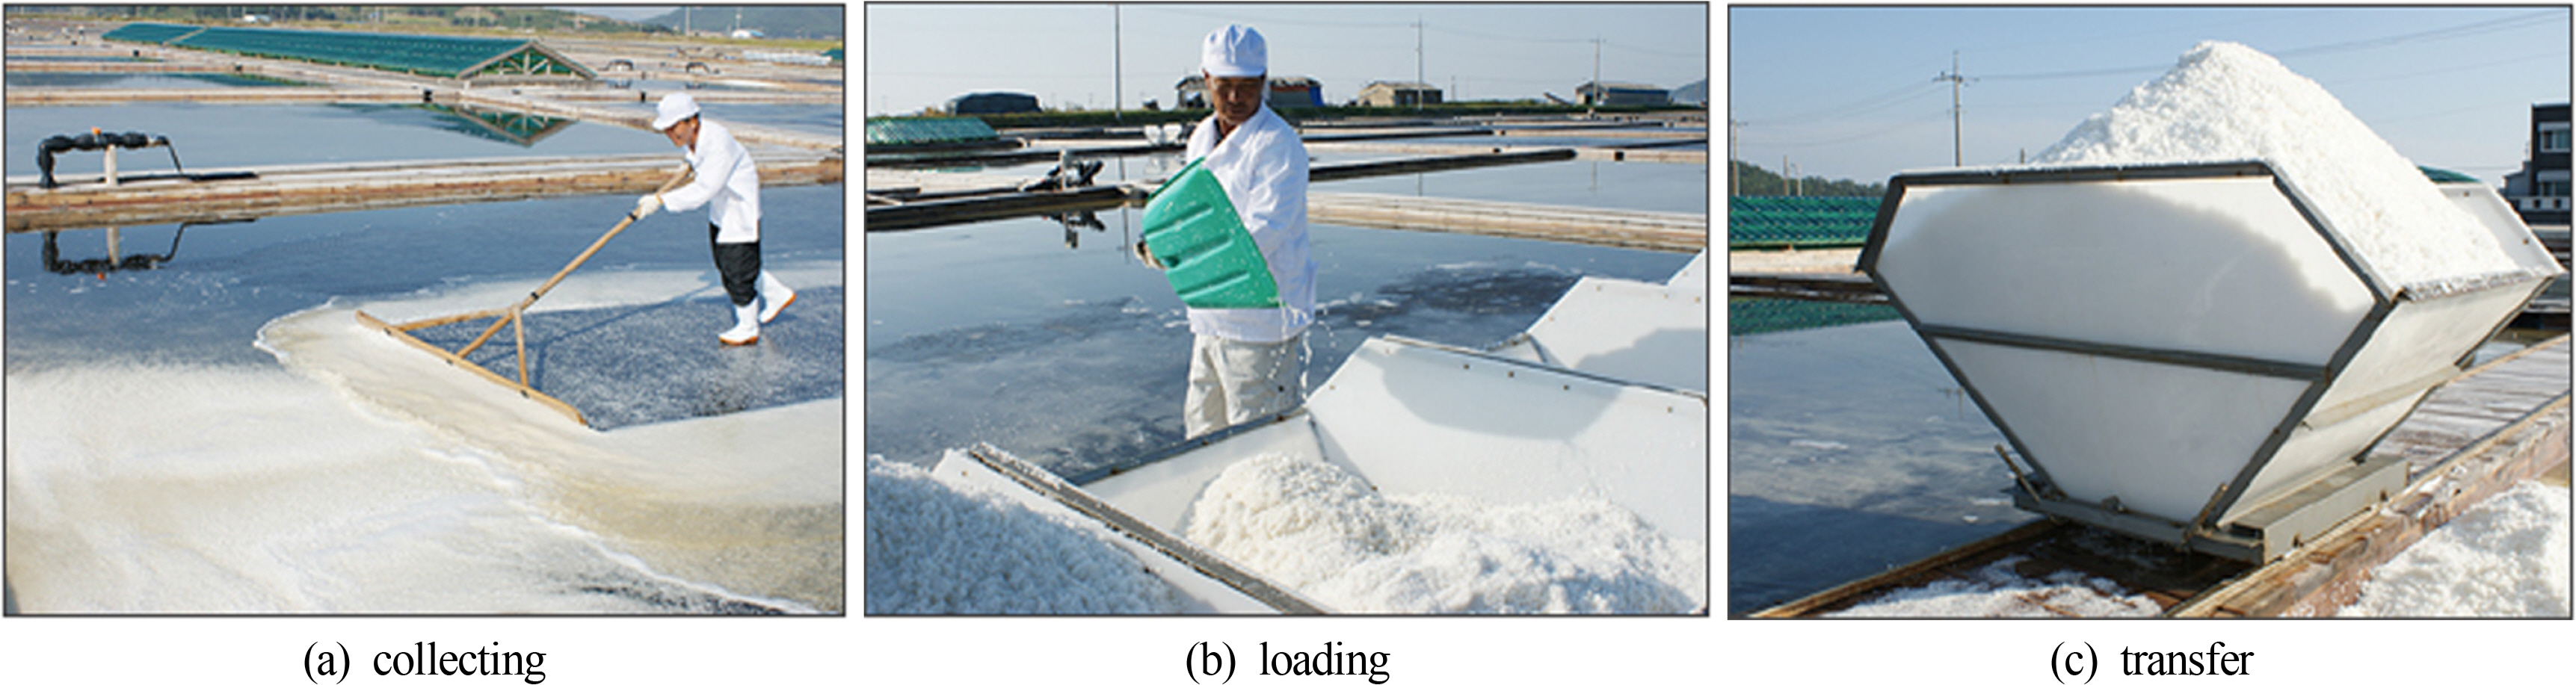
Work process of manual ocean salt collecting production
Researchers have conducted several studies on enhancing the safety of ocean equipment designs through sensitivity analysis and optimal design techniques. Park et al. (2011) applied an evolutionary algorithm to minimize the design weight of the support while satisfying strength constraints defined in piping design regulations for pipelines installed in floating production storage and offloading (FPSO) flare system. Song et al. (2011) explored the best design cases to minimize design risk by applying the constraint-feasible moving least squares method, a conservative approximate model for the reliability-based design optimization of FPSO riser adducts. To investigate the safety design of high-pressure quadruple eccentric butterfly valves, Lee and Kim (2014) conducted a design parameter analysis and variance analysis of the seating torque response function. Ji et al. (2015) used a genetic algorithm to realize an optimal placement design considering the stress and dynamic properties of the resilient mount for naval ships. Park et al. (2019) used various design of experiments (DOE) techniques to explore reasonable design cases to solve the issue of resonance in the normal operating range of the main engine of a navigational communication radar mast mounted on large merchant vessels.
To efficiently derive a design improvement case that secures the design safety of the AOSC, the present study explored best design cases by applying various DOE techniques, conducted a sensitivity analysis of major structural members, and compared the results according to DOE characteristics. To evaluate the strength performance in the AOSC’s initial design state, a structural analysis model was generated using the finite element method (FEM). The load conditions were calculated considering the AOSC’s actual operating conditions and applied to the structural analysis model, and the strength performance was assessed for each load condition. To improve the initial structural design of the AOSC, the influence of the major design members on strength performance was analyzed using DOE, and design improvement cases that satisfy the allowable stress while minimizing weight increase were explored. To derive a design improvement case based on DOE, three DOE techniques—OAD (orthogonal array design), BBD (Box–Behnken design), and CCD (central composite design)—were implemented to analyze the sensitivity results, and the DOE technique most suited for the AOSC’s structural design was examined considering the design improvement characteristics and numerical calculation cost. To verify the suitability of the sensitivity analysis results of major structural members and the exploration of DOE-based AOSC improvement cases applied in this study, approximate modeling using the response surface method (RSM) was conducted for each DOE technique, and the RSM design space exploration accuracy generated from each DOE technique was examined. Chapter 2 of this study describes the FEM-based strength performance evaluation of the AOSC’s initial structural design. Chapter 3 briefly reviews the theory of DOE, explores best design cases using DOE, conducts a sensitivity evaluation of weight and strength performance, and verifies the suitability of the DOE techniques using an approximate model. Finally, the study is concluded in Chapter 4.
2. Structural Analysis of the Initial Design
2.1 Calculation of Design Load Conditions
Fig. 2 shows the initial design of the electric AOSC developed to automate the collection of salt in ocean salt farms and enhance ocean salt collection safety as well as production per unit of salt collection crystallizing pond area.

Initial design configuration of the AOSC
As shown in Fig. 2, a salt collector part and towing part were designed and applied to the AOSC to automate ocean salt collection, and a drive and power part for transferring electric driving power and a rail frame part for transferring the collected salt were installed. To safely support the load generated during operation and mounting of the AOSC’s functional components, a collector frame, rail frame, and main frame were applied. Table 1 summarizes principal information on the AOSC.

Principal AOSC dimensions and system specifications
In terms of the main design load conditions for reviewing the AOSC’s structural safety, considering the harshest operating conditions that may arise during salt collection, a maximum loading case, braking case, and operating case under the maximum loading case were selected. Table 2 summarizes the design load conditions for each load case.
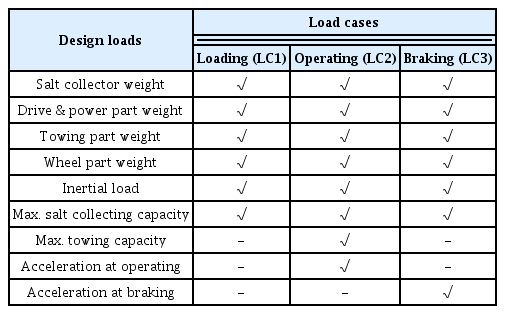
Design load cases
As shown in Table 2, the design loads generated in the AOSC for each load case were combined to configure the design load conditions. In the loading case (LC1), the weight of each functional product was applied considering the center of gravity and mounting position. To reflect the entire AOSC’s weight, an inertial load was applied considering gravity acceleration, and the maximum salt collecting capacity was applied as distribution pressure on the top of the rail frame in the center of the AOSC. In the operating case (LC2), along with the loading case, the maximum towing capacity and acceleration measured through the operation of prototype equipment manufactured with the initial design were applied in the transport direction. In the braking case (LC3), to consider a sudden braking case along with the loading case, driving acceleration was applied in the opposite direction of the transport direction. Gravity load was applied for the acceleration of LC2 and LC3 so that the gravitational influence of acceleration acted on the entire structure.
2.2 FEM-based Structural Analysis
To conduct an FEM-based strength performance evaluation of the AOSC's initial structural design, an FEM (Fig. 3) was generated considering the main structure (main frame, rail frame, and collector frame) and bracket part that can apply the weight and design load of the functional products.
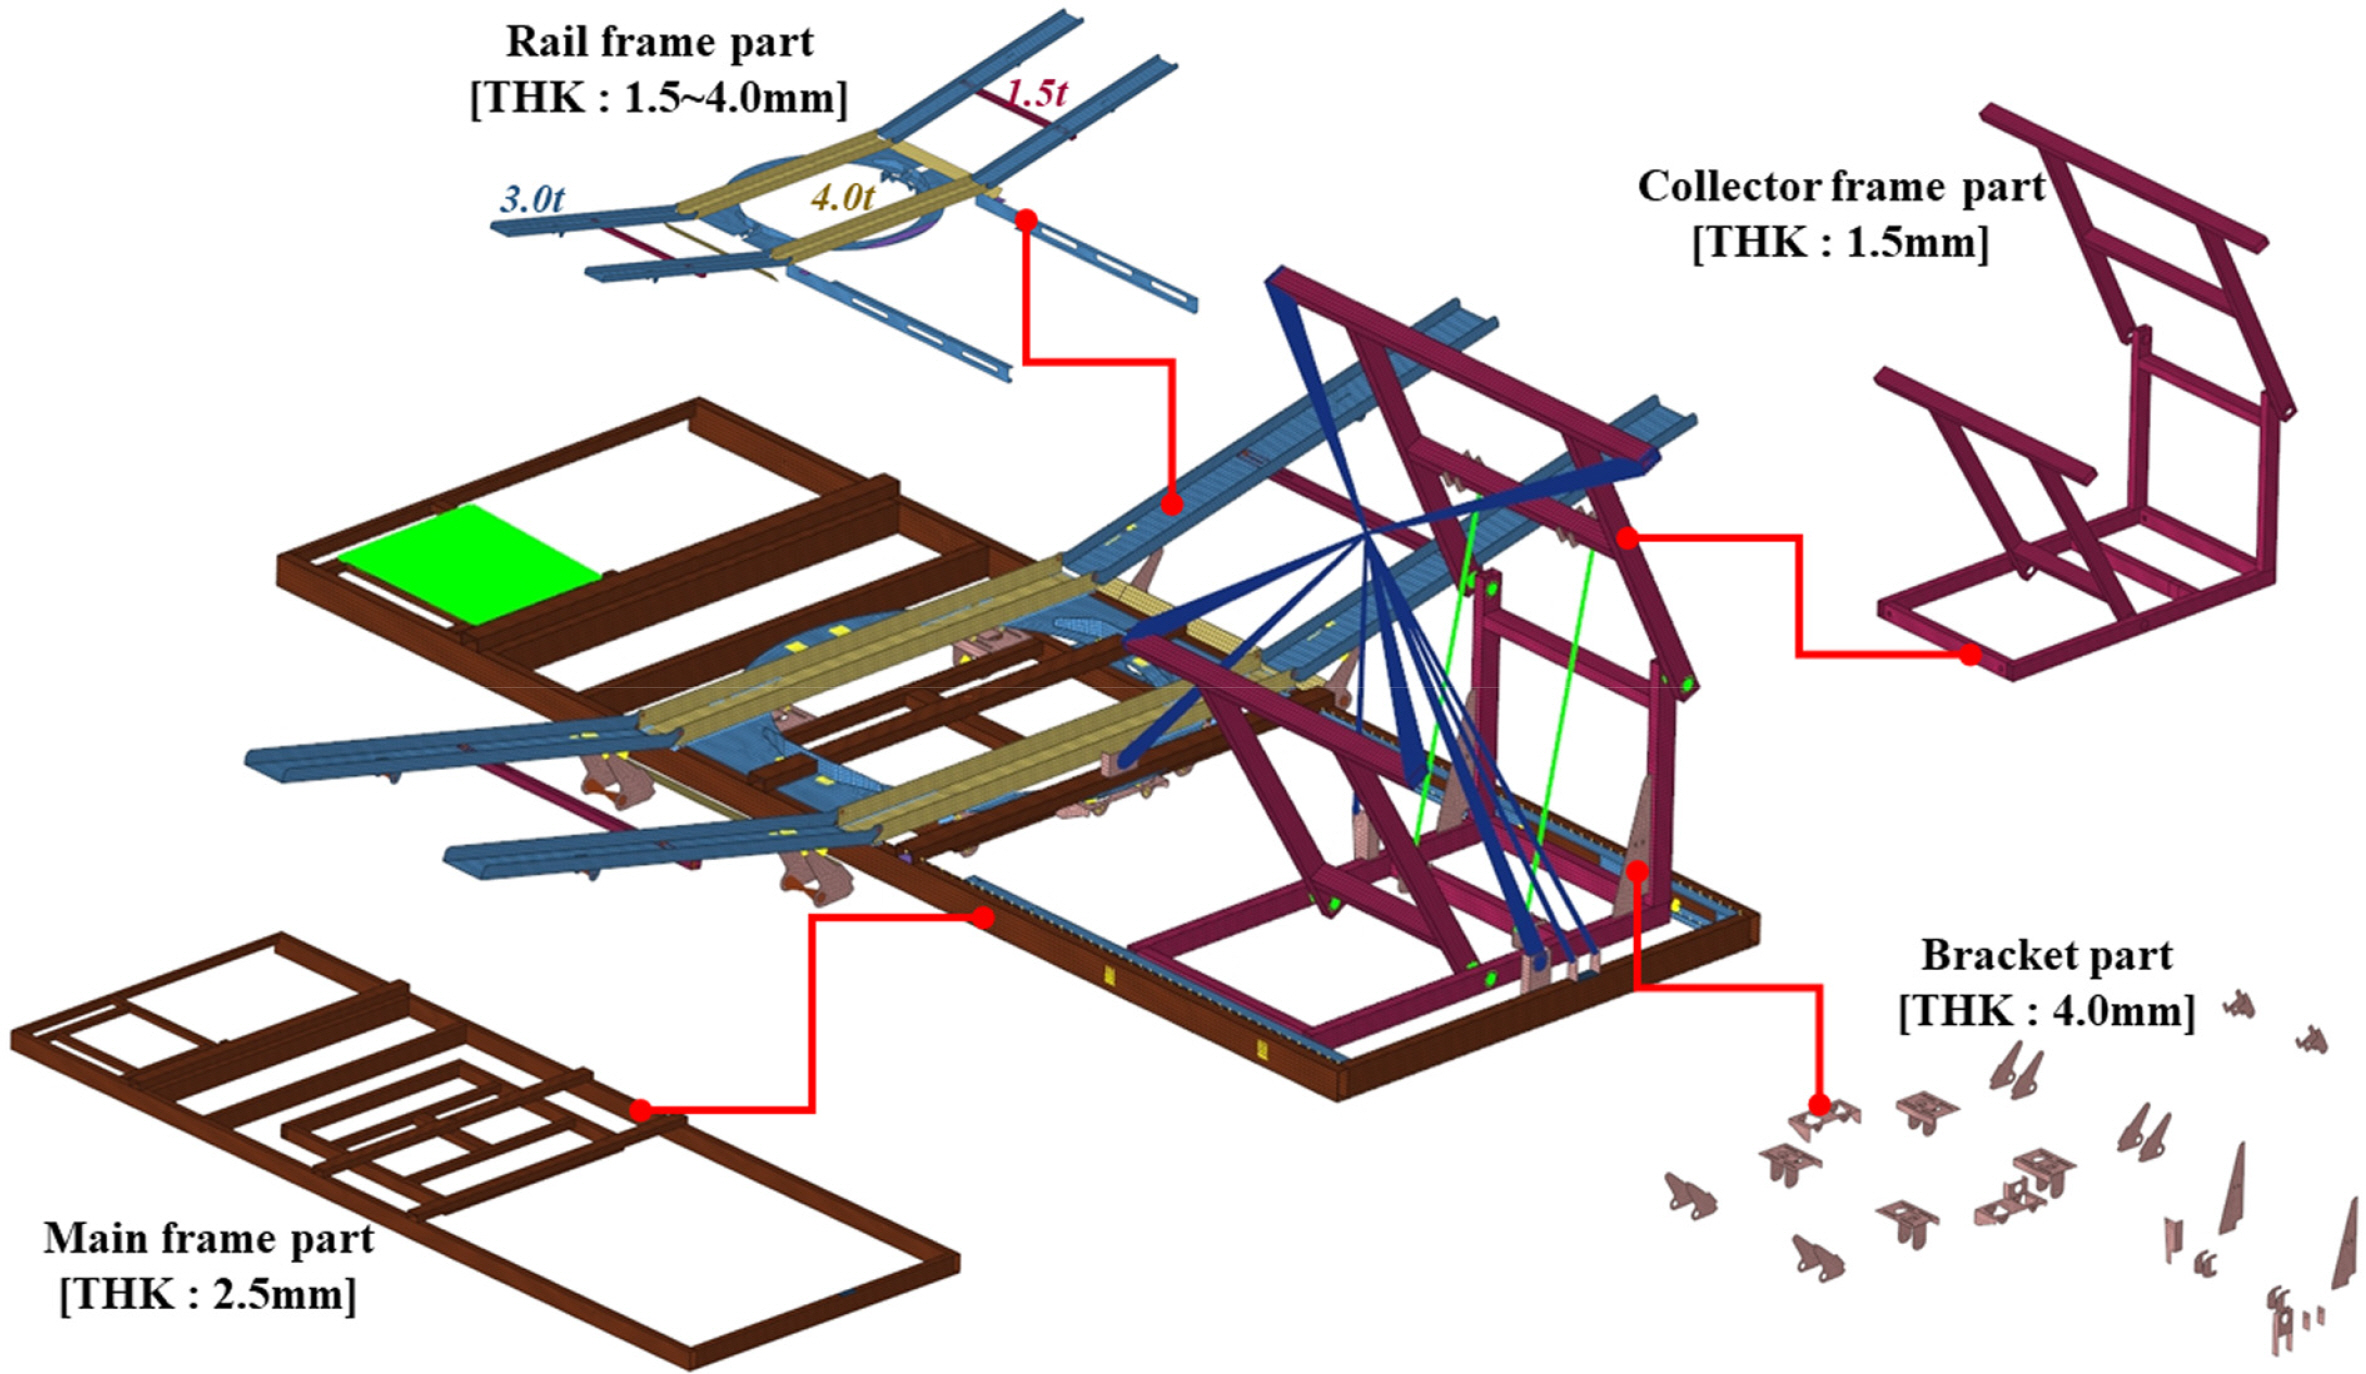
Finite element model of the AOSC
As shown in Fig. 3, the thicknesses of the main frame part, rail frame part, collector frame part, and bracket part are 2.5 mm, 1.5–4.0 mm, 1.5 mm, and 4.0 mm, respectively, which were applied in the initial design stage through empirical design. The elements used in the FEM consisted of a shell element for the main structure of the main frame part, rail frame part, collector frame part, and bracket part, and lumped mass elements for the weight of each functional product. Rigid links were used for the connection of each structural member and application part of the functional weight and design load, and the driving direction constraints of the rigid links were defined considering the operating mode. Table 3 summarizes the model information used in the FEM, and material properties of the austenitic stainless steel (SUS304L). The design conditions defined in Table 2 were applied for the load condition used in the structural analysis and for the boundary condition; all degrees of freedom were constrained except the rotation direction of the driving direction for each wheel of the wheel part.
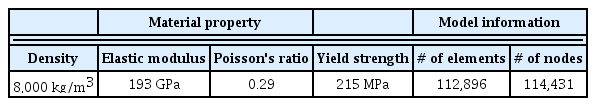
FEM model information and material property
Abaqus/Implicit (Simulia, 2018), a general-purpose finite element analysis program, was used to conduct the structural analysis, and the stress and deformation of the major structural parts were calculated for each design load condition. Table 4 summarizes the structural analysis results of the AOSC’s initial design stage, and Fig. 4 shows the overall stress and strain distribution results for the braking case (LC3).

Structure analysis results of initial design
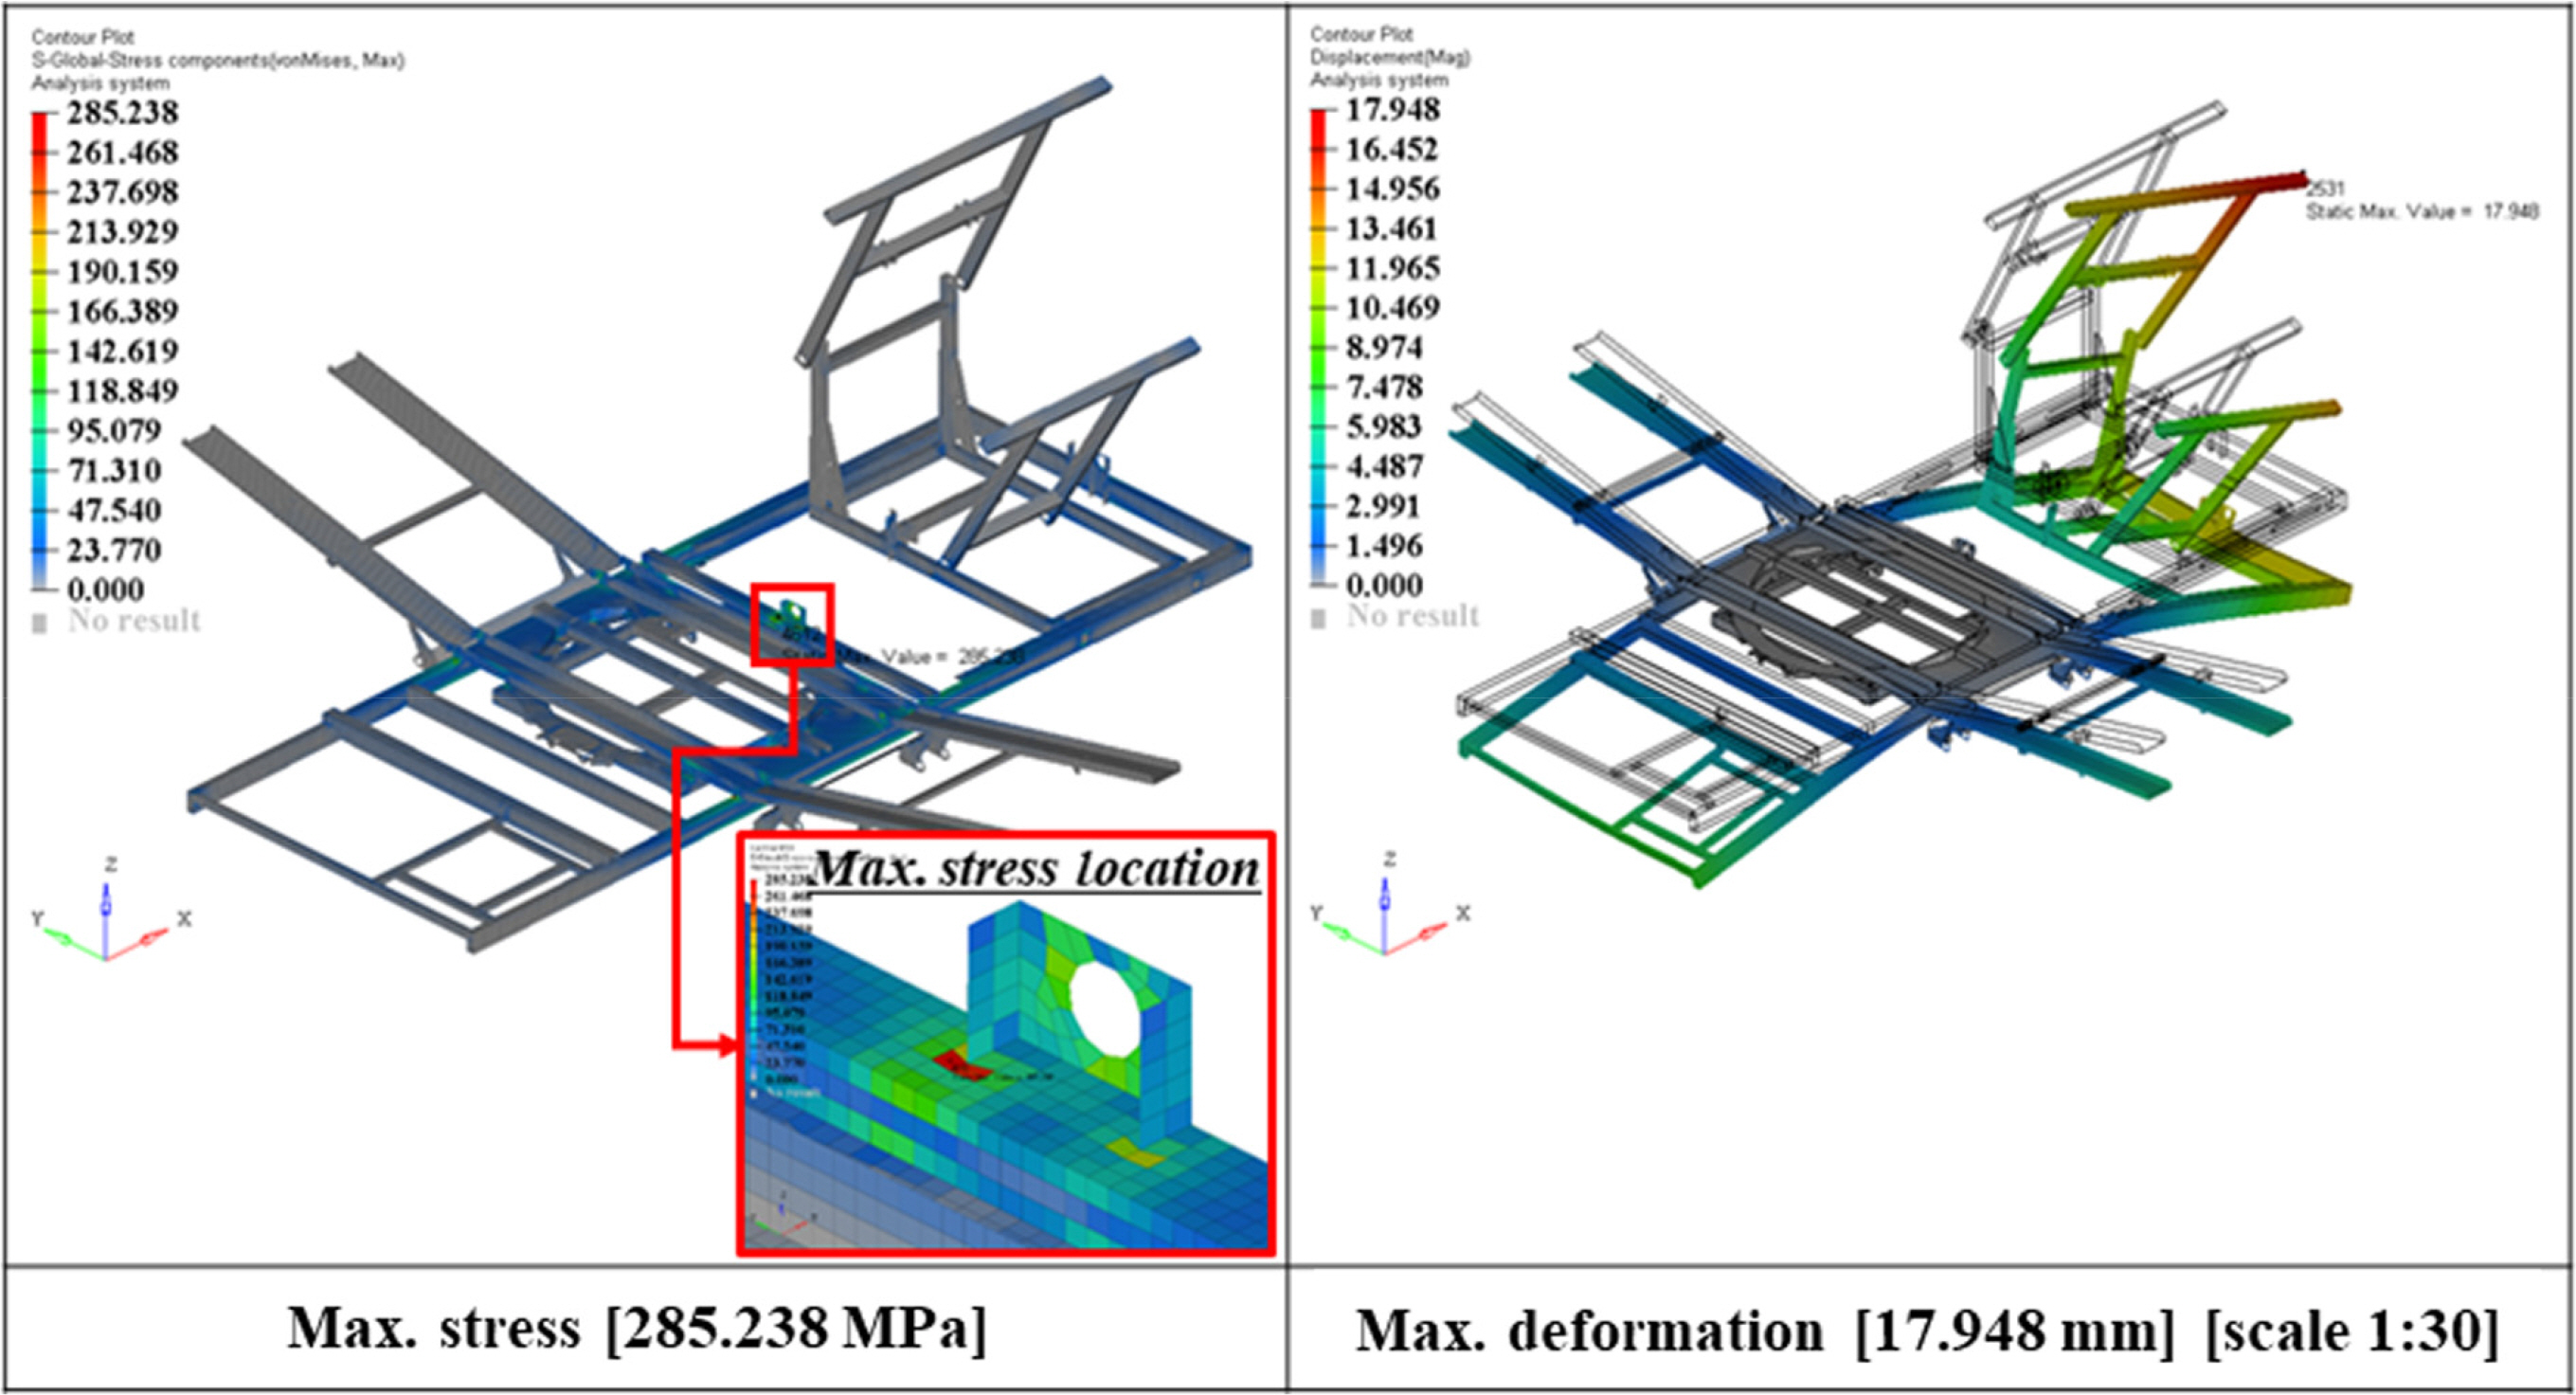
LC3 - Overall stress and deformation contours for the initial design
As shown in Table 4, under all design load cases, the stress values of the main frame part and the rail frame part failed to satisfy the material’s allowable yield stress. Furthermore, the braking case (LC3) showed the harshest results of all design cases. In all design load cases, the maximum stress occurred in the main frame part, and as shown in Fig. 4, the maximum stress was distributed in the center of the main frame part. The maximum stress occurred locally at the upper center of the main frame and bracket joint, which is likely because the design thickness of the main frame was 2.5 mm in a thin plate, and a gentle shape change design was not applied in the bracket joint. Accordingly, the structural analysis results of the initial design stage demonstrate that design improvements are required to secure the strength and safety of the AOSC’s structural design.
3. DOE-based Structural Design Improvement and Sensitivity Evaluation
To improve the initial structural design of the AOSC, the influence of the major design members on strength performance was analyzed using DOE, and design improvement cases that satisfy the allowable stress while minimizing weight gain were explored. To derive a design improvement case based on the DOE method, three DOE techniques (OAD, BBD, and CCD) were implemented to analyze the sensitivity results. The DOE technique most suited for the AOSC’s structural design was examined considering the design improvement characteristics and numerical calculation cost. Using the three DOE techniques considered in this study, considering three levels for the design factors, the secondary effects and interaction effects of the design factors can be observed. Unlike random DOE techniques, such as Latin hypercube design, the number of experiments is automatically determined for each DOE method, making it easy to use. However, even for the same design problem, the number of experiments and methods of filling the experiment space differ according to the DOE method, which may result in different design space exploration results. Hence, to utilize the DOE results for approximate optimization or reliability analysis, it is important to select a DOE technique suitable for the design problem. First, the theoretical characteristics of the DOE techniques used in this study are briefly summarized, after which each DOE technique is used to explore best AOSC structural design cases and evaluate the design sensitivity according to strength performance. In addition, to verify the suitability of the sensitivity analysis results of the major structural members and the exploration of DOE-based AOSC improvement cases applied in this study, approximate modeling using RSM was conducted for each DOE technique, and the RSM design space exploration accuracy generated from each DOE technique was examined.
3.1 DOE Theory
OAD detects the main effects and interactions between factors for experiments with a large number of factors and excludes information on high-order interaction and interaction between low-influence factors, thereby reducing the number of experiments through an OAT. The OAT has two, three, four, five, and mixed levels, with two and three levels typically used. This study applied OAT with three levels, as in the following equation (Park, 2012).
As shown in Fig. 5, the BBD method has a feature by which corner points are not used in the experimental space. This technique is also referred to as spherical, rotational, or approximate rotational quadratic design (Box and Behnken, 1960).
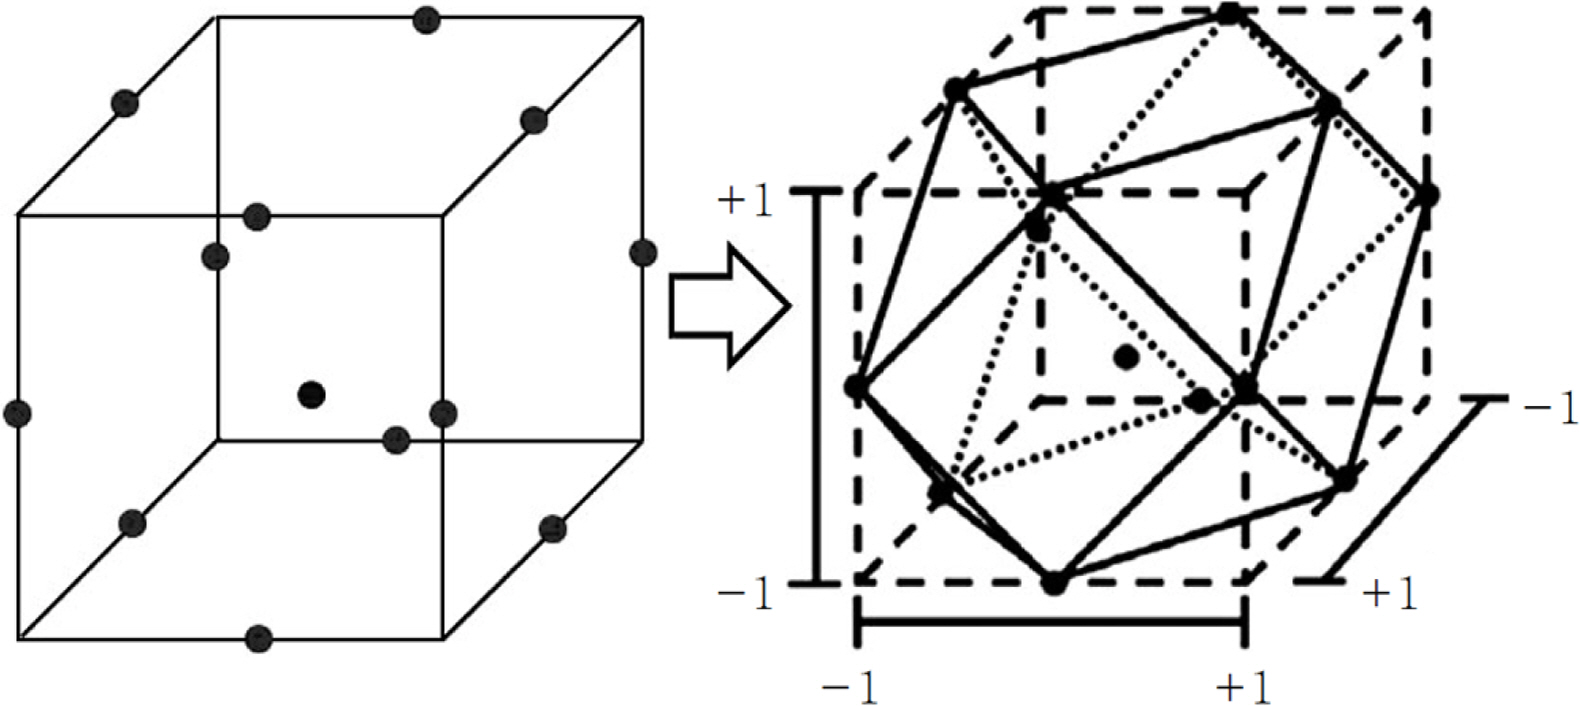
Design experimental space of the BBD method (Kim et al., 2015)
As shown in Fig. 5, BBD uses polyhedral edge center points, excluding center points and corner points in the entire experimental space, thus allowing economical DOE. BBD is advantageous for calculating quadratic regression equations and exploring optimal conditions when the factors are quantitative and have three levels. In terms of the number of independent variables k, BBD can easily generate orthogonal blocks with a small number of experimental points, through which a quadratic regression equation can be obtained.
CCD adds center points and axial points to 2k factor experiments and detects the curved change in the amount of responses caused by changes in the level of variables (Park, 2012). In CCD, the number of center points becomes at least one, and the number of axial points becomes 2k. If the number of center points is no, then the number of CCD experiments n can be defined by the following equation.
As in Eq. (2), in the case of k > 2, the DOE method can be performed with significantly fewer experiments than factorial design, and it is highly advantageous if the experimental cost is high. Moreover, rather than performing DOE again when the regression model estimation must be changed, CCD can perform sequential experiments that add new data points to the center and axis.
3.2 Comparison of Best Design Cases and Structural Design Sensitivity According to DOE Characteristics
To conduct the AOSC structural design effect evaluation according to the DOE characteristics, the thickness of the main structural members was set to three levels of the design factors, and the maximum stress and weight for each design load case shown in Tables 2 and 4 were set as the output response. The upper and lower limits of the design factors were set considering the range within which the AOSC can be manufactured. Table 5 and Fig. 6 show the configuration of AOSC design factors.
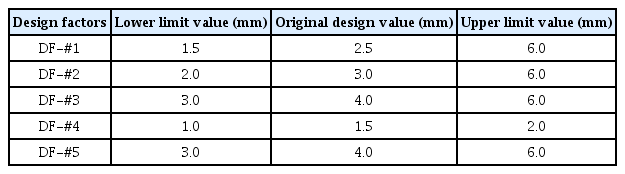
Design factors and ranges for the AOSC

Detailed setup for design factors of the AOSC
The configured design factors and three-level design factor range in Table 5 and Fig. 6 were applied. An experimental matrix with 81 runs was configured for OAD, 41 runs for BBD, and 43 runs for CCD. Tables 6–8 show the results of the response functions calculated via finite element analysis according to changes in design factors in the experimental matrices configured through each DOE technique.

DOE run table for the OAD method

DOE run table for the BBD method
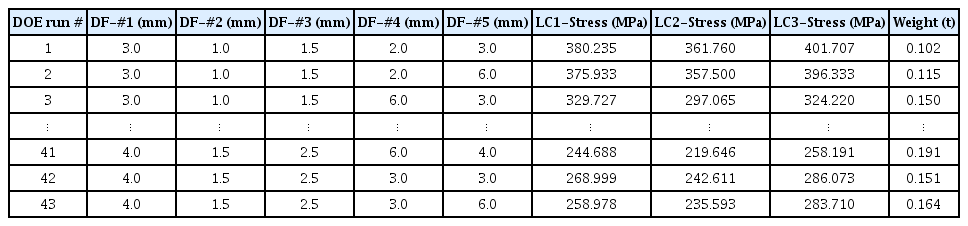
DOE run table for the CCD method
From the results summarized in Tables 6–8, combinations of design factors for which the maximum stress under all design load cases was calculated at the allowable yield stress of 182.8 MPa or less were explored, among which the combination with the lowest weight increase rate was selected as the best design case. Table 9 shows the best design plan selected for each DOE technique.
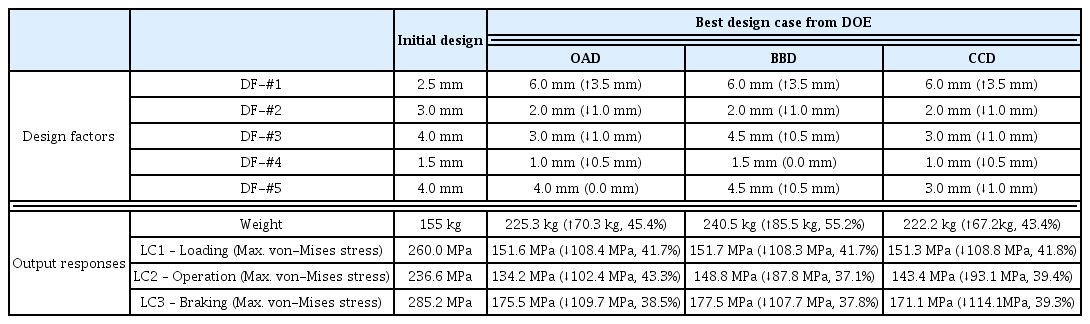
Best design cases for design enhancement of the AOSC
As shown in Table 9, the best design case in all DOE methods satisfied the allowable yield stress at a level in which the maximum stress was similar for all design load cases compared to the initial design, although there was a variation in weight. Among the DOE methods for the structural design of the AOSC considered in this study, the CCD method exhibited a weight increase rate of 43.4%, which was superior to the OAD and BBD methods, while the BBD method showed the highest increase rate of 55.2%. In terms of the change in thickness of the main member, the main frame (DF-#1) thickness design factor tended to increase to the upper limit of 6.0 mm for all DOE techniques, while the remaining design factors showed variations of 1.0 mm or less. Considering the weight increase rate and the number of experiments of DOE, which represents the numerical calculation cost, CCD was shown to be the most efficient method for deriving improvement cases for the AOSC’s structural design. Fig. 7 shows the overall stress and deformation distribution results of the enhanced best design case calculated from CCD for LC3.
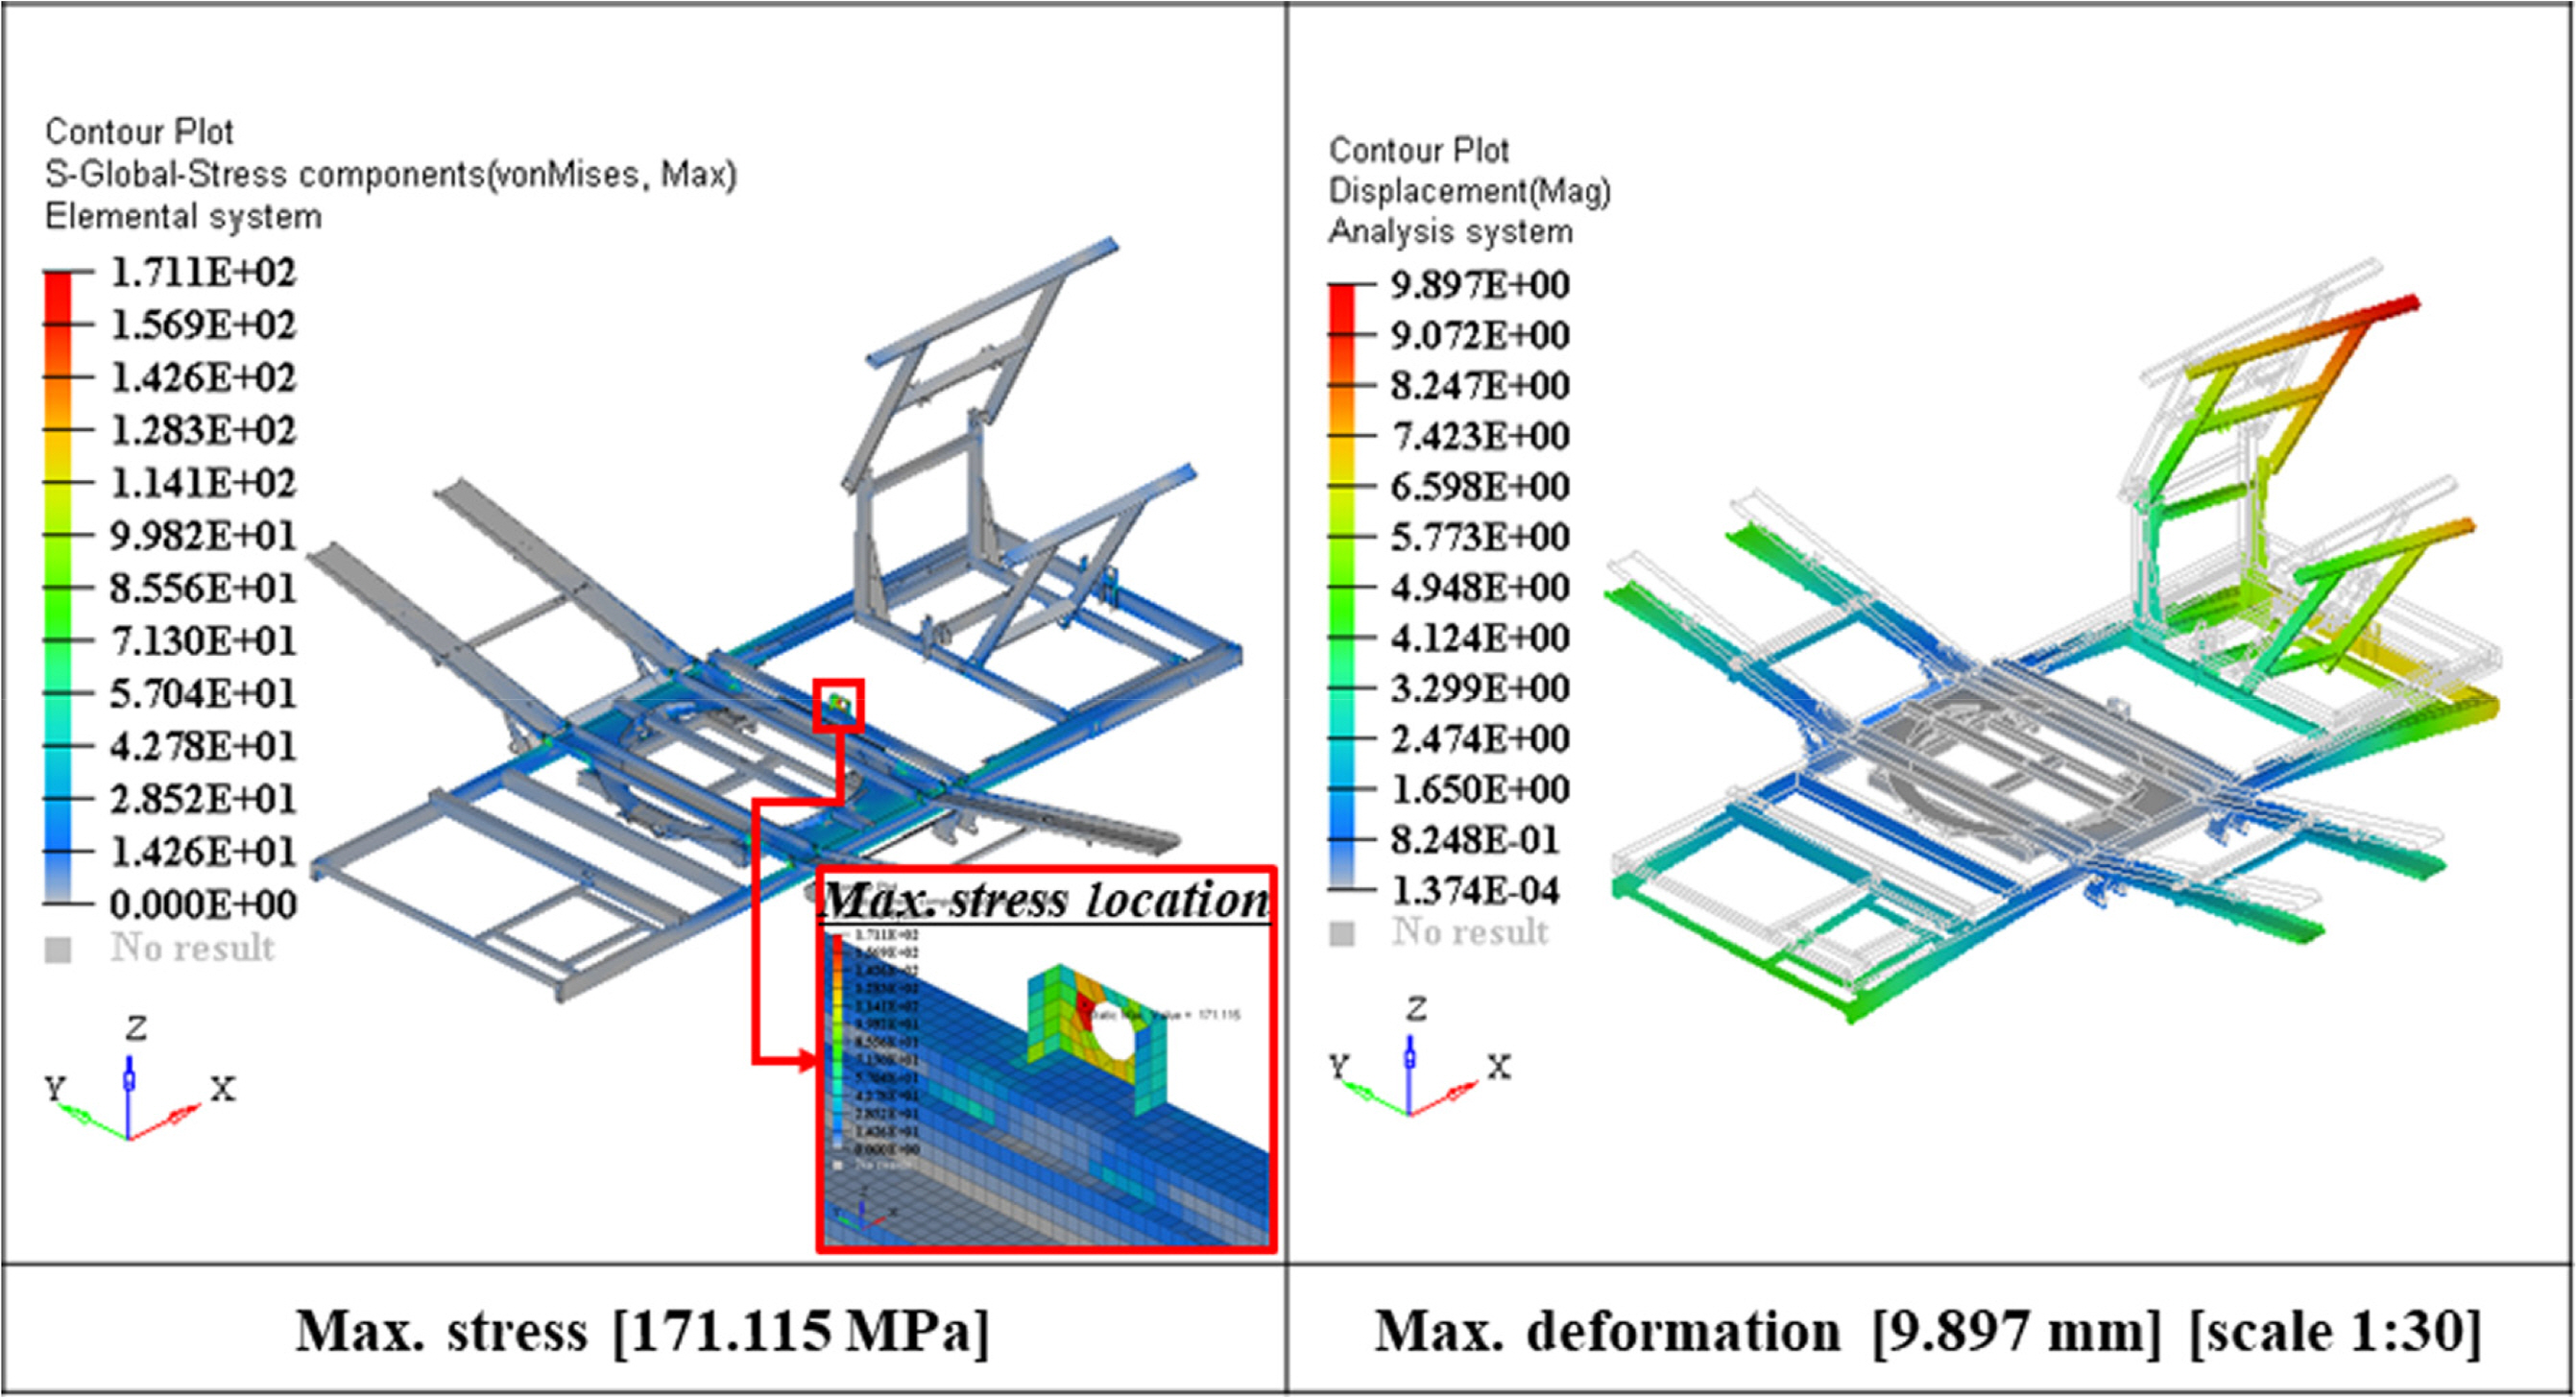
LC3 - Overall stress and deformation contours for enhanced design based on the CCD method
As shown in the results of Fig. 4 and Fig. 7, the maximum stress value was improved by 39% in the best design case compared to the initial design, the location of maximum stress moved from the main frame to the center bracket, and the maximum deformation was improved by 81%. The cause of the movement of the maximum stress location is attributed to the main frame member’s thickness increasing more than that of the bracket. Moreover, the overall structural safety improved as the maximum stress location moved from the main frame (main structural member) to the bracket (local member). A quantitative main effect analysis of the design factors for each response function was conducted according to the DOE method using the experimental matrix of OAD, BBD, and CCD, the results of which are shown in Table 10. The main effect is an indicator of the observed response function’s average change according to the change in the level of the design factor, i.e., the sensitivity. As such, the greater the effect calculated for each design factor, the higher the importance for the response function of that design factor.

Main effect results
As shown in Table 10, in all DOE methods, the effect of the main frame (DF-#1) was greatest on the maximum stress of the weight and design load cases, and the strength of the collector frame (DF-#4) showed the lowest main effect. The principal effect on weight was nearly identical in all DOE methods, while that on the strength of DF-#1 in BBD was higher than in the other DOE methods. Accordingly, an exploration of design enhancement cases applying various DOE techniques was performed. The results indicated that the most effective exploration method was to apply CCD to enhance the strength performance of the AOSC’s structural design, and that the main frame (DF-#1) was the most important structural member to consider in design.
3.3 Review of DOE Suitability Through Approximate Modeling
Because approximate models are typically generated from DOE, by quantitatively examining the accuracy of the generated approximate model, the overall suitability of the DOE method considering the number of experiments, the level of design variables, and DOE method selection, can be verified (Lee and Song, 2013). To verify the suitability of the sensitivity analysis results of major structural members and the exploration of AOSC improvement cases using various DOE techniques applied in Section 3.2, approximate modeling using RSM was conducted for each DOE technique, and the RSM design space exploration accuracy generated from each DOE technique was examined. The least-squares method can be used to define the RSM, a quadratic polynomial regression model, as follows (Song and Lee, 2010).
From the n experimental points calculated using the DOE techniques (OAD, BBD, and CCD), if matrix Z expressed by k basic variables and the real response vector g is given, then the relationship between g and Z can be expressed as follows.
To minimize the random error vector e and estimate the unknown RSM approximation coefficient vector AR, a least squares function is applied as follows.
Applying the approximation coefficient calculated from Eq. (5), the quadratic regression approximate model is expressed as follows.
An RSM approximate model of Eq. (6) is generated for each response function using the results of the DOE techniques (OAD, BBD, and CCD). Fig. 8 shows the response surface results of DF-#1 and DF-#5 (design factors with high main effect), and for LC3 (the braking case maximum stress response function) using the CDD method among the RSM approximate model results.
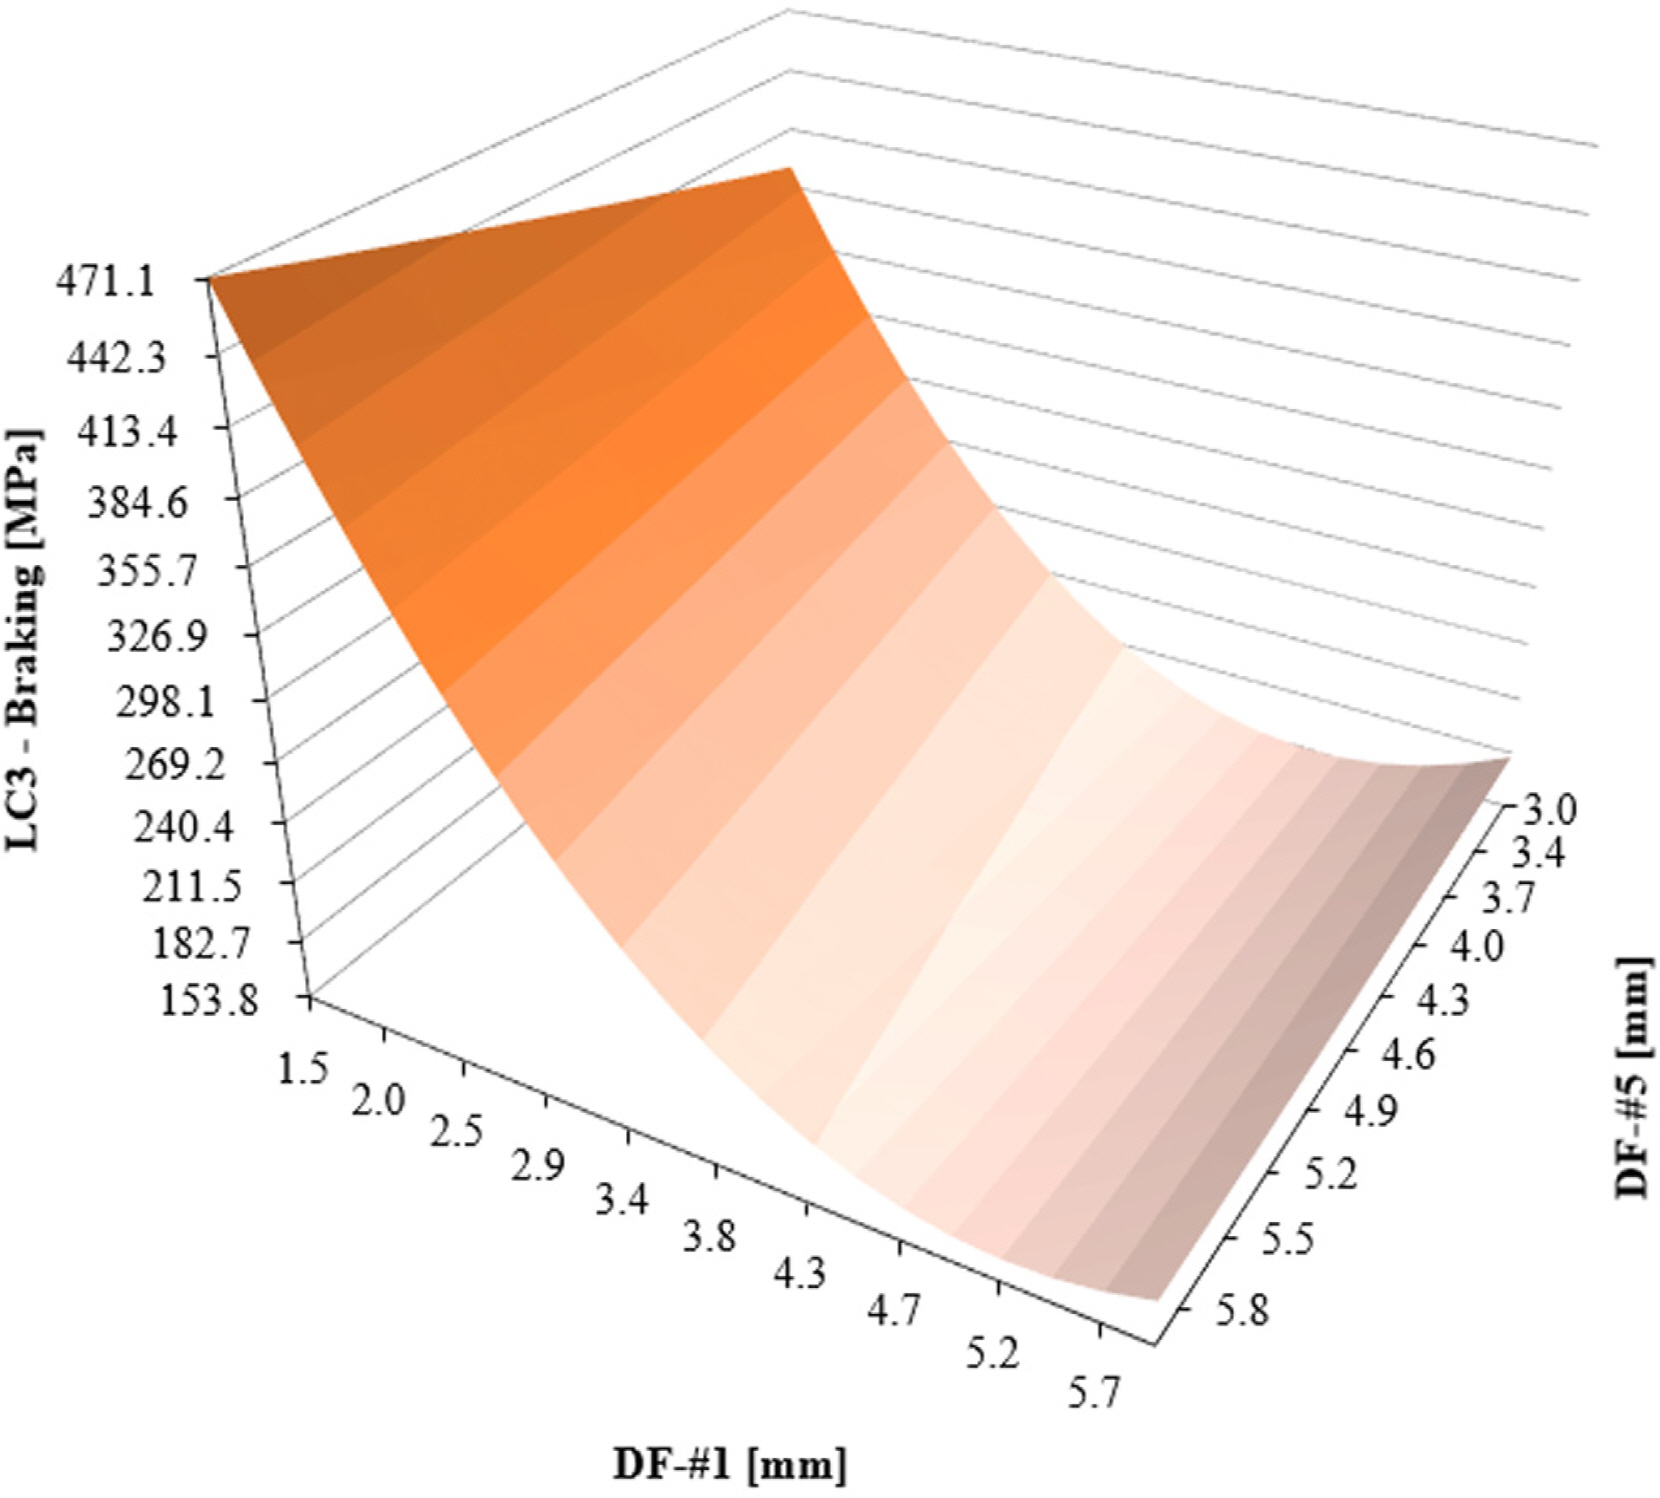
Response surface result for LC3 from the CCD method
As shown in Fig. 8, the RSM, a quadratic regression approximate model, effectively approximates the nonlinear design space of von-Mises stress, the LC3 response function.
The accuracy of the approximate model calculated from each DOE method is determined by R2 as shown in Eq. (7).

Comparison of RSM accuracy
As shown in Table 11, the accuracy of the approximated RSM was very high for each response function. The accuracy of the approximate model of weight was 1.0, which signifies no difference with the actual value for all DOE techniques. In terms of the accuracy of the approximate model for the response function under each design load case, an error of less than 3% of the actual value was observed, and the difference between DOE methods was found to be very small. Therefore, this study found that the overall DOE implementation method used to analyze the sensitivity of major structural members and explore enhanced design cases of the AOSC’s structure was reasonable, which includes the number of experiments, levels of design variables, and DOE method selection.
4. Conclusions
To efficiently derive a design improvement case that secures the design safety of the AOSC, this study explored best design cases applying various DOE techniques, conducted a sensitivity analysis of major structural members, and compared the results according to DOE characteristics. The key findings of this study are summarized as follows.
The structural analysis results of the initial design stage demonstrated that design improvements are required to secure the strength and safety of the AOSC’s structural design. For this purpose, the influence of the major design members on strength performance was analyzed using DOE, and design improvement cases that satisfy the allowable stress while minimizing weight increase were explored.
Among the three DOE methods considered in this study (OAD, BBD, and CCD), the best design case in all DOE methods satisfied the allowable yield stress at a level in which the maximum stress was similar for all design load cases compared to the initial design, although there was a variation in weight. The weight increase rate of CCD was lower than that of OAD and BBD, and that of BBD was the highest. Considering the weight increase rate and the number of experiments of DOE, which represents the numerical calculation cost, CCD was shown to be the most efficient method for deriving improvement cases for the AOSC’s structural design.
Given that the design problem investigated in this study in relation to CCD involves the nonlinear response characteristics of stress and five design factors, it was found that the most suitable method to evaluate the main effect and generate a high-accuracy approximate model is to conduct 43 runs of three-level experiments.
As demonstrated in the structural design sensitivity analysis, in all DOE methods, the effect of the main frame (DF-#1) was greatest on the maximum stress of the weight and design load cases, and the strength of the collector frame (DF-#4) showed the lowest significant effect. The main effect on weight was nearly identical in all DOE methods, while that on the strength of DF-#1 in BBD was higher than the other DOE methods.
To verify the suitability of the sensitivity analysis results of major structural members and the exploration of DOE-based AOSC improvement cases applied in this study, approximate modeling using RSM was conducted for each DOE technique. The design space exploration accuracy of RSM generated from each DOE method was examined. According to the results, the accuracy of the approximate model did not differ from the actual value in all DOE methods, and in terms of the accuracy of the approximate model for the response function under each design load case, an error of less than 3% of the actual value was observed, and the difference between DOE methods was found to be very small.
This study found that the overall DOE implementation method used to analyze the sensitivity of major structural members and explore enhanced design cases of the AOSC’s structure was reasonable; this includes the number of experiments, level of design variables, and DOE method selection. The DOE method-based design exploration approach proposed in this study is considered to be useful for enhancing the design performance of ocean and fisheries equipment that rely on empirical design techniques or must apply new designs.
Acknowledgements
This paper has been written with the support of Jeollannam-do (‘2019 R&D supporting program’ operated by Jeonnam Technopark), and was supported by X-mind Corps program of National Research Foundation of Korea(NRF) funded by the Ministry of Science, ICT (No. 2019H1D8A1105567).
