Experimental Study of Load Characteristics of Buried and Exposed Large-Diameter Pipelines Using Fiber-Optic Strain Sensor
Article information

Abstract
In this study, an optical-fiber sensor was used to measure loads that could act in an environment similar to the loading conditions that exist in an actual pipe. The structure and the installation method of the optical-fiber strain sensor were applied considering the actual large pipe and the buried pipe environment. Load tests were performed using a displacement sensor and sandbags to determine the deflection of the pipe according to the external load, and the linear measurement results were verified. Considering the conditions that could exist in the actual pipe, the test method was presented, and the strain of the buried pipe generated at this time was measured.
1. Introduction
Among the optical sensors that have recently gained attention across various fields, fiber-optic strain sensors, which involve the use of optical fibers, have been classified as intensity, interferometric, and fiber Bragg grating (FBG) sensors based on the measurement method. The distributed sensing technology has recently been developed through the popularization of optical components (Culshaw et al., 2008). Developments in fiber-optic sensor technology advanced with the commencement of research on FBG sensors in the 1990s (Meltz et al., 1989; Hill and Meltz, 1997).
Fiber-optic sensors have the following advantages owing to their structural characteristics: they are unaffected by external electromagnetic waves, can transmit signals over long distances, and enable multiplexing, making it convenient to connect numerous sensors. They also have remarkable durability, with a durability life of 20 years. In civil engineering, FBG sensors have been used to monitor large civil engineering structures, such as bridges and tunnels, and they have recently been applied in mechanical engineering. An FBG creates a permanent refractive index modulation on the core in the longitudinal direction of the optical fiber and uses this modulation as a sensor. Fig. 1 shows a schematic of an FBG structure. When a periodic refractive index modulation is made, a coupling is generated between the propagation mode and the reflection mode, and thus, reflects a particular wavelength.

Characteristics and structure of fiber bragg grating
The wavelength reflected by FBG is determined by the spacing and refractive index modulation of the core. Eq. (1) is used to describe this property:
The half-wavelength of the FBG is influenced by external temperature and stress. The refractive index of the core varies with temperature, hence, changing the reflection wavelength. Moreover, the grating spacing changes with stress and consequently changes the reflection wavelength. These changes are described using the following equation:
Generally, the effective photo-elastic coefficient of a single-mode optical fiber is 0.22. The Bragg center wavelength modification owing to the stress applied in the axial direction of an FBG made from a single-mode optical fiber is generally adopted as 1.4 pm/microstrain in a 1,550 nm band. Additionally, the Bragg center wavelength shift because of temperature change is 10 pm/°C.
A photosensitive single-mode optical fiber that responds to light in the ultraviolet region is used to produce an FBG. Photosensitivity is increased by injecting hydrogen into the core at high pressures or by doping Ge. A phase mask is used to create a periodic refractive index modulation in an optical fiber with increased photosensitivity. The phase mask generates a periodic interference shape through the diffraction effect of light. As shown in Fig. 2, an excimer that generates light within the range of 190–250 nm, and an Argon laser with a frequency multiplier, are used to generate ultraviolet light, which is transmitted through the phase mask on the photosensitive optical fiber. The pattern with periodic intervals passing through the phase mask generates a periodic refractive index modulation in the optical fiber, thus, producing the FBG. Fig. 3 shows the wavelength characteristics of the FBG.

Fiber bragg grating fabrication method using UV laser and phase mask
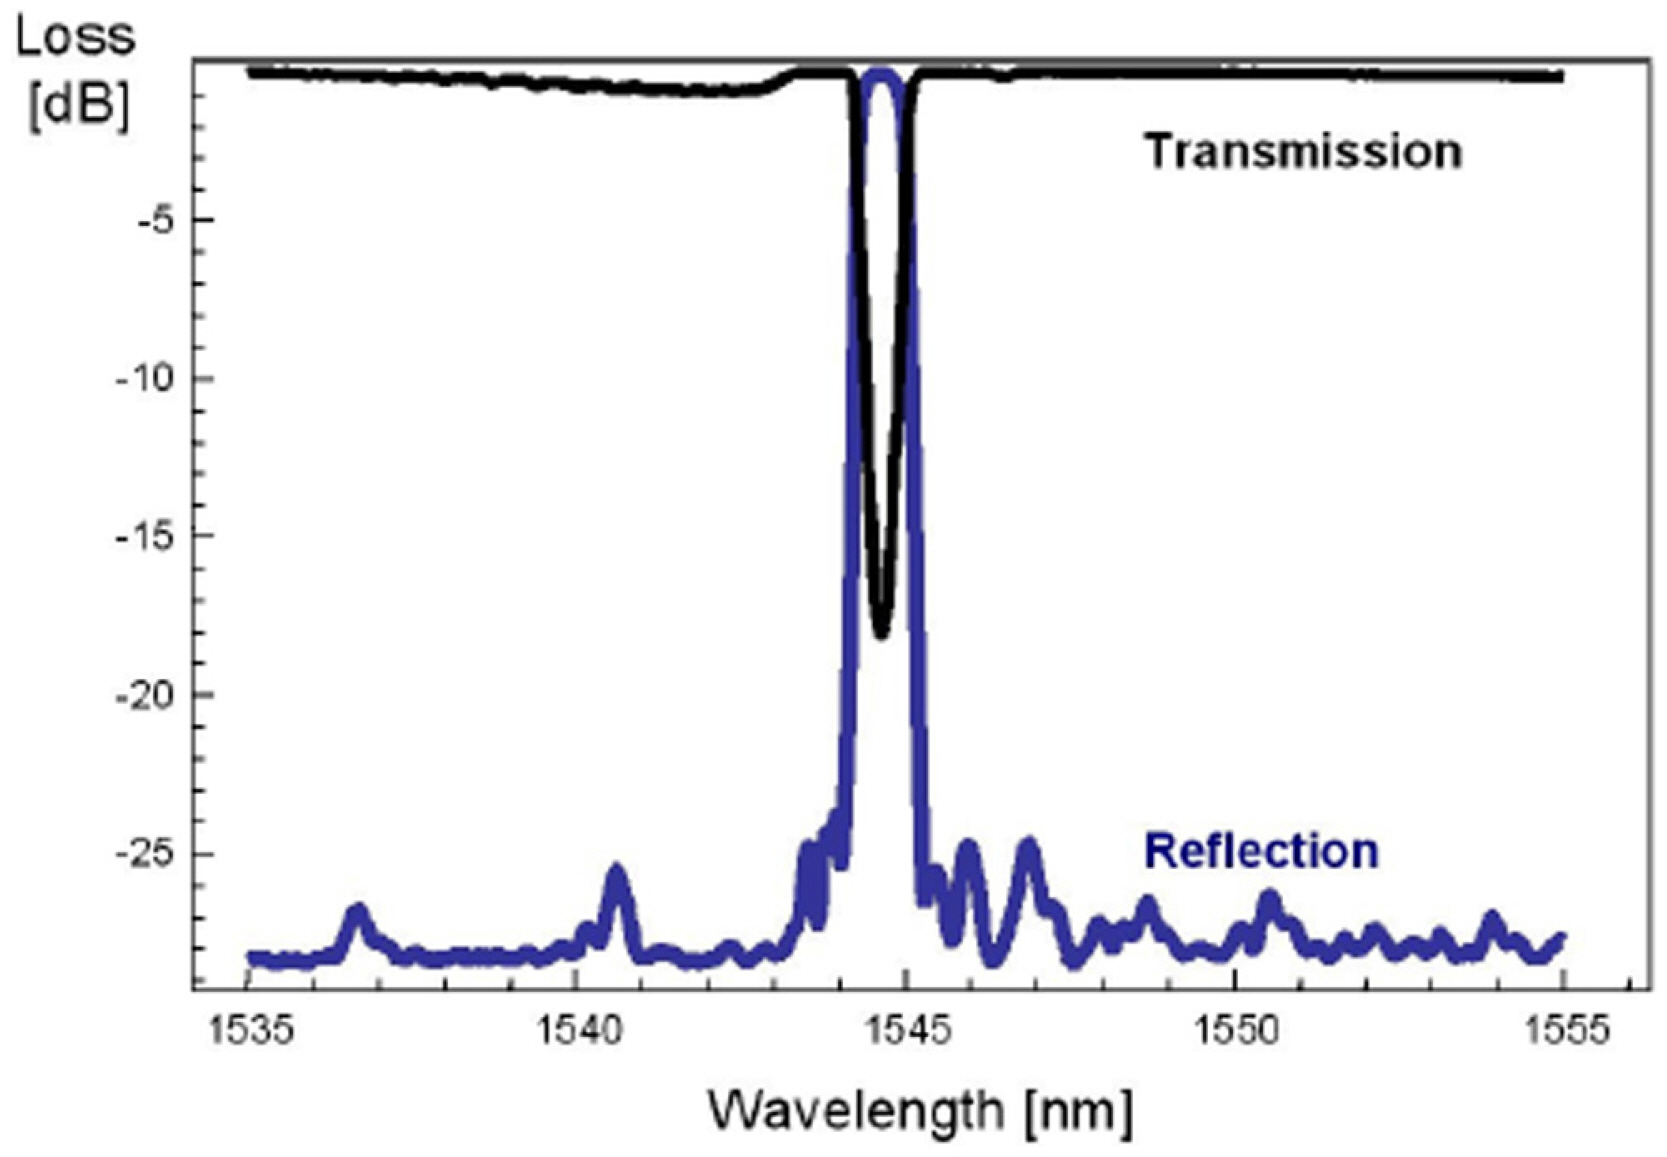
Reflection and transmission spectrum of fiber bragg gratings
As shown in Fig. 3, the light reflected by the optical fiber grating is transmitted in the direction of the incident optical fiber. This transmitted light is reflected and returns with the physical quantity information to the point where the FBG is located. The sensors can be multiplexed, assuming that the structure has light sources that can generate various light types and that gratings with different Bragg center wavelengths are connected in series. Therefore, the FBG can be structured with multiple sensors connected in series to one optical fiber, which can be advantageous depending on the application. A highly effective method for achieving integration in the structure is to use several serialized sensors without additional parallel connections. Because the sensor signal is transmitted to the optical fiber, an amplifier is unnecessary for a distance up to several kilometers. The FBG can be used in various temperature ranges owing to its wide operating temperature range.
In this study, the technique for measuring the load generated in a pipe was applied by adding a sensor assuming that humans can access buried pipes. This dynamic technique can be used for taking up to 100 samples per second by measuring in a specific area where the sensor is installed. Regarding previous studies, for a monitoring method that is used to confirm the related reaction according to load that can act externally (Jeong et al., 2017; Lee et al., 2016), a fiber-optic sensor-based method using a Brillouin distributed sensor through a scattering system capable of strain and temperature measurements was used. Although this method can be used to measure the entire section, several seconds of analysis time are required during the measurement. In addition, pipes buried underground are continuously impacted by external loads, such as soil pressure, vehicles, and ground settlement. In particular, pipes buried in the soft ground are known to be significantly influenced by ground settlement (Hong et al., 2006). Based on measurements using an electric strain sensor, the soft ground has complex characteristics owing to its engineering properties, and when the ground has low strength and an extended depth, large deformation (such as settlement) occurs. Loads acting on pipes include primary loads (such as internal pressure, pipe self-weight, soil pressure, vehicles, and trains) and longitudinal loads (such as wind, snow, temperature variations, earthquakes, and third-party construction loads). The stresses acting on pipes include circumferential stress, axial stress, and synthetic stress.
In this study, the stress and deformation behavior of buried pipes were examined, considering the loading position. Based on the findings of referenced studies, a test method was proposed considering the displacement and stress tests of the buried pipe using fundamental data. Tests of the basic design and characteristics, as well as tests on pipes with similar conditions to actual pipes, were performed, and their results were analyzed.
2. Review of Theoretical Loads on Buried Pipes
Ryu et al. (2017) conducted a numerical analysis to evaluate the effects of applied surface loads near and at the upper part of a buried pipe. Based on the results, the maximum displacement of the buried pipe decreased almost linearly as the loading position became farther away, regardless of the size of the buried pipe for the same buried depth. Moreover, the maximum stresses generated in the buried pipe were similar irrespective of the variations in diameter for the same pipe thickness, and for low thicknesses, the changing pattern varied with the loading position. Hence, the stress behavior of the buried pipe according to the loading position was found to be dependent on the pipe thickness. Next, the maximum displacement of the buried pipe with respect to the loading position was generated when the line of action of the distributed load coincided with the centerline of the buried pipe. When the distributed load acted on the upper part of the buried pipe, the degree of change in the displacement was not significant, even when the loading position was changed partially. Furthermore, when the distributed load was not applied to the vertical upper part of the buried pipe, the stress value decreased as the loading position increased. At extended buried depths, the loading position scarcely showed any impact. Finally, the maximum stress of the buried pipe was generated in the section with the surface load on the upper part of the buried pipe. However, compared with when the centerline of the buried pipe coincided with the resultant line of action of the surface load, the stress increased by approximately 10% or more when eccentric loading was applied. In this study, the stress and deformation behaviors of buried pipes were investigated considering the loading position, and a test method was presented considering displacement and stress tests of the buried pipe with fundamental data based on the findings of referenced studies.
3. Load Test Using Displacement Sensor and Fiber-optic Strain Sensor in Exposed Pipe
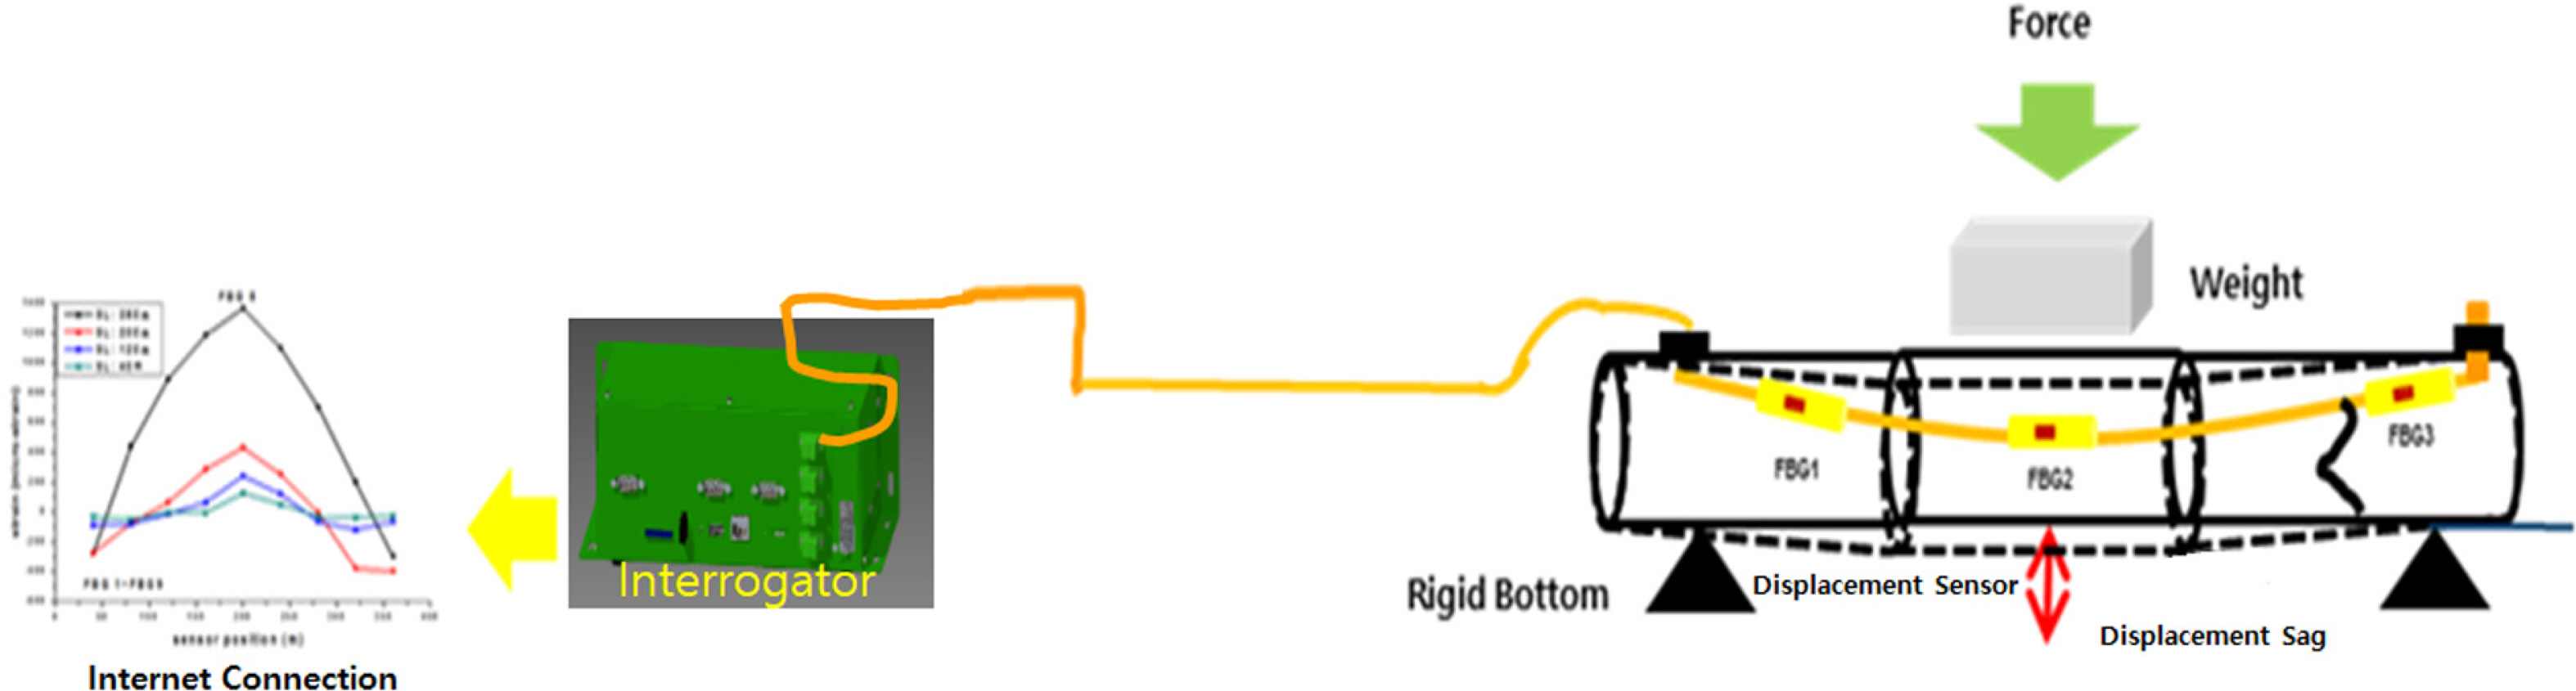
The 1,550 mm FBG sensor measurement equipment and the 100 mm strain sensor using the fiber-optic sensor related to this study were designed and developed by Cytroniq (Lee and Kim, 2011) and were used for the tests. The developed strain sensor was verified according to IEC 61757-1-1 standards (International Electrotechnical Commission, 2016). The fiber-optic sensor property of enabling connection in series was utilized, and the fiber-optic sensor was designed and manufactured to suit the test objectives. First, as the deflection displacement could be measured in the exposed pipe, the load test of the pipe was performed using the fiber-optic sensor (Fig. 4). The fiber-optic sensor and the displacement sensor were used to record the generated displacement in the pipe after applying incremental loads to determine the pipe displacement according to the load acting in the gravity direction of the pipe.
Block diagram of load testing and monitoring system for fiber strain sensor at exposed pipeline
As shown in Fig. 5, the equipment was designed, considering the overall conditions in the pipe such that the fiber-optic strain sensor could be installed inside a 1 m diameter pipe (1,000 mm diameter steel-coated pipe for water supply (KSD 3578)). Tests were conducted to measure the deflection displacements of the exposed pipe. The fiber-optic sensor was installed inside the pipe, the span between the supports of the pipe was fixed, and the changes in stress owing to increased load were measured. Fiber-optic strain sensor and displacement sensor-installed tests were carried out to determine the changes in the strain and displacement generated in the pipe. A fiber-optic strain sensor was installed at the upper center of the 1 m diameter pipe, and the span of the pipe supports was maximized.

picture of installation for fiber optic strain sensor at internal pipeline
Incremental measurements were performed to generate external loads at the upper part of the pipe using 10 sandbags weighing 20 kg each. A displacement sensor was installed at the lower part of the center to determine the deflection due to loading. Fig. 6 shows the displacement sensor installed at the lower part of the pipe.

picture of Load testing using sandbag and monitoring system using displacement sensor at exposed pipeline
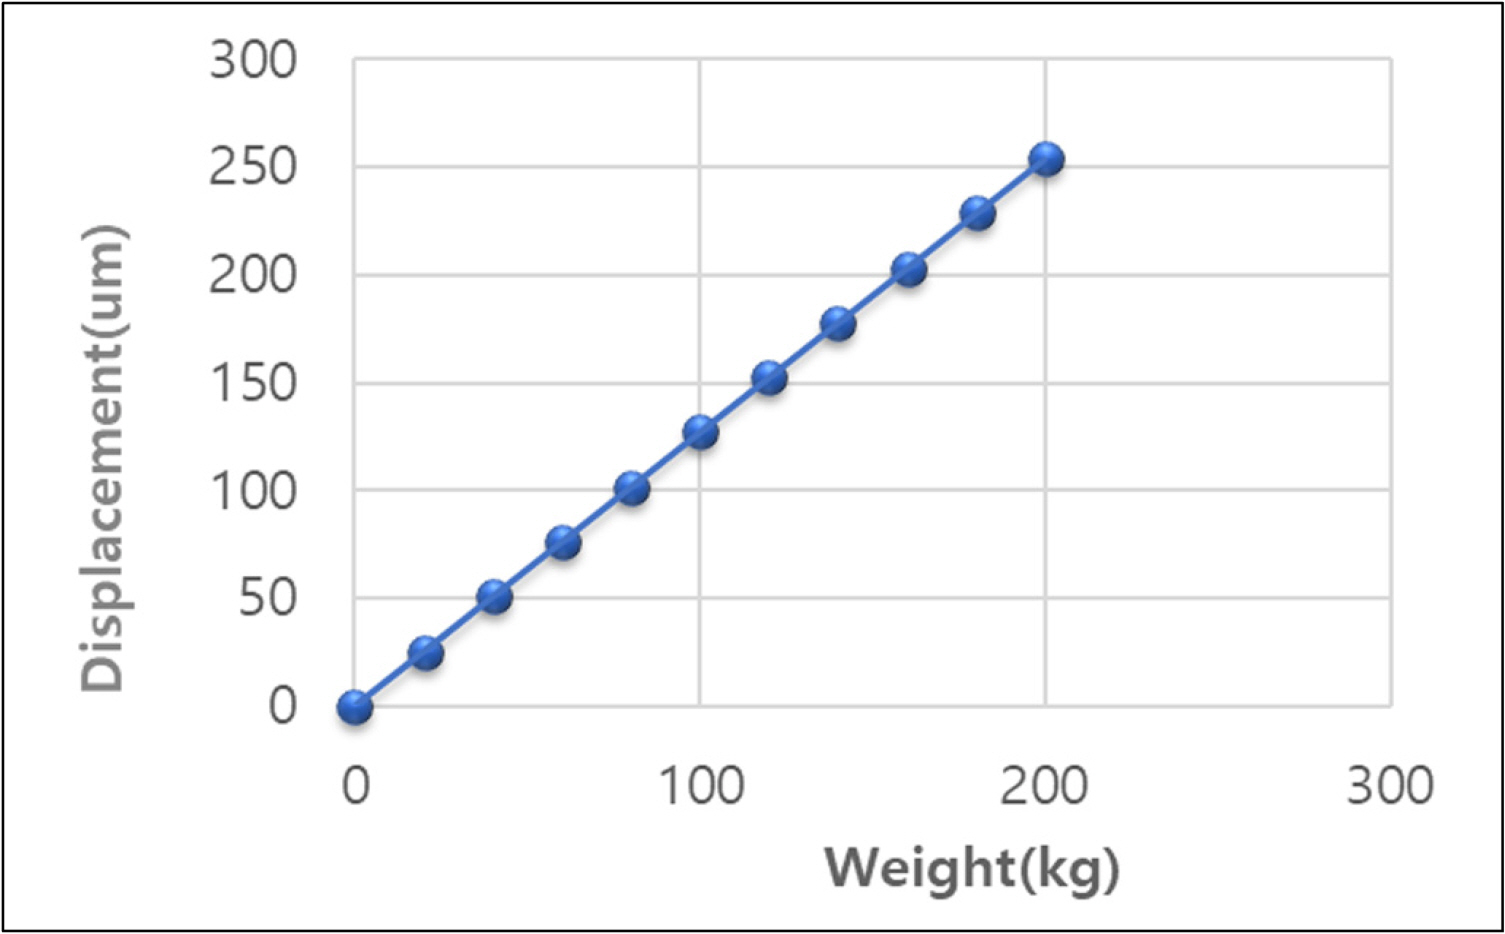
From the measurements, as shown in Fig. 7, when a 200 kg load was applied to the center, a deflection of 254 μm occurred, which changed sequentially as the load was increased in steps of 20 kg.
result of weight versus displacement sensor
The following are the strain results of the fiber-optic sensor internally installed at the upper part when the same load was applied. They describe the results for incrementally applied and removed 20 kg sandbags at the upper center of the exposed pipe. As shown in Fig. 8, when a 200 kg load was applied, a 5 pm change in wavelength occurred. As shown in Fig. 4, because the installation direction of the strain sensor was towards the upper part of the pipe, the strain varied owing to bending at the upper part of the pipe when a load was applied. Additionally, the behavior in which the space between the sensors narrowed according to the degree of bending was observed. Thus, the wavelength, which indicated the strain, was expressed as the change from the reference wavelength to the short wavelength. These test results confirmed that a maximum of 3.5 microstrains was generated, compared to when no load was applied.

result of weight versus wavelength shift
4. Load Test Using Fiber-optic Strain Sensor in Buried Pipe
As depicted in Fig. 9, a strain sensor was installed inside the buried pipe to measure the stress in the buried pipe, and the load received when 8-ton heavy equipment (truck) moved on the surface was measured. First, the heavy equipment performed four sets of forward, stop, and reverse operations, and the strain was measured using a fiber-optic strain gauge. A 15 pm optical strain was measured on the inside, which corresponded to 10 microstrains.

picture and test result of load testing using weight of 8 t truck at buried pipe
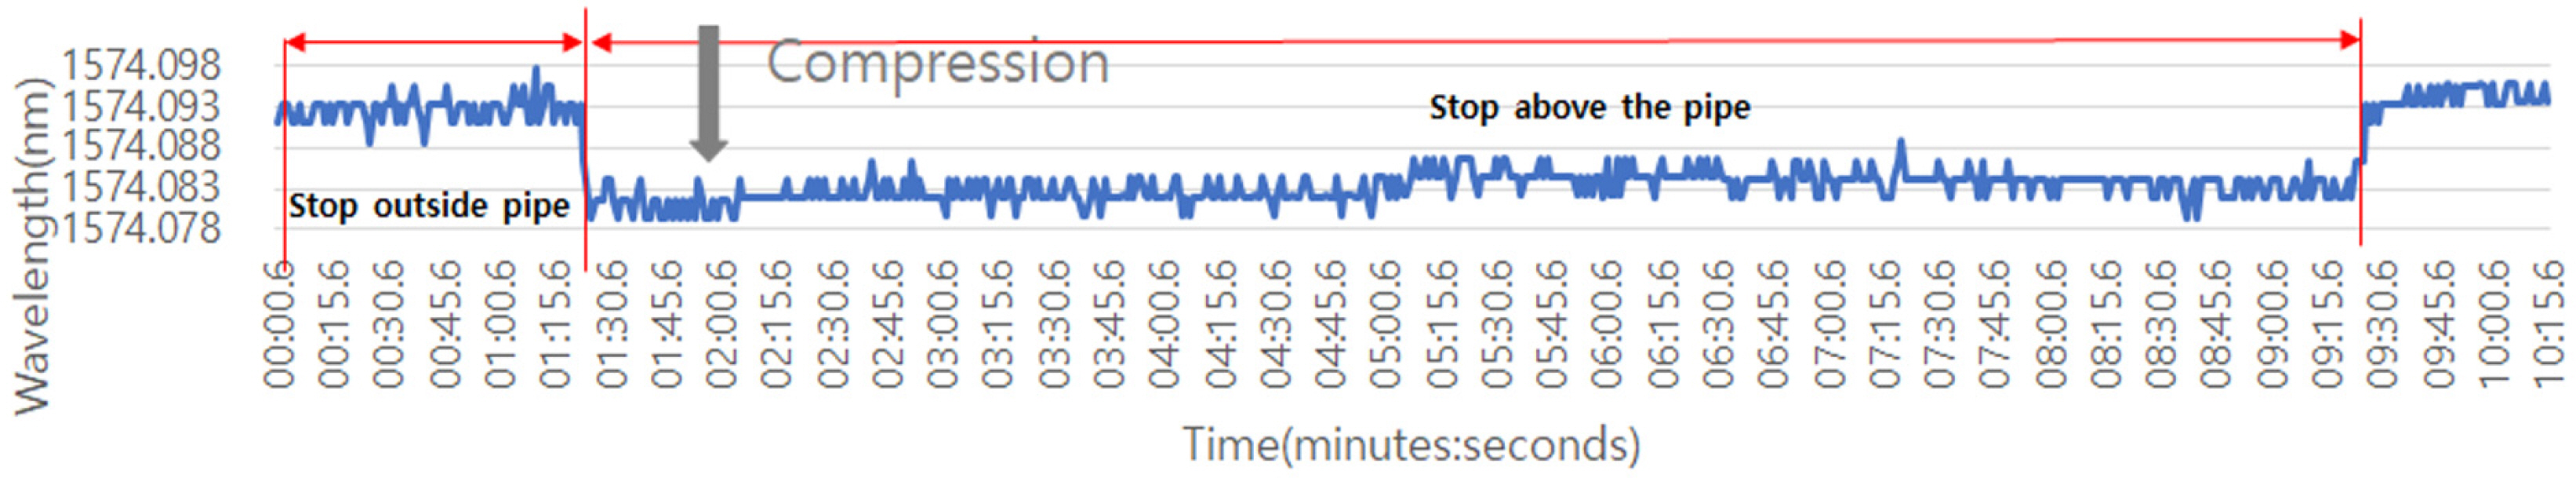
As depicted in Fig. 10, the load received by the buried pipe installed with a strain sensor when an excavator moved on the surface was measured to determine the stress in the buried pipe. The excavator was stopped outside the pipe, started, stopped on the pipe, and then moved, and the fiber-optic strain gauge was used to measure the strain before and after the excavator operations. The excavator performed a set of movement operations, and the strain was measured using the fiber-optic strain gauge. A 10 pm optical strain was measured on the inside, which corresponded to 7 microstrains. This result was determined based on the compressive force.
test result of load and unload testing using weight of 5.88 t pork crane (Excavator) at buried pipe
Fig. 11 shows a photograph of the 5.88-ton excavator used for the experimental tests, and the diagram indicates the movement direction of the excavator on the buried pipe. The excavator was moved such that eccentricity existed at a direction of 45° of the buried pipe installed with the strain sensor. A strain sensor was installed inside the buried pipe to obtain the stress in the buried pipe, and the load received when the 5.88-ton excavator moved on the surface was measured.

test result of unbalanced load (45° direction) testing using weight of 5.88 t pork crane at buried pipe
This Fig. 11 shows the measurement environment where the excavator was moved on the part of the buried pipe installed with the strain sensor to measure the buried pipe stress.
As shown in Fig. 12, a 12 pm optical strain was measured inside the pipe using the fiber-optic strain gauge, which corresponded to 8 microstrains. This result was measured as a tensile force in Fig. 12. The previous test results in Fig. 10 showed that when the load was applied, due to the behavior in which the strain changes because of bending and the shorting of the space between the sensor based on the 45° of bending in Fig. 11, the wavelength was expressed as the change from the reference wavelength to the short wavelength and was measured as a compression value. For the test results in case of Fig. 12, however, it was measured from the reference wavelength to the long wavelength, which resulted in more extended tension than the reference wavelength.

Results of shift / stop unbalanced (45-degree direction) load testing of buried pipelines
Fig. 13 shows the measurement environment where the excavator was moved on the part of the buried pipe installed with the strain sensor. In this case, digging operations were performed to determine the influence of third-party construction on the buried pipe. The excavator performed one set of movement operations and moved in 1 m increments away, including the vertical pipe centerline. After incrementally operating the excavator while moving up to 4 m, it performed three digging operations for each position, and the fiber-optic strain gauge was used to measure the strain at each position.
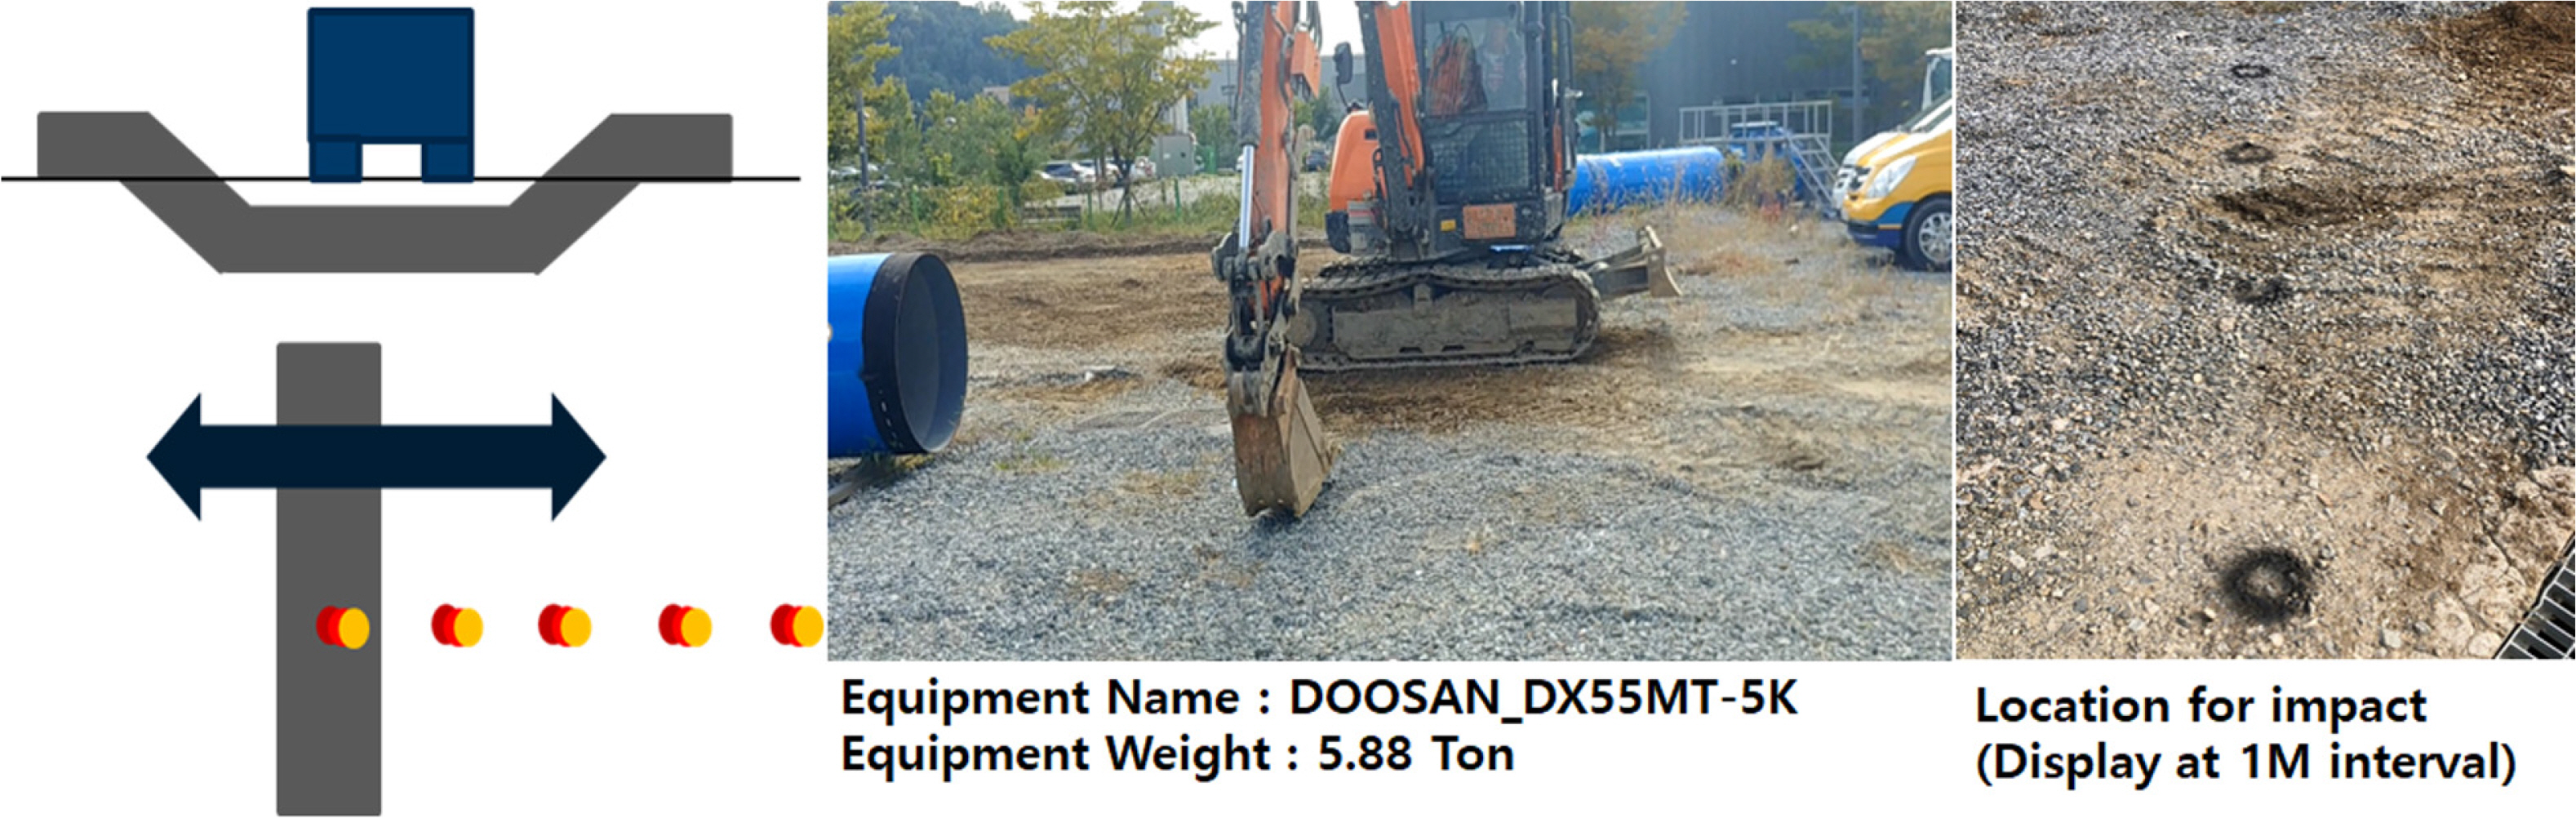
Test of moved impact load on buried pipelines
Fig. 13 depicts the 5.88-ton excavator used for the experiment, and the diagram indicates the movement direction of the excavator on the buried pipe and three digging operations. Fig. 14 is a graph of the measurements of the fiber-optic strain sensor installed in the buried pipe section. In terms of the maximum value measured inside the pipe, when three digging operations were performed on the vertical central axis of the pipe, an optical strain of 20 pm occurred, which corresponded to 14 microstrains. This result was determined as a tensile force. When digging was performed 1 m from the central axis of the buried pipe, the magnitude slightly decreased. Subsequently, because of the sharp decrease in the signal from a 2 m distance, it was difficult to identify the impact of the load. Based on the test results, as the strain caused by the digging increased, it was measured from the reference wavelength to the long wavelength. As this was longer than the reference wavelength, tensile forces were generated.
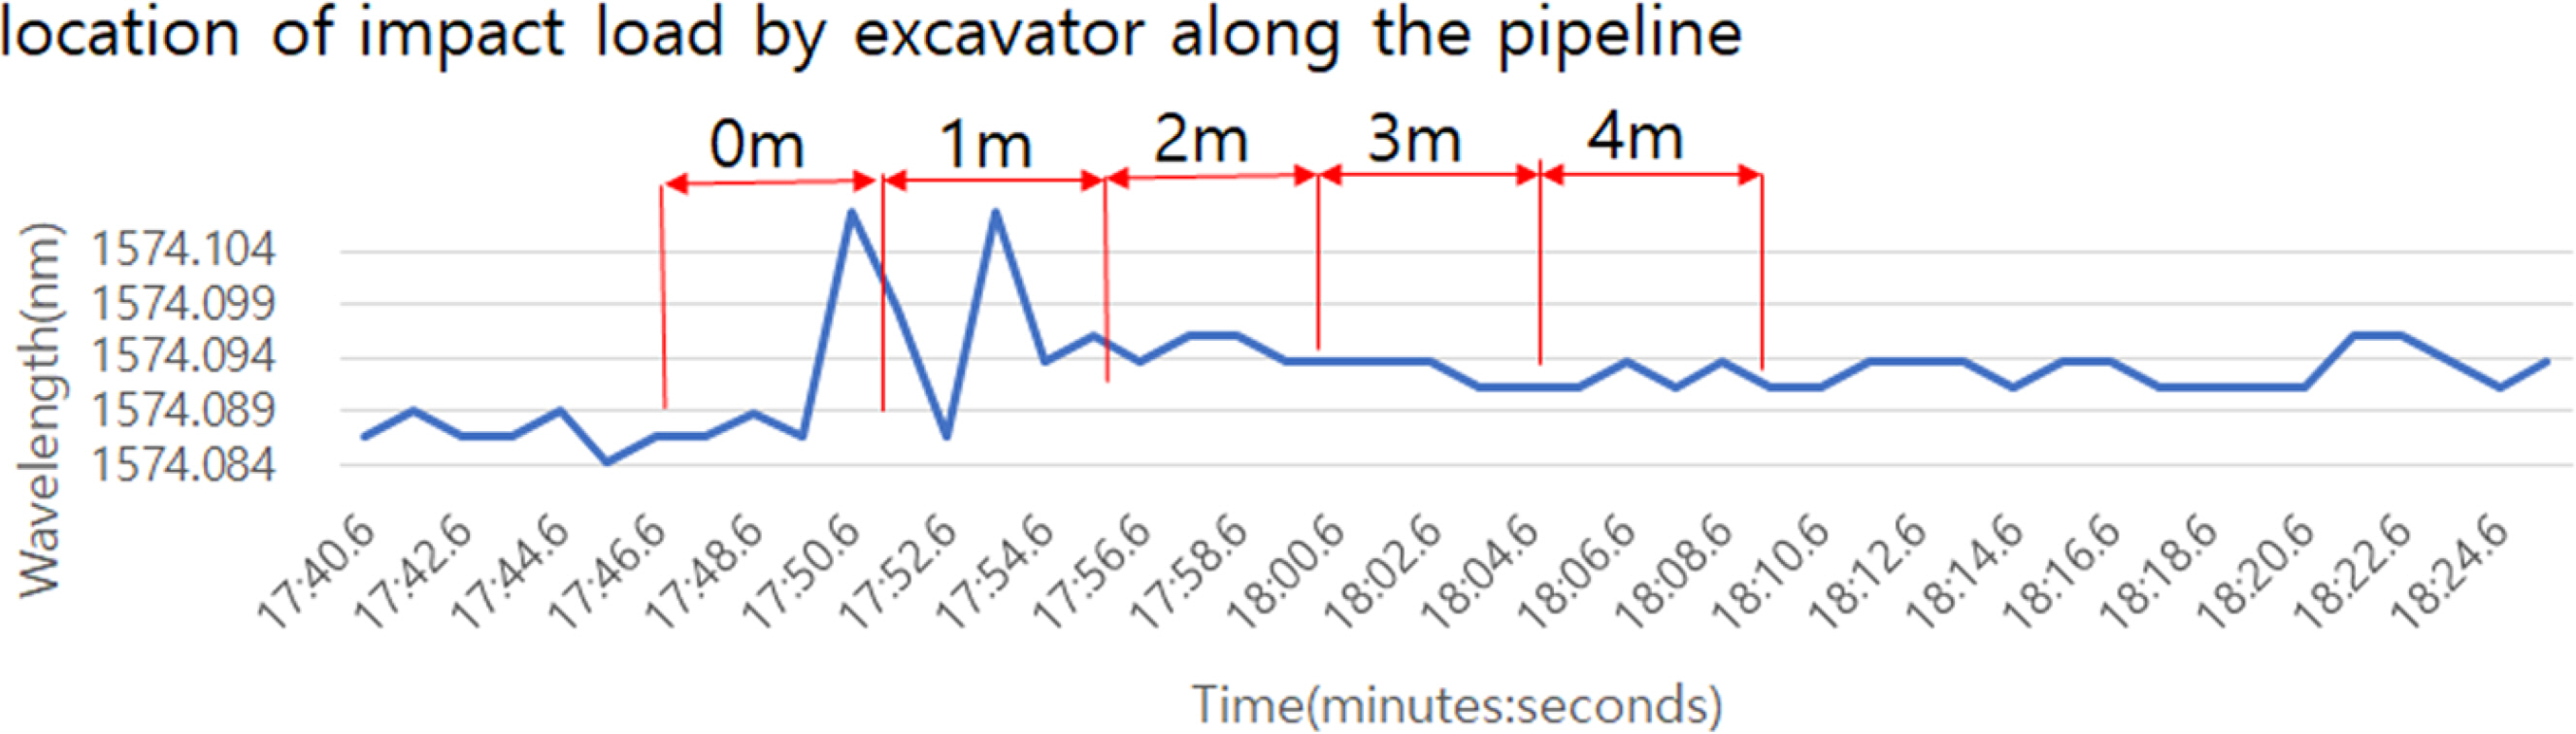
result of moved impact load by excavator on buried pipeline
5. Conclusions and Future Research
Buried pipes are continuously impacted by external loads, such as soil pressure, vehicles, and ground settlement; in particular, pipes buried in the soft ground are known to be significantly influenced by ground settlement. Soft grounds have complex characteristics owing to their engineering properties, and when the ground has low strength and extended depth, large deformations occur, e.g., settlements. In this study, tests were performed using fiber-optic strain sensors and measurement devices installed in actual-scale pipes to investigate the characteristics of the ground and to identify the presence of abnormalities in the pipes. Table 1 lists a summary of the results of the load tests for large exposed and buried pipes using a fiber-optic strain sensor.
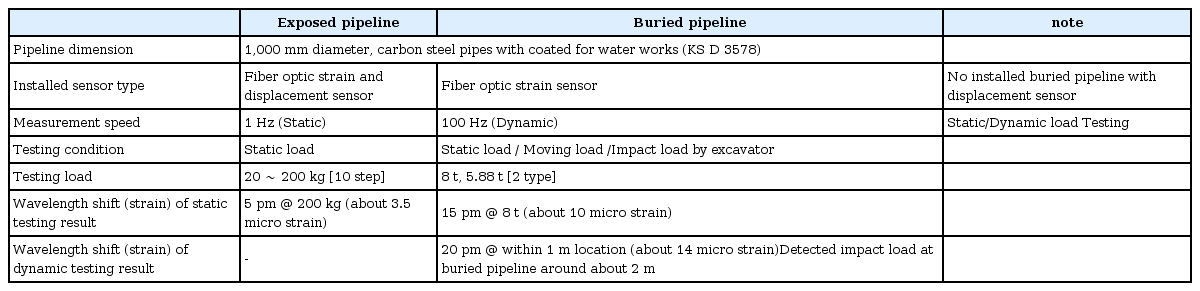
Test results summary of exposed and buried pipeline for load test using fiber optic strain sensor
Fiber-optic sensors were used in this study to measure loads that may occur in an environment similar to loading conditions that act on actual pipes. The installation method and the structure of the fiber-optic strain sensor were applied, considering the piping environment of buried pipes and large pipes in actual use. Load tests were performed using a displacement sensor and sandbags, and linear measurement results were obtained. A test method was presented considering the conditions that may occur in actual pipes, and the strains generated in the buried pipes were measured. Tests were conducted to simulate actual pipe conditions by using a truck and an excavator to perform operations, such as movement and digging, with loads of 8 and 5.88 tons. The results of each test confirmed the phenomena that represent the characteristics that may occur in the field.
By comparing the optical strain of 10 pm measured under a load condition of 5.88 tons above buried pipe ground with an optical strain of 5 pm measured under a load condition of 200 kg on the exposed pipe and the load characteristics, a difference of approximately 15 times was obtained. Through these tests, the resolution of the fiber-optic strain sensor installed in the pipe could perform measurements of 3.5 microstrains or less. These results indicate that this technique can be used to identify the presence of abnormalities in pipes that occur during transportation in various application fields.
Regarding the future research directions, particularly in digging construction including buried pipes and third-party construction, the technique can be developed to detect variations in pipes in caved-in roads owing to leakage and to examine the characteristics of Siberian pipelines, where there is soft ground in a swampy environment because of seasonal changes in summer and winter. In addition, the technique can be applied to pipes in the oil and gas industry that are difficult to access and pipes that change due to the continuously changing characteristics of the ground after the completion of casing work in drilling.

Acknowledgements
This study was funded by Korea Ministry of Environment (MOE) as Service Program for Demand-Responsive Water Supply. (grant No. 127589)