Fire Resistance Characteristics of Firewall Structure Associated with Impact Damage Induced by Explosion
Article information

Abstract
When a fire accident accompanied by an explosion occurs, the surrounding firewalls are affected by impact and thermal loads. Damaged firewalls due to accidental loads may not fully perform their essential function. Therefore, this paper proposes an advanced methodology for evaluating the fire resistance performance of firewalls damaged by explosions. The fragments were assumed to be scattered, and fire occurred as a vehicle exploded in a large compartment of a roll-on/roll-off (RO-RO) vessel. The impact velocity of the fragments was calculated based on the TNT equivalent mass corresponding to the explosion pressure. Damage and thermal-structural response analyses of the firewall were performed using Ansys LS-DYNA code. The fire resistance reduction was analyzed in terms of the temperature difference between fire-exposed and unexposed surfaces, temperature increase rate, and reference temperature arrival time. The degree of damage and the fire resistance performance of the firewalls varied significantly depending on impact loads. When naval ships and RO-RO vessels that carry various explosive substances are designed, it is reasonable to predict that the fire resistance performance will be degraded according to the explosion characteristics of the cargo.
1. Introduction
Fire and explosion are high-risk accidents that can cause financial and environmental damage by causing severe damage to surrounding structures and casualties. Fig.1 summarizes fire/explosion accidents and casualties/injuries on ships based on statistics published by the Transportation Safety Board of Canada (2021). Of 2,599 ship accidents over the past 11 years, 15.47 percent were fire/explosion accidents, with an average of 37 fires/explosions occurring annually. Fire/explosion accidents occur continuously, and complete control is impossible, despite various studies to protect casualties, property, and the environment. Therefore, a damage reduction method based on risk is required and applied to protect the hull from fire accidents. Passive fire protection (PFP), such as fire alarms, sprinkling equipment, and firewalls, has been used to reduce damage from fire accidents. The firewall, one of the representative PFPs, delays and prevents the spread of fire. The characteristics of fires, such as liquid, gas, and electrical fires, that are expected to occur in certain places should be considered when installing firewalls. They should also be designed to maintain fire resistance for a time required by the standard fire curves.
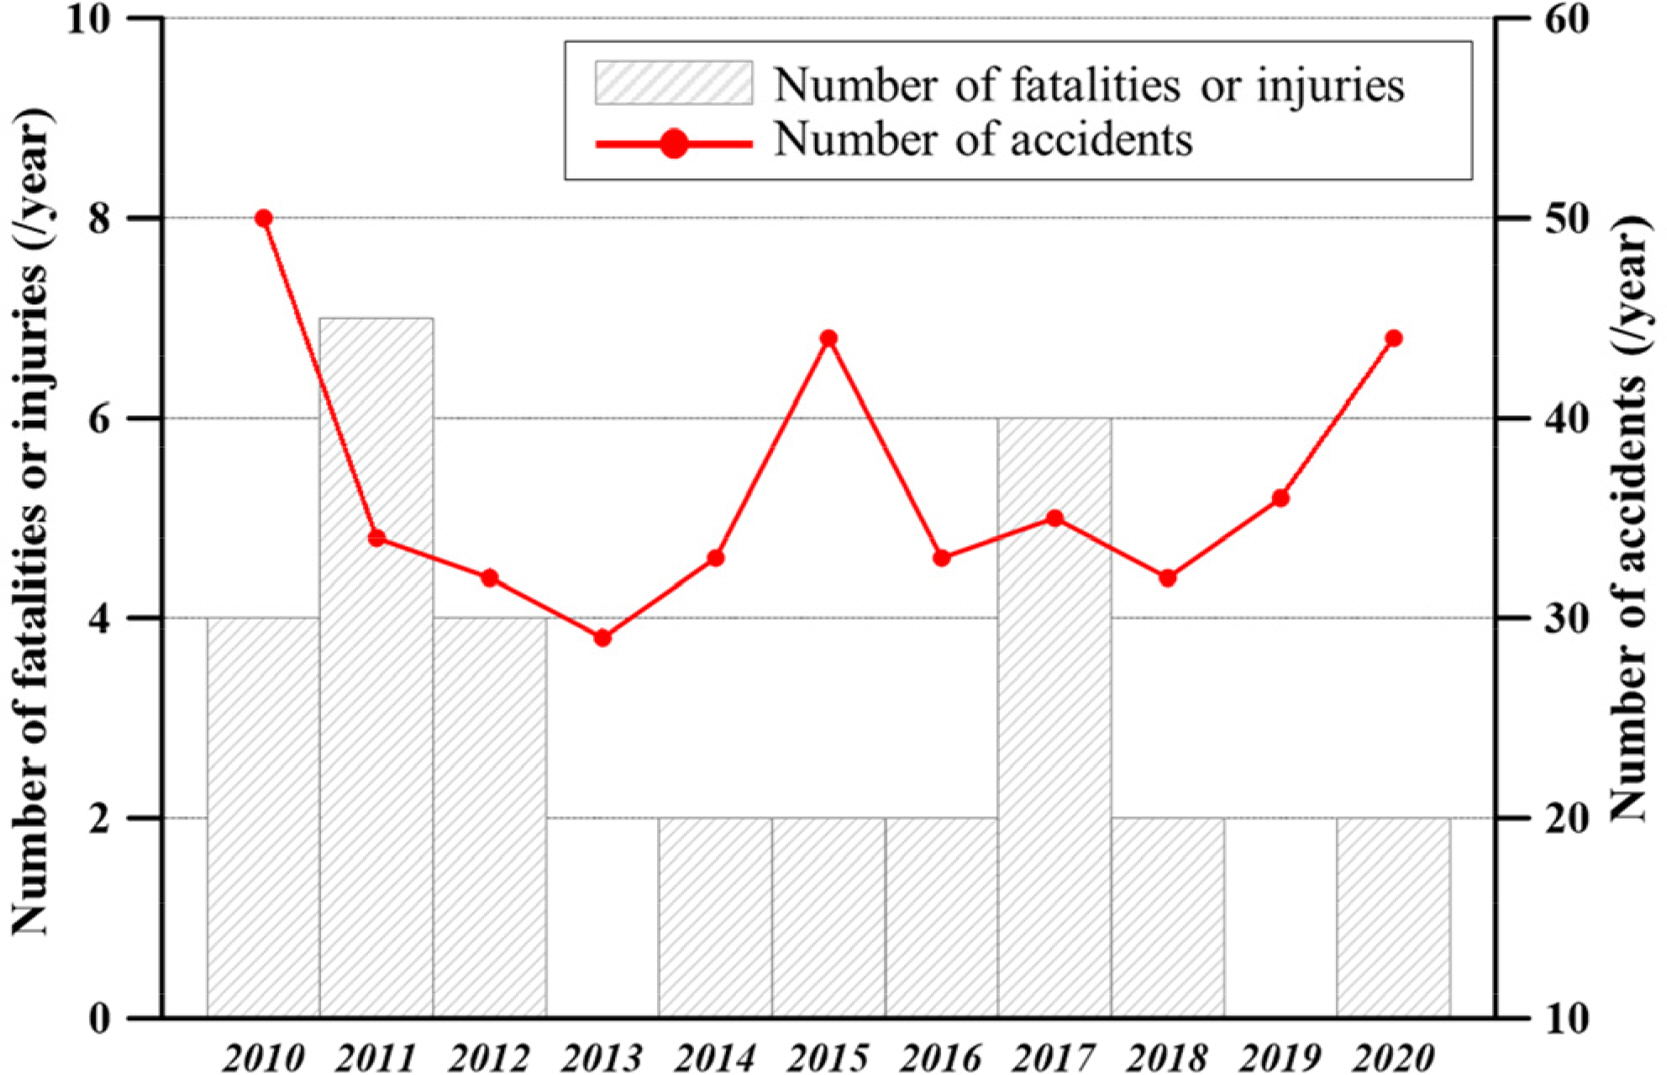
Shipping fire/explosion accidents
Among the varying fire resistance evaluation methods for firewalls, the U.S. Navy stipulates the fire resistance evaluation method of firewalls installed on warships. According to this evaluation methods, a reference impact load acts on the firewall to cause damage. The thermal load is applied to the damaged firewall to evaluate the fire resistance performance (U.S. Department of Defense, 2007). The Safety of Life at Sea (SOLAS) (IMO, 2002) provides evaluation criteria and methods to ensure that intact firewalls meet the appropriate fire resistance during the reference time. Fire and explosion are highly relevant accidents. Hence, the explosive effect should be considered in the design of firewalls in the large compartment expected to the high-risk accident. Nevertheless, the existing SOLAS regulations provide criteria considering fire only.
Choung et al. (2011) analyzed the structural deformation characteristics of the firewall at high temperatures using a numerical analysis method. Kim et al. (2014) and Seo et al. (2017) conducted a thermal analysis of the firewall equipped with PFP under fire accidents. D’Amore et al. (2020) presented a finite element analysis method evaluating the fire resistance performance of fire doors according to the procedure supplied by IMO. Park et al. (2021) experimentally investigated the PFP material characteristics and analyzed the thermal characteristics of firewalls, including the PFP material. Park and Song (2019, 2021) evaluated the fire resistance design by conducting the fire test and heat transfer analysis on A-60 grade fire resistance equipment. Despite the attempts to evaluate the fire resistance performance of fireproof structures, studies on the safety evaluation of firewalls considering the effects of explosions are insufficient. Therefore, this study proposes a methodology to evaluate the fire resistance performance of firewalls considering the impact of explosions when designing firewalls installed in areas with a high explosion risk. The degree of damage and thermal response characteristics of the firewall panels were analyzed quantitatively using the proposed method.
2. Fire Resistance Analysis Procedure of Firewall Considering Explosive Effect
Explosions often lead to fires, depending on the characteristics of combustible materials. But existing firewall design and evaluation methods have limitations in securing sufficient safety against fire and impact damage induced by explosions. This study proposes an advanced methodology that evaluates the fire resistance performance after the impact of explosions acting on firewalls, as shown in Fig. 2.
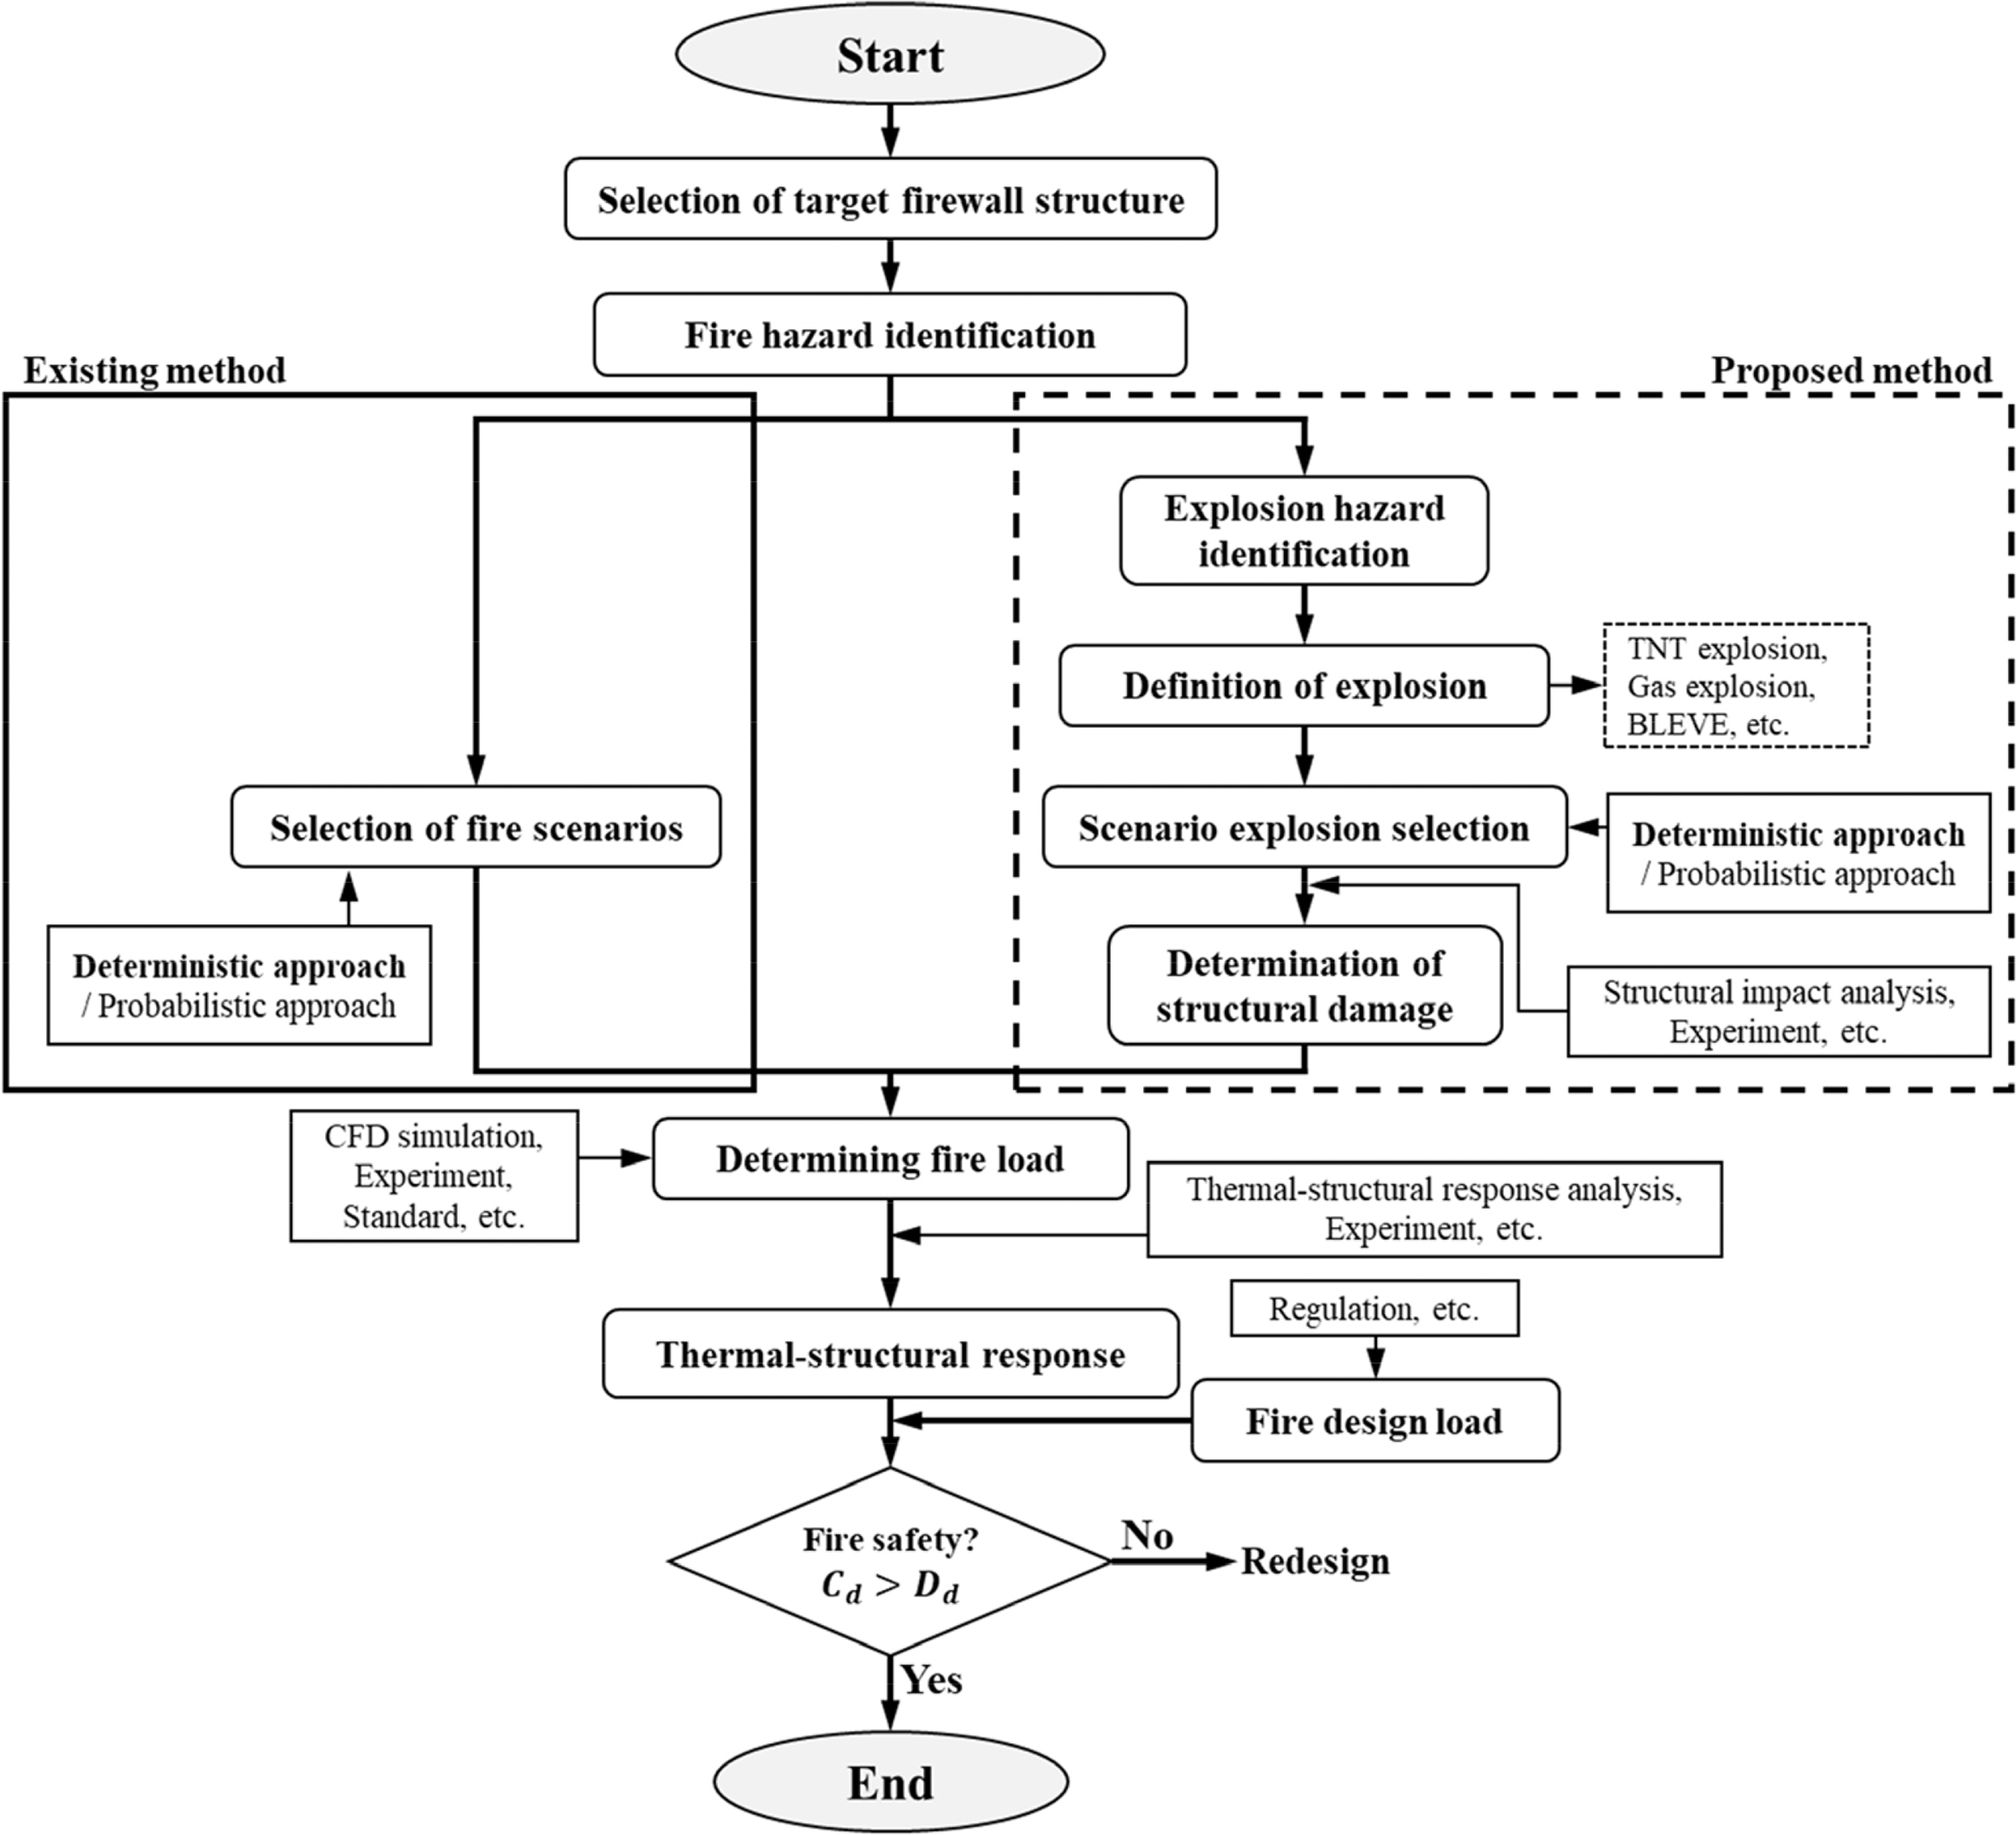
Methodology of fire resistance characteristics analysis
The existing method is described as follows. After selecting a target firewall structure, the likelihood of a fire accident was evaluated qualitatively to discern the hazards. A fire accident scenario is derived based on the fire hazard identified in the “Fire hazard identification” stage, and thermal-structure response characteristics were analyzed by numerical analysis and experiment. The fire resistance of a firewall was evaluated by comparing the capacity design strength (Cd) of the structure determined through the previous process with the demand design load (Dd). The proposed method also proceeds similarly to the existing method, as shown in Fig. 2. This study evaluated the fire resistance performance of firewalls considering the consequences of explosion by supplementing the existing method.
The “Explosion hazard identification” step identified the potential for an explosion by considering the fire resistance materials, explosion conditions, and consequences of an explosion. The “Definition of explosion” is the stage for selecting the form and influential factors of the explosion. The type of explosion among various explosions, such as boiling liquid expansion steam explosion (BLEVE), solid explosion, gas explosion, and dust explosion, and the influential factors of the explosion affecting the structure are defined. The explosion scenario is selected in the “Scenario explosion selection” stage using an existing deterministic or probabilistic approach based on the explosion characteristics defined in the previous stages. In the “Determination of the structural damage” stage, structural impact analysis and experimental methods are used to predict the degree of damage to the firewall. The degree of damage is applied to the firewall. The thermal-structural response characteristics are identified in the “Thermal-structural response” stage through numerical analysis and experimental methods using the damaged firewall defined in the previous stage as the target structure.
3. Example of Application
Recently, battery fires/explosions of electric vehicles are a major risk factor. Accordingly, the vehicle hangar area of the pure car carrier carrying electric vehicles was selected as the location of the accident. Therefore, this study assumed the fire and explosion scenarios that a secondary fire was caused by a hydrocarbon-based combustible substance after the fragment was scattered by the explosive pressure of a small vehicle (fuel tank and battery). The target firewall will be damaged by impact and thermal loads of fragments induced explosion and fire.
The scatter of fragments caused by explosions was assumed, and the shape and initial velocity of the fragments were considered the influential factor. The solid explosive pressure of a compact car is converted to the TNT (trinitrotoluene) mass using the TNT equivalent method. Fig. 3 shows a schematic diagram of the application of the proposed method. Structural damage and thermal-structural response characteristics of firewall structures were analyzed consecutively using commercial finite element analysis code (Livermore Software Technology Corporation, 2018) through impact analysis and thermal response analysis.

Target location and fire resistance characteristics analysis scenario of the firewall
3.1 Target Structure
A typical firewall panel that can be installed in a large compartment of ship and connected by a channel was selected as the target structure, as shown in Fig. 4. The firewall panel is a structure with mineral wool, one of the PFP materials, built between frames made of steel. Fig. 4 presents the main dimensions of the target structure, and each element was modeled in a hexahedron sharing eight nodes. As shown in Fig. 5, convergence studies were conducted to select the optimal mesh size. Convergence was reviewed in terms of the maximum Von Mises stress and maximum equivalent strain for each of various element sizes (20 mm × 20 mm, 10 mm × 10 mm, 6 mm × 6 mm, 5 mm × 5 mm, and 3 mm × 3 mm), and it was selected as an element size of 5mm×5mm according to the result. The range expected to be affected by the impact load was applied fine element, and another range applied a coarse mesh; Table 1 provides information on model elements.
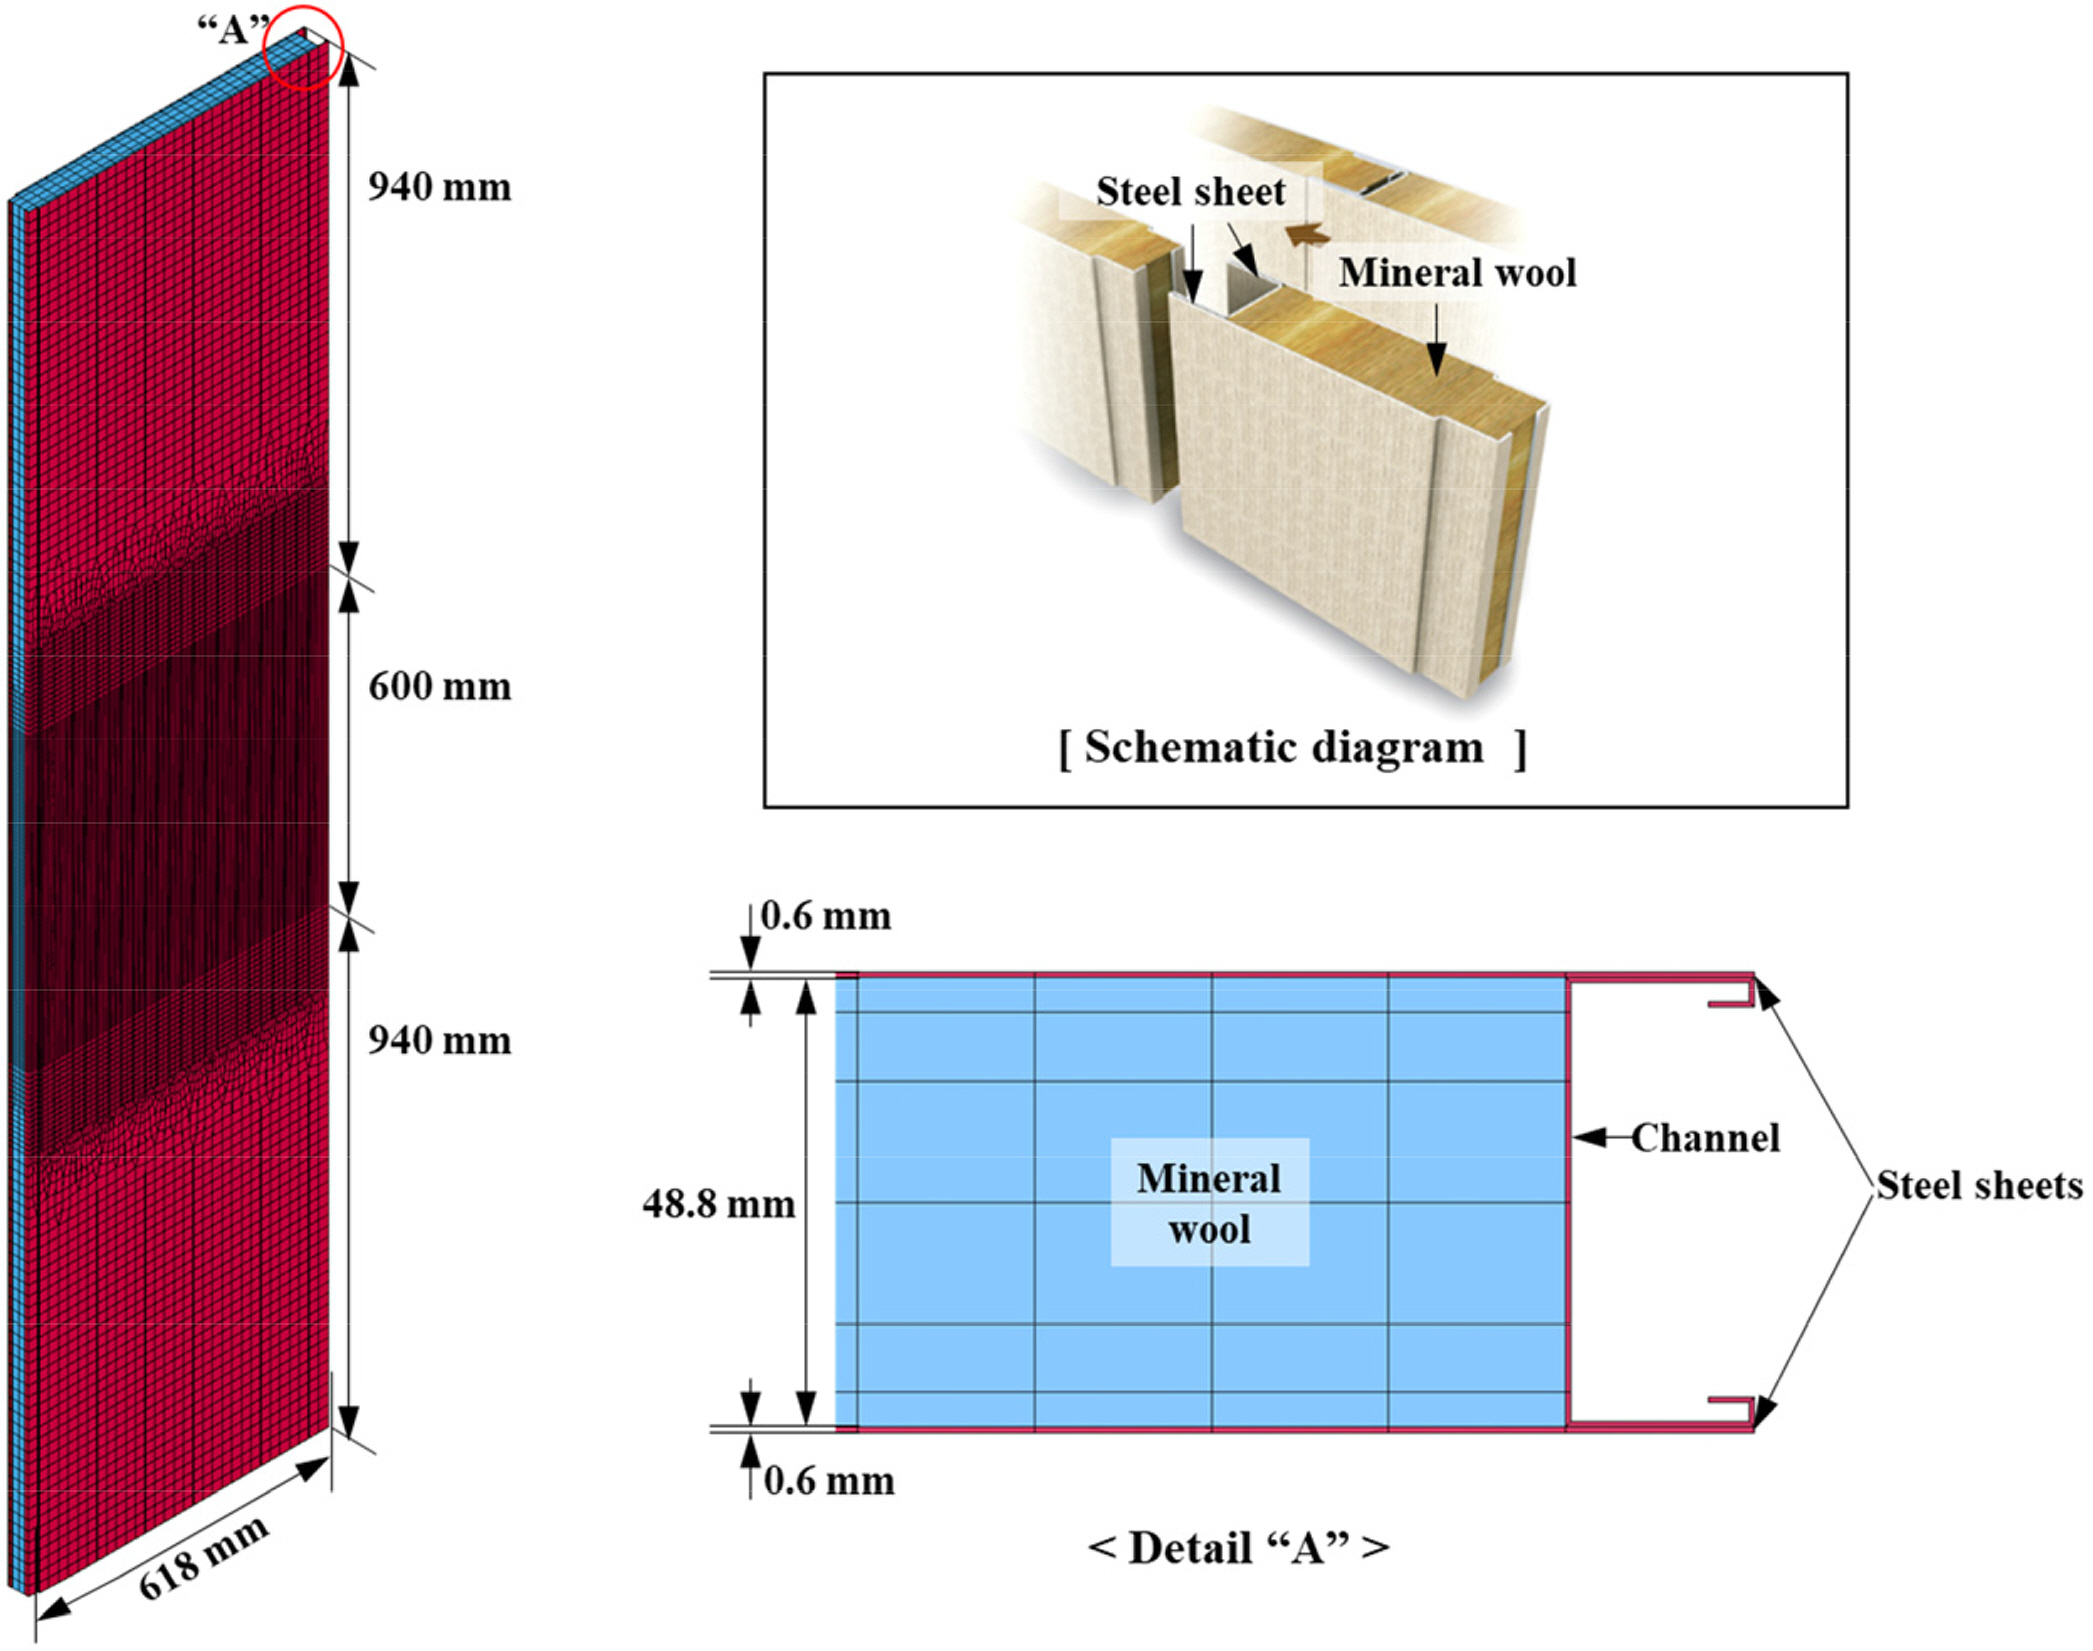
Schematic diagram and FE (Finite element) model of the typical firewall panel
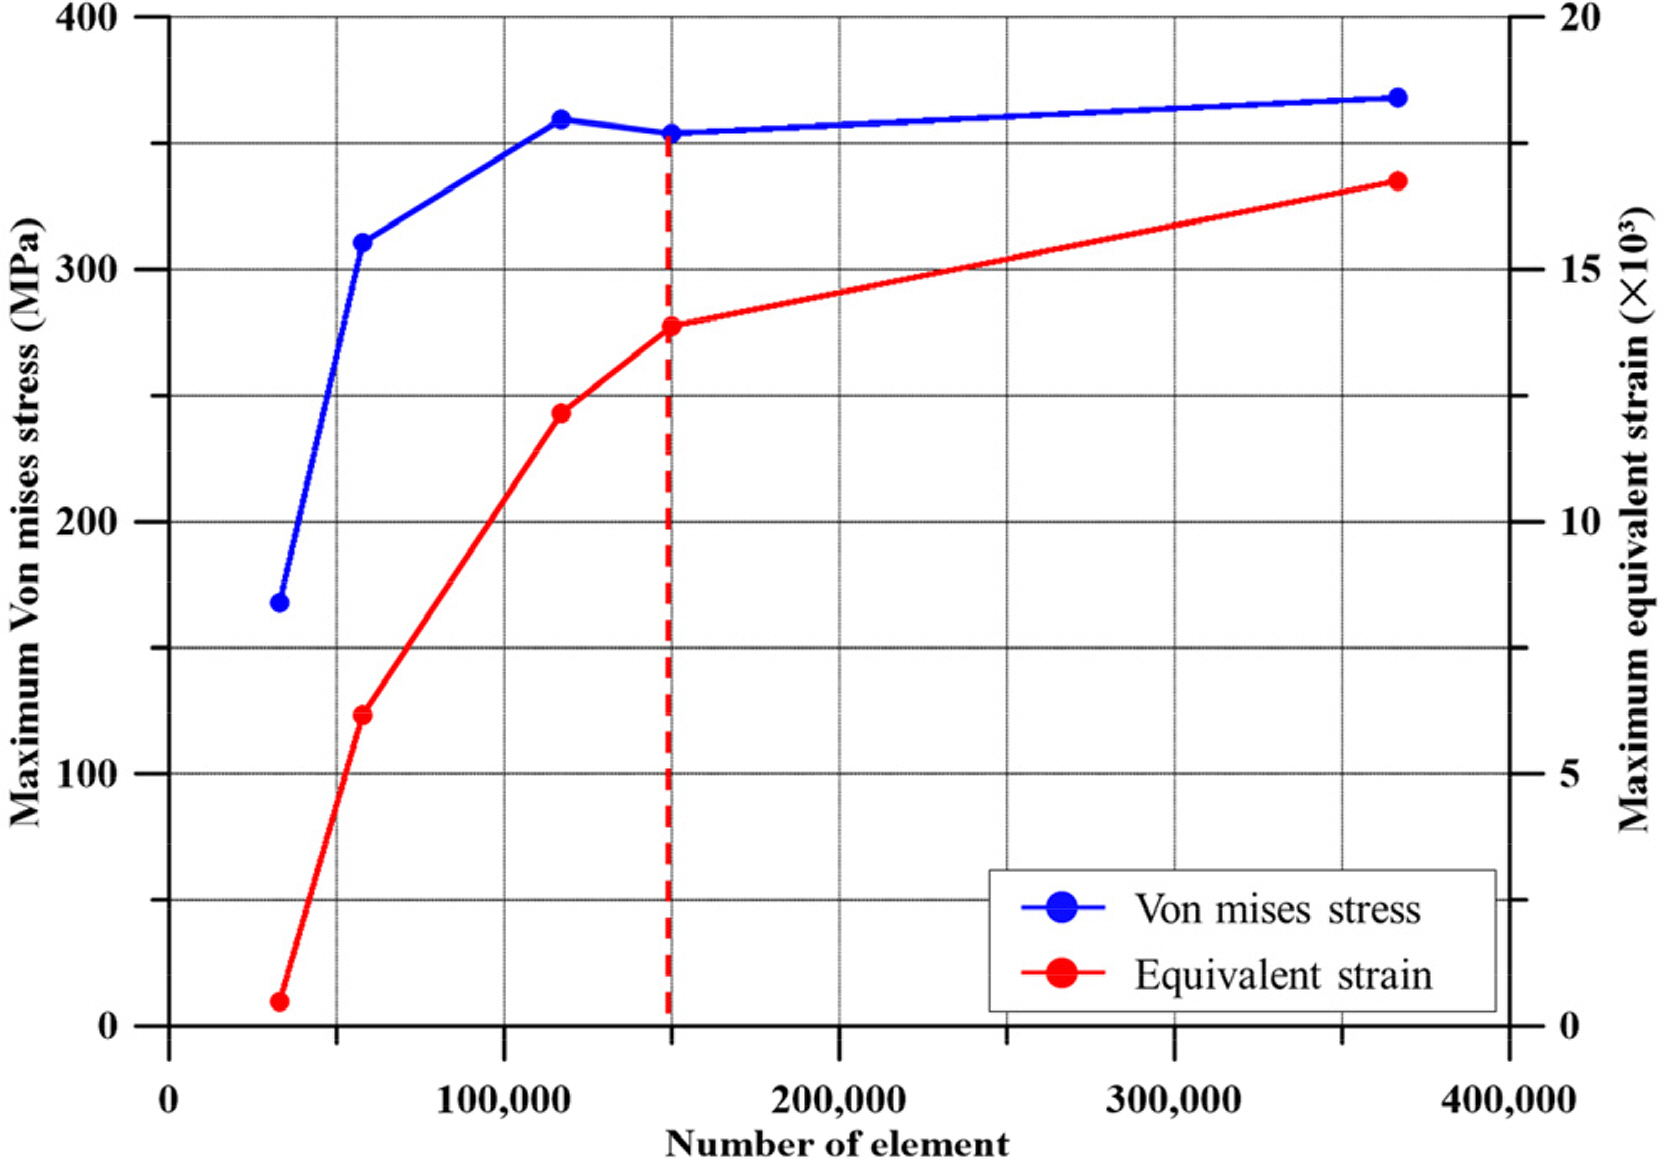
Result of the convergence study to determine the optimal element size
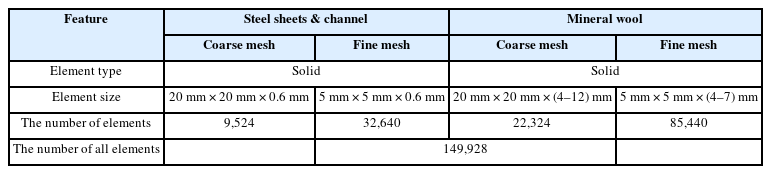
Description of elements in the FE model of the firewall
3.2 Scenarios Selection
The explosion fragments were selected in the shape of a sphere and a cube, and the degree of damage according to the velocity of various shapes was compared by assuming that the mass of each fragment was the same as 10 kg of steel. Considering the shape characteristics of the fragments, a total of three impact positions, including points, lines, and surfaces, were considered, as shown in Fig. 6.
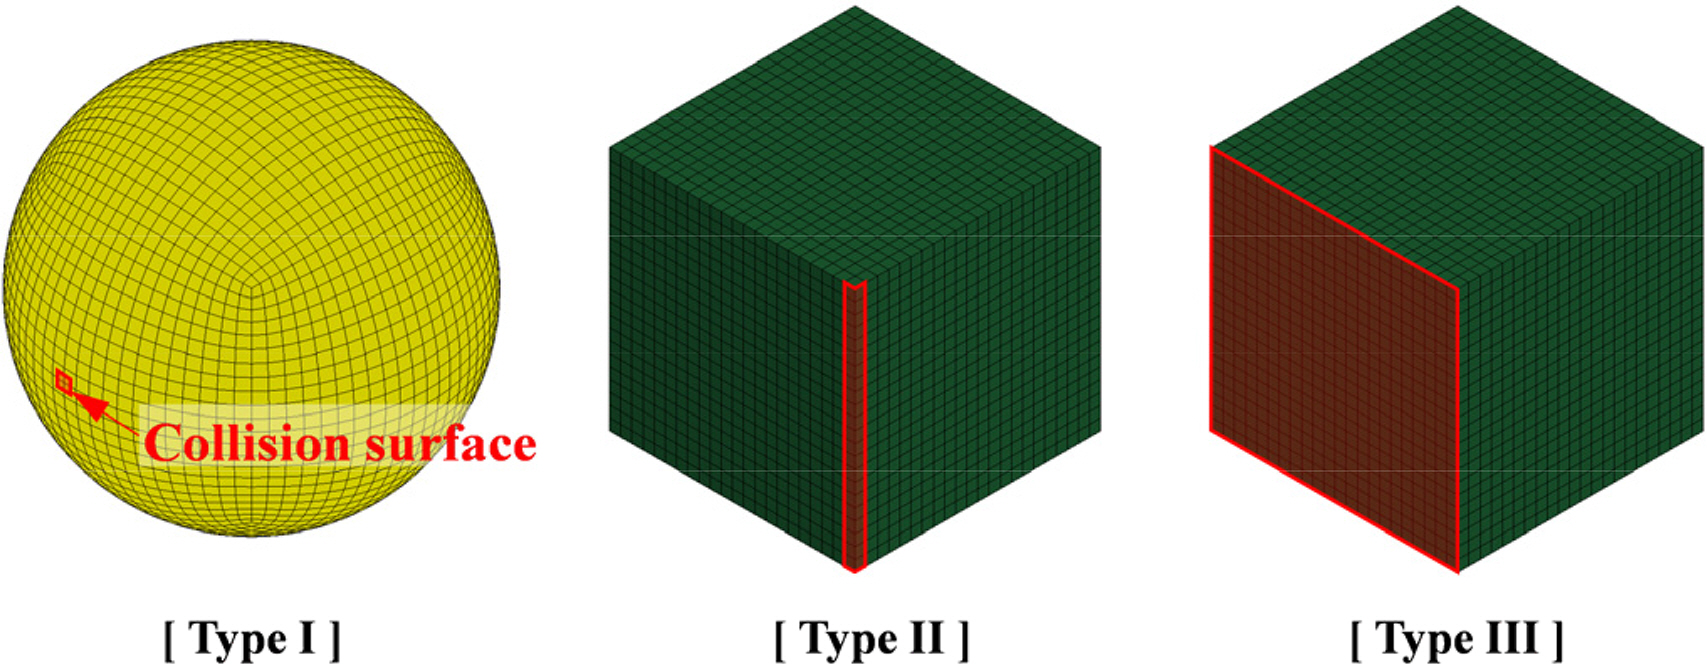
Fragment FE model and initial contact surface in each case
The explosion pressure must be defined to calculate the initial scattering velocity of fragments. Consequently, the TNT equivalent mass method was used to estimate the explosion pressure according to the separation distance between the firewall panel (target structure) and the center of the explosion. According to Federal Emergency Management Agency (2006), the TNT equivalent mass of a small vehicle is 227 kg, and the maximum pressure by the distance between fragments from the explosion could be calculated using Eq. (1) (Newmark and Hansen, 1961).
Fig. 7 presents the initial scattering velocity, i.e., impact velocity, based on the separation distance between the center of the explosion and the firewall derived through the process. The maximum pressure and initial scattering velocity at 0.1 m were 154.14 GPa and 7666.75 m/s, respectively. Case analysis was performed repeatedly to estimate the appropriate impact velocity range. The fragment fully penetrated the firewall at the impact velocity condition of approximately 12 m/s. There was little difference in fire resistance performance depending on the degree of damage under an impact velocity condition of less than approximately 8 m/s. Therefore, the initial scattering velocity range was determined from 8 to 12 m/s. Nine scenarios were selected in terms of the shape, collision surface, and initial scattering velocity of the fragment, as shown in Table 2.
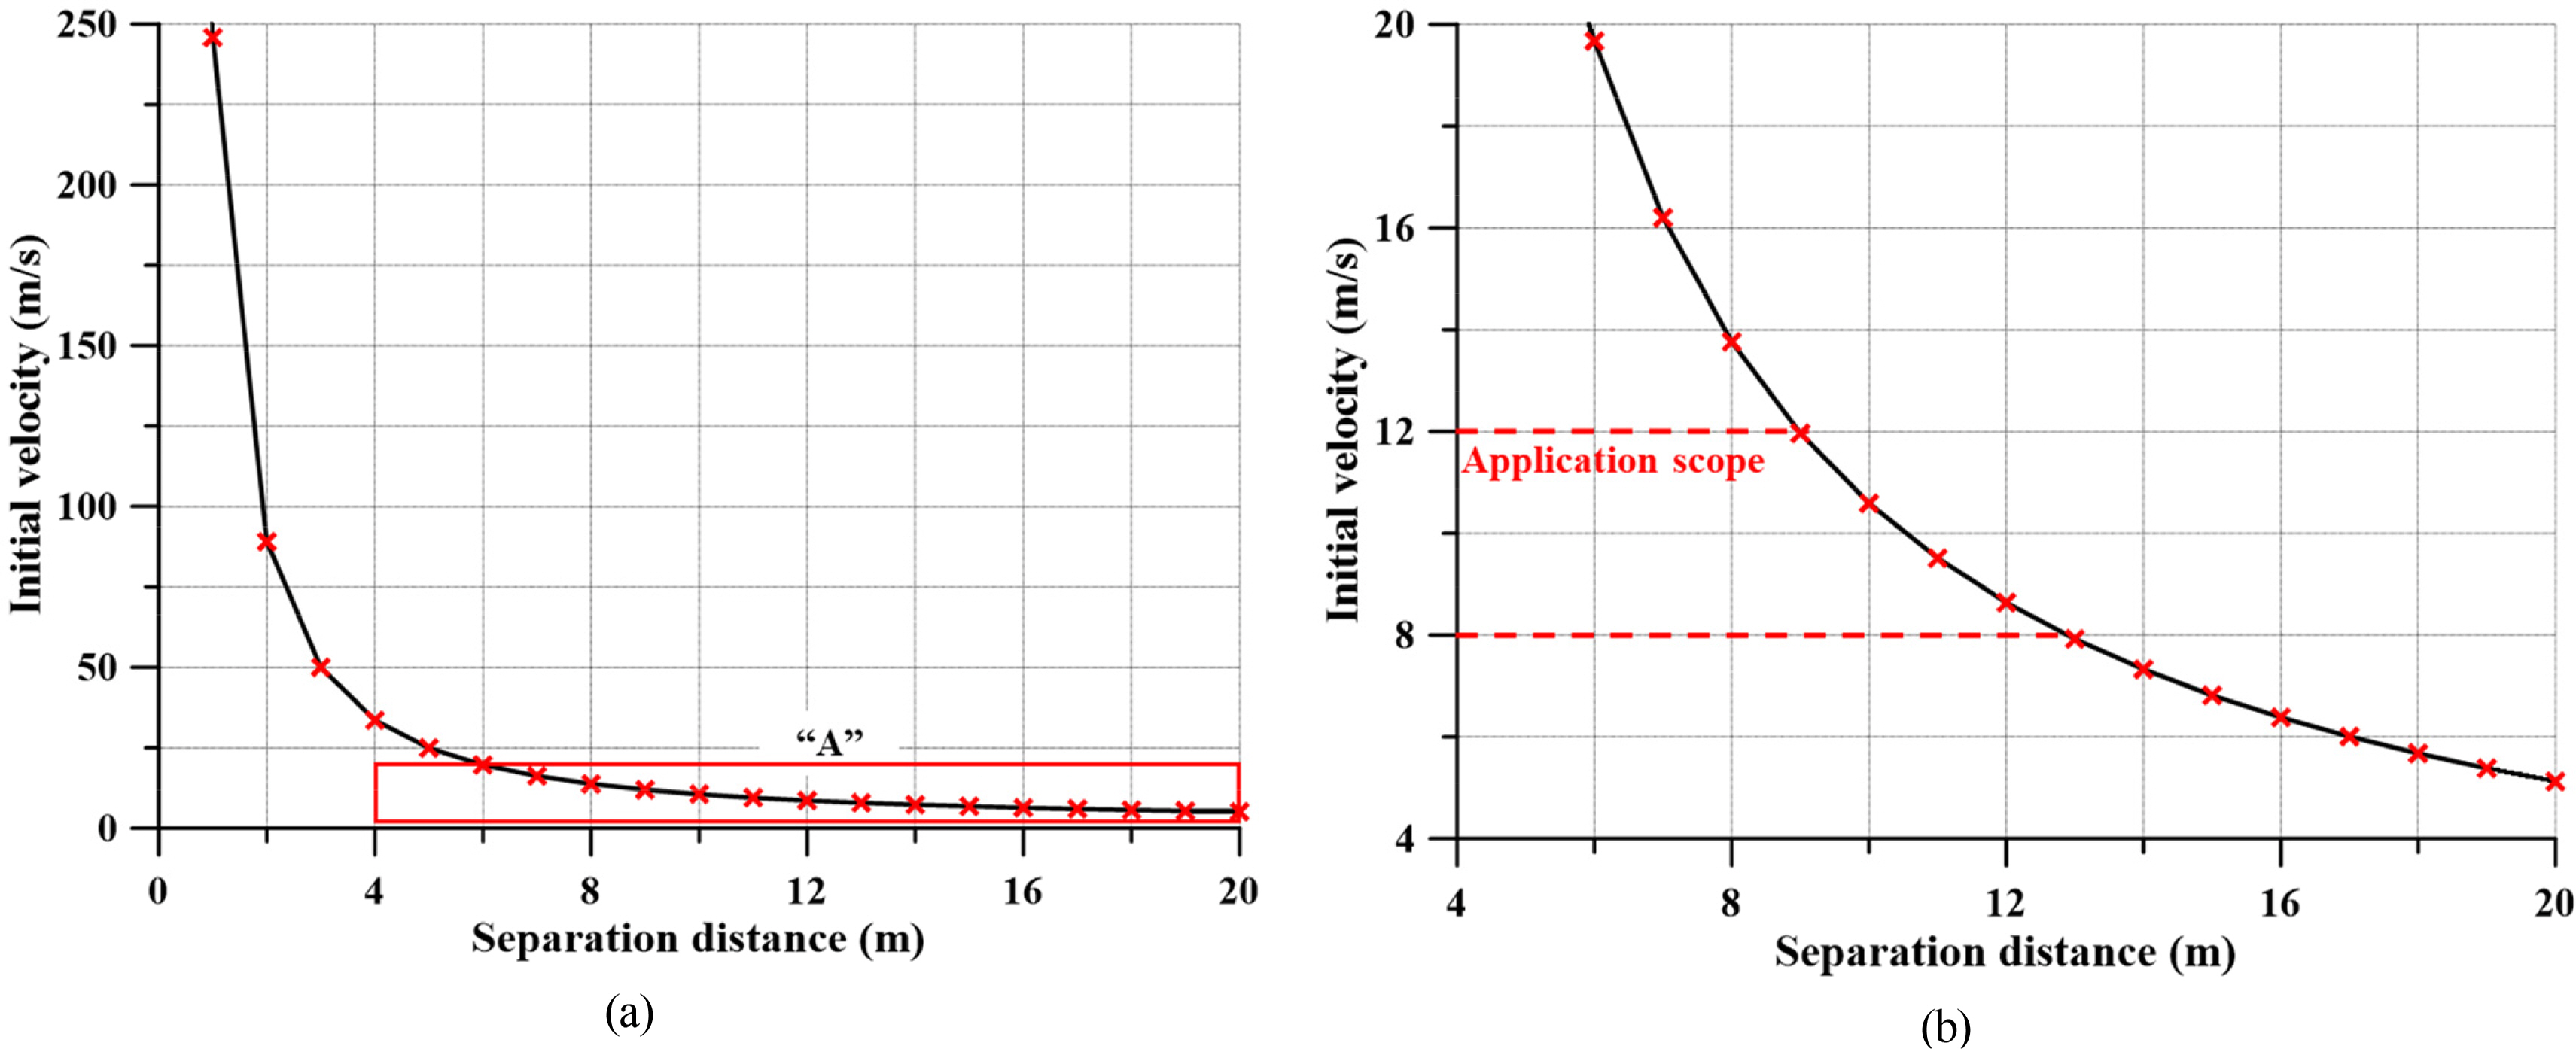
Initial velocity of fragment by the separation distance: (a) Initial velocity; (b) Zoom in “A”

Study scenarios with different impact conditions
3.3 Impact Analysis by Explosive Fragment
3.3.1 Mechanical material property
Steel sheets and channels were modeled with mild steel material, and the material properties for each firewall model were obtained through the tensile test results (Paik et al., 2017; Park et al., 2021). Table 3 lists the material properties of mineral wool and mild steel, and Table 4 summarizes the thermal properties of mineral wool at varying temperatures. The fracture behavior of the structure was simulated by applying a dynamic fracture strain and eliminating the elements exceeding the set fracture strain. The dynamic fracture strain of steel materials by various impact velocities was calculated using Eq. (3) to define the dynamic fracture characteristics of the model (Paik et al., 2017; Cowper and Symonds, 1957). Table 5 lists the dynamic fracture strain of carbon steel computed by various impact velocities. The dynamic fracture strain of mineral wool was assumed to be 0.35, which was estimated through parametric studies based on the damaged volume due to a lack of data.

Mechanical material properties of the firewall panel (Paik et al., 2017; Park et al., 2021)

Thermal properties of mineral wool (Park et al., 2021)

Dynamic fracture strain of mild steel used for the FEM analysis
3.3.2 Load condition
The upper and lower parts of firewall panel were assumed to be fixed to the wall, and the left and right parts are connected through channels. Hence, the upper and lower parts and the left and right ends were applied to the fixed and simple support conditions, respectively, as shown in Fig. 8(a). The impact point of the fragment was selected as the center of the firewall panel, which is expected to be the weakest.
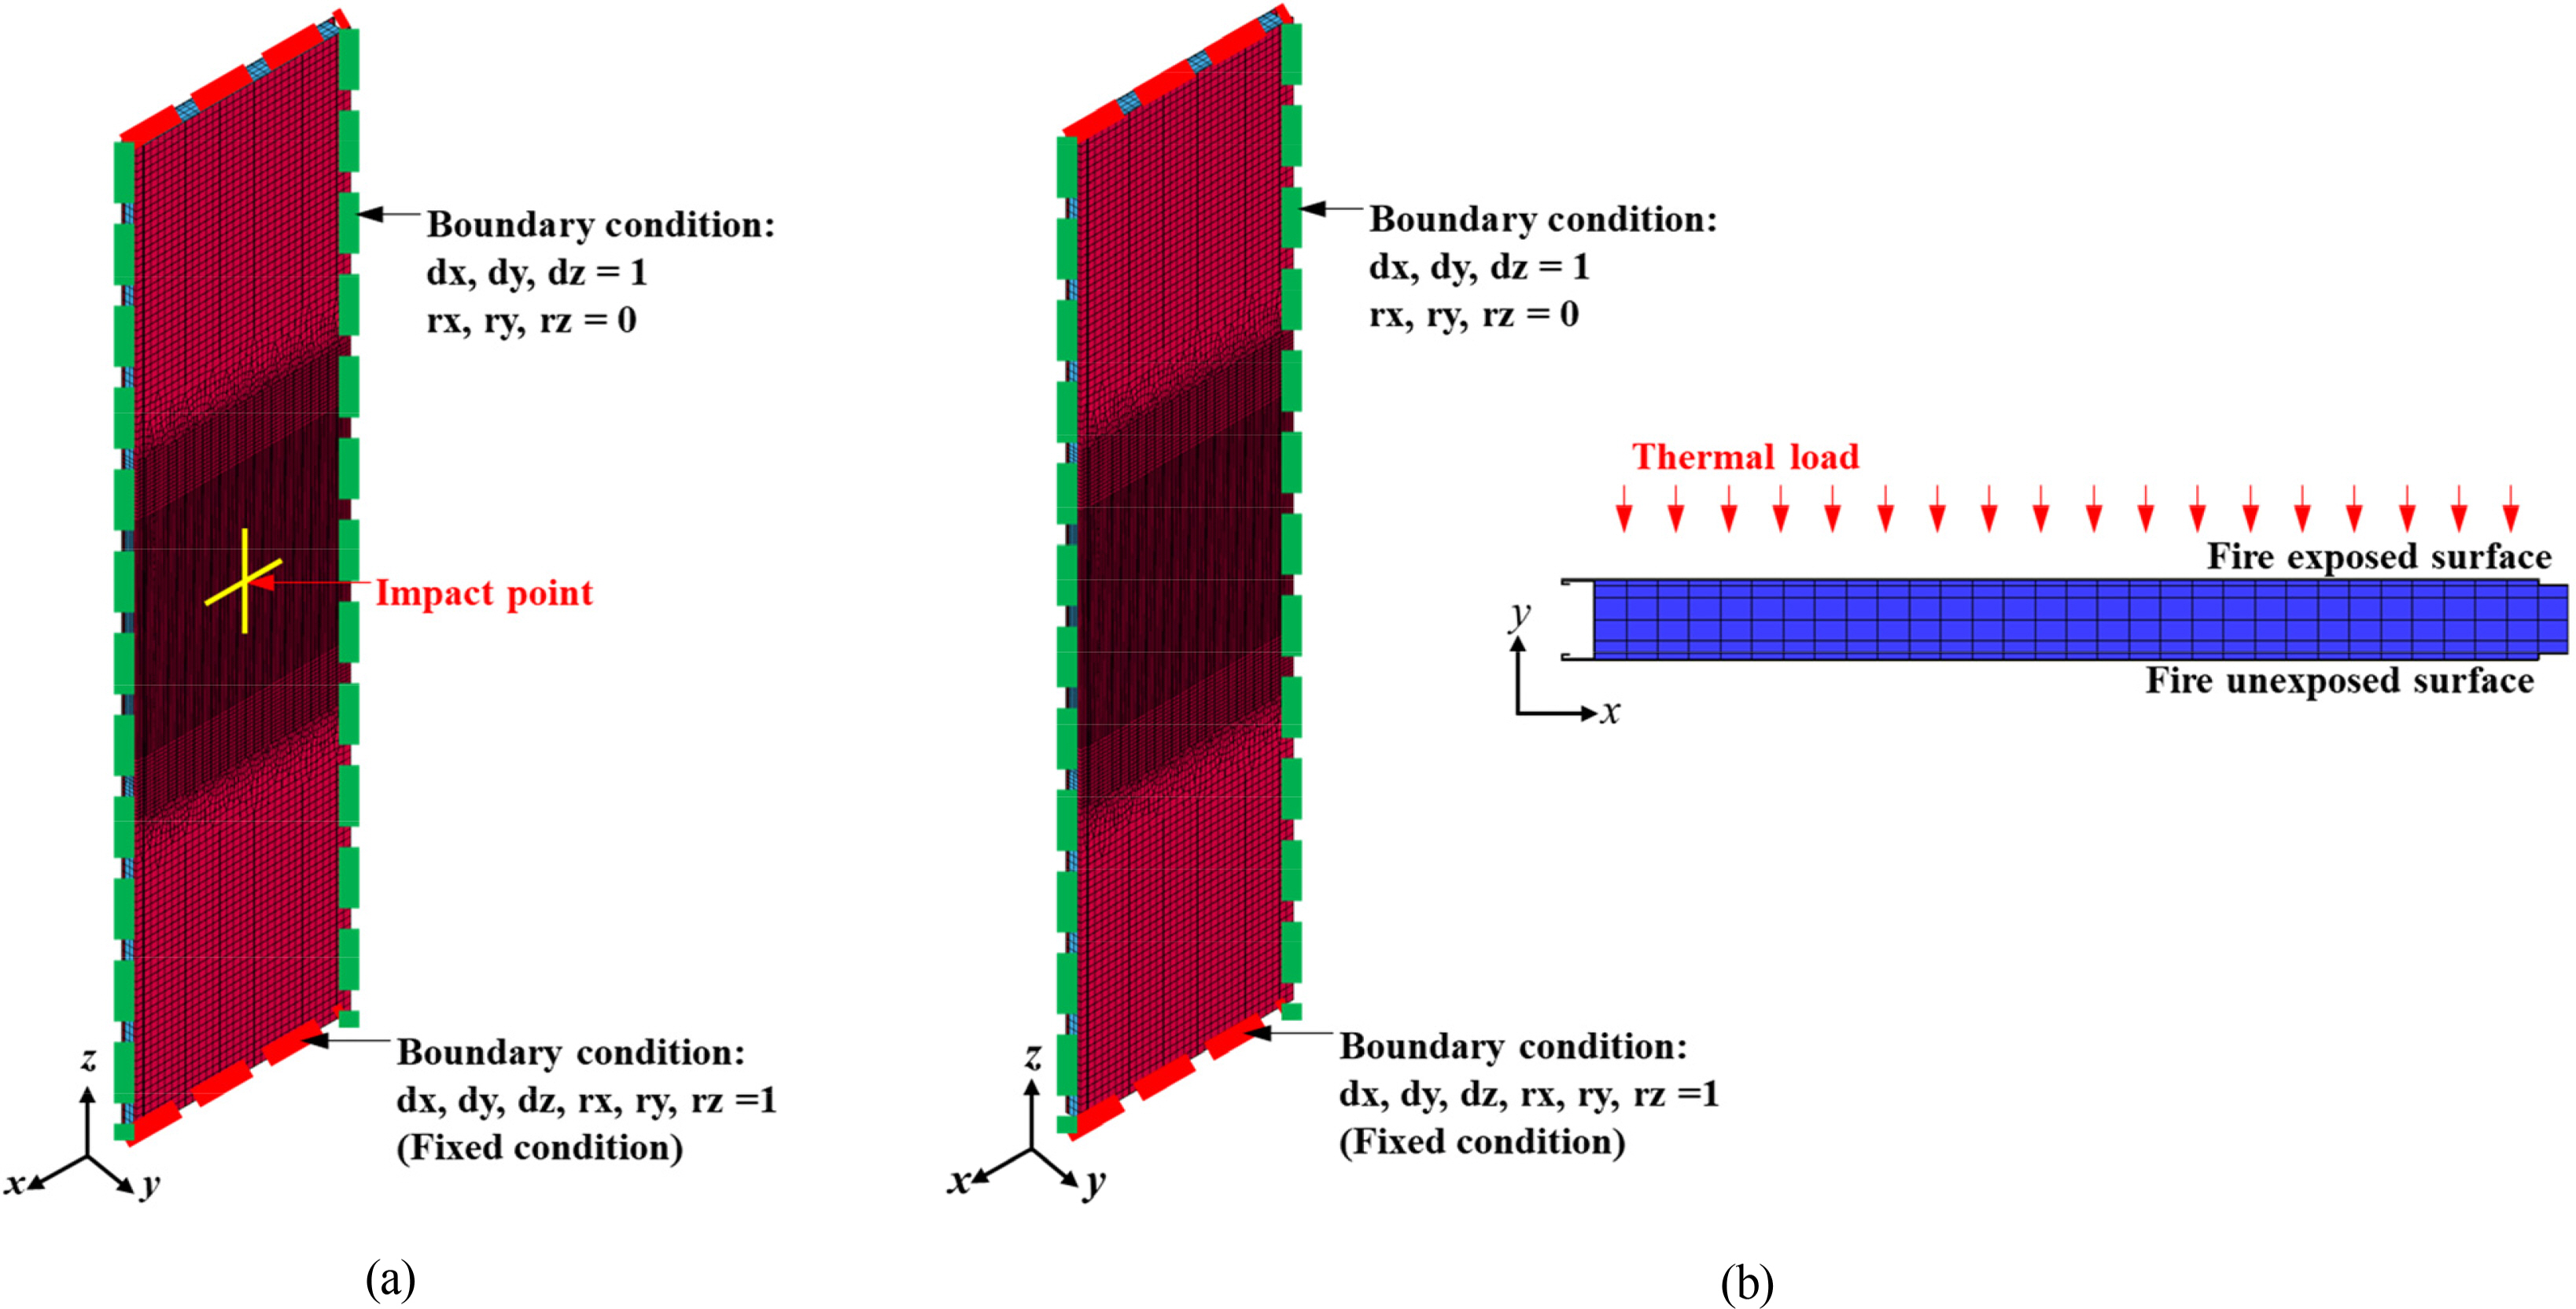
Boundary conditions and loading direction applied: (a) Impact analysis; (b) Thermal-structural response analysis
3.3.3 Result
Fig. 9 shows the deformed shape of the firewall panel at maximum penetration of the various fragment shape. In the case of “Type I”, the damaged reduction ratio was up to 94.46% at an impact velocity of 10 m/s. In contrast, the firewall panel was slightly damaged in the case of “Type III”. This result suggests that most of the kinetic energy was used to cause the global deformation of the structure, as the collision (contact) surface of the “Type III” fragment is larger than that of the other cases.
Damaged firewall due to the impact of the fragment: (a) Fragment type I; (b) Fragment type II; (c) Fragment type III
3.4 Thermal-Structural Response Analysis
3.4.1 Thermal mechanical property of the material
The thermal properties of steel material were modeled by applying the reduction factor provided by Eurocode 3 (European Committee Standardization, 2005), as shown in Fig. 10. The material properties of mineral wool by various temperatures were applied to the data summarized in Table 4.
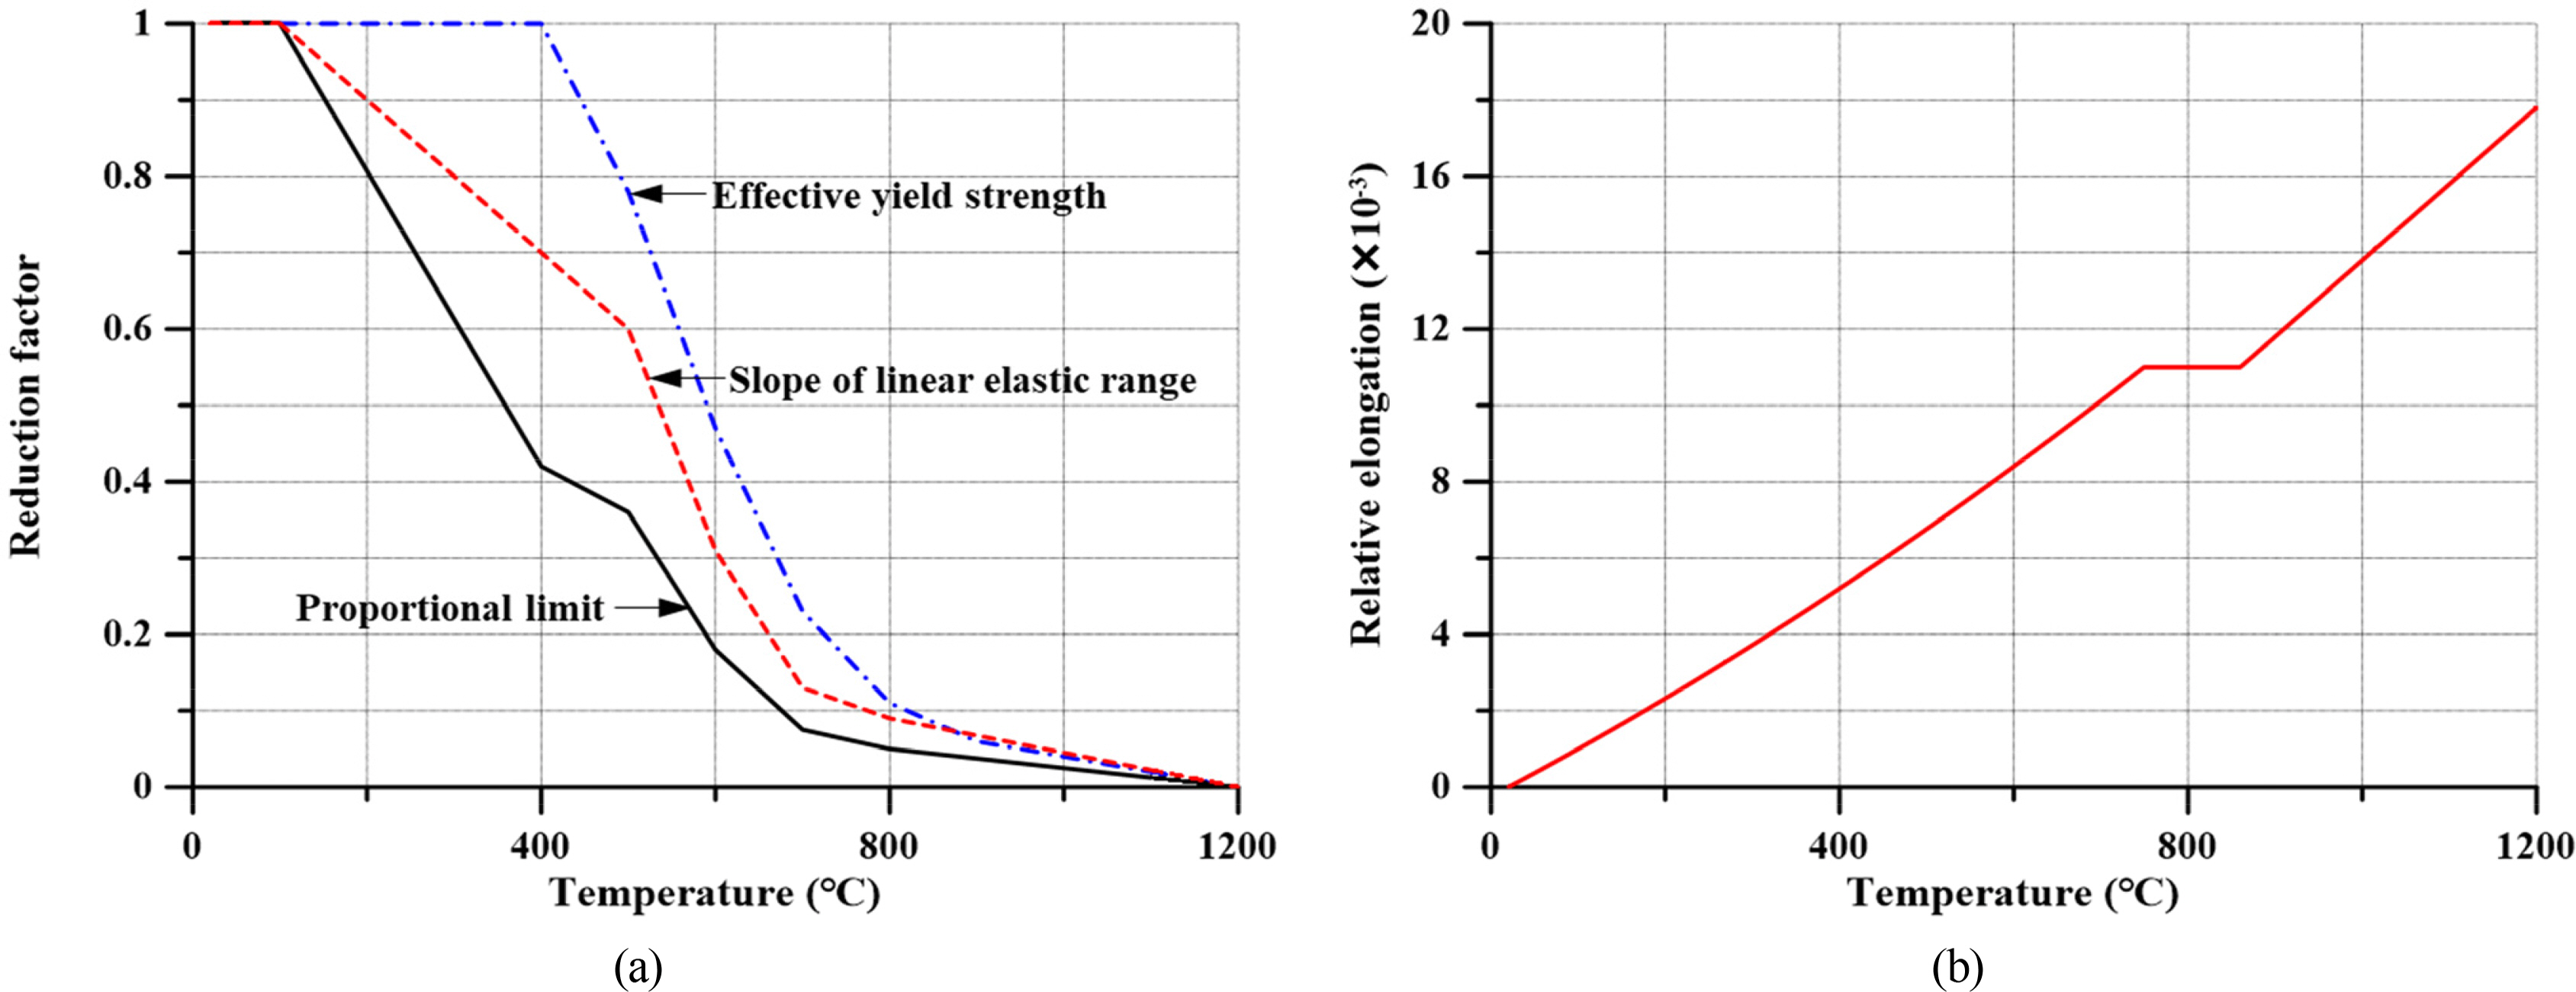
Mechanical properties of carbon steel varying with temperatures (European Committee Standardization, 2005): (a) Reduction factor; (b) Thermal elongation
3.4.2 Thermal property
The thermal behavior characteristics of steel materials were modeled, as shown in Fig. 11, by applying the data provided in Eurocode 3 (European Committee Standardization, 2005). The thermal behavior characteristics of mineral wool were obtained from the fire test results. The thermal conductivity and specific heat are 0.37 W/mK and 836.80 J/kgK, respectively (Park et al., 2021).
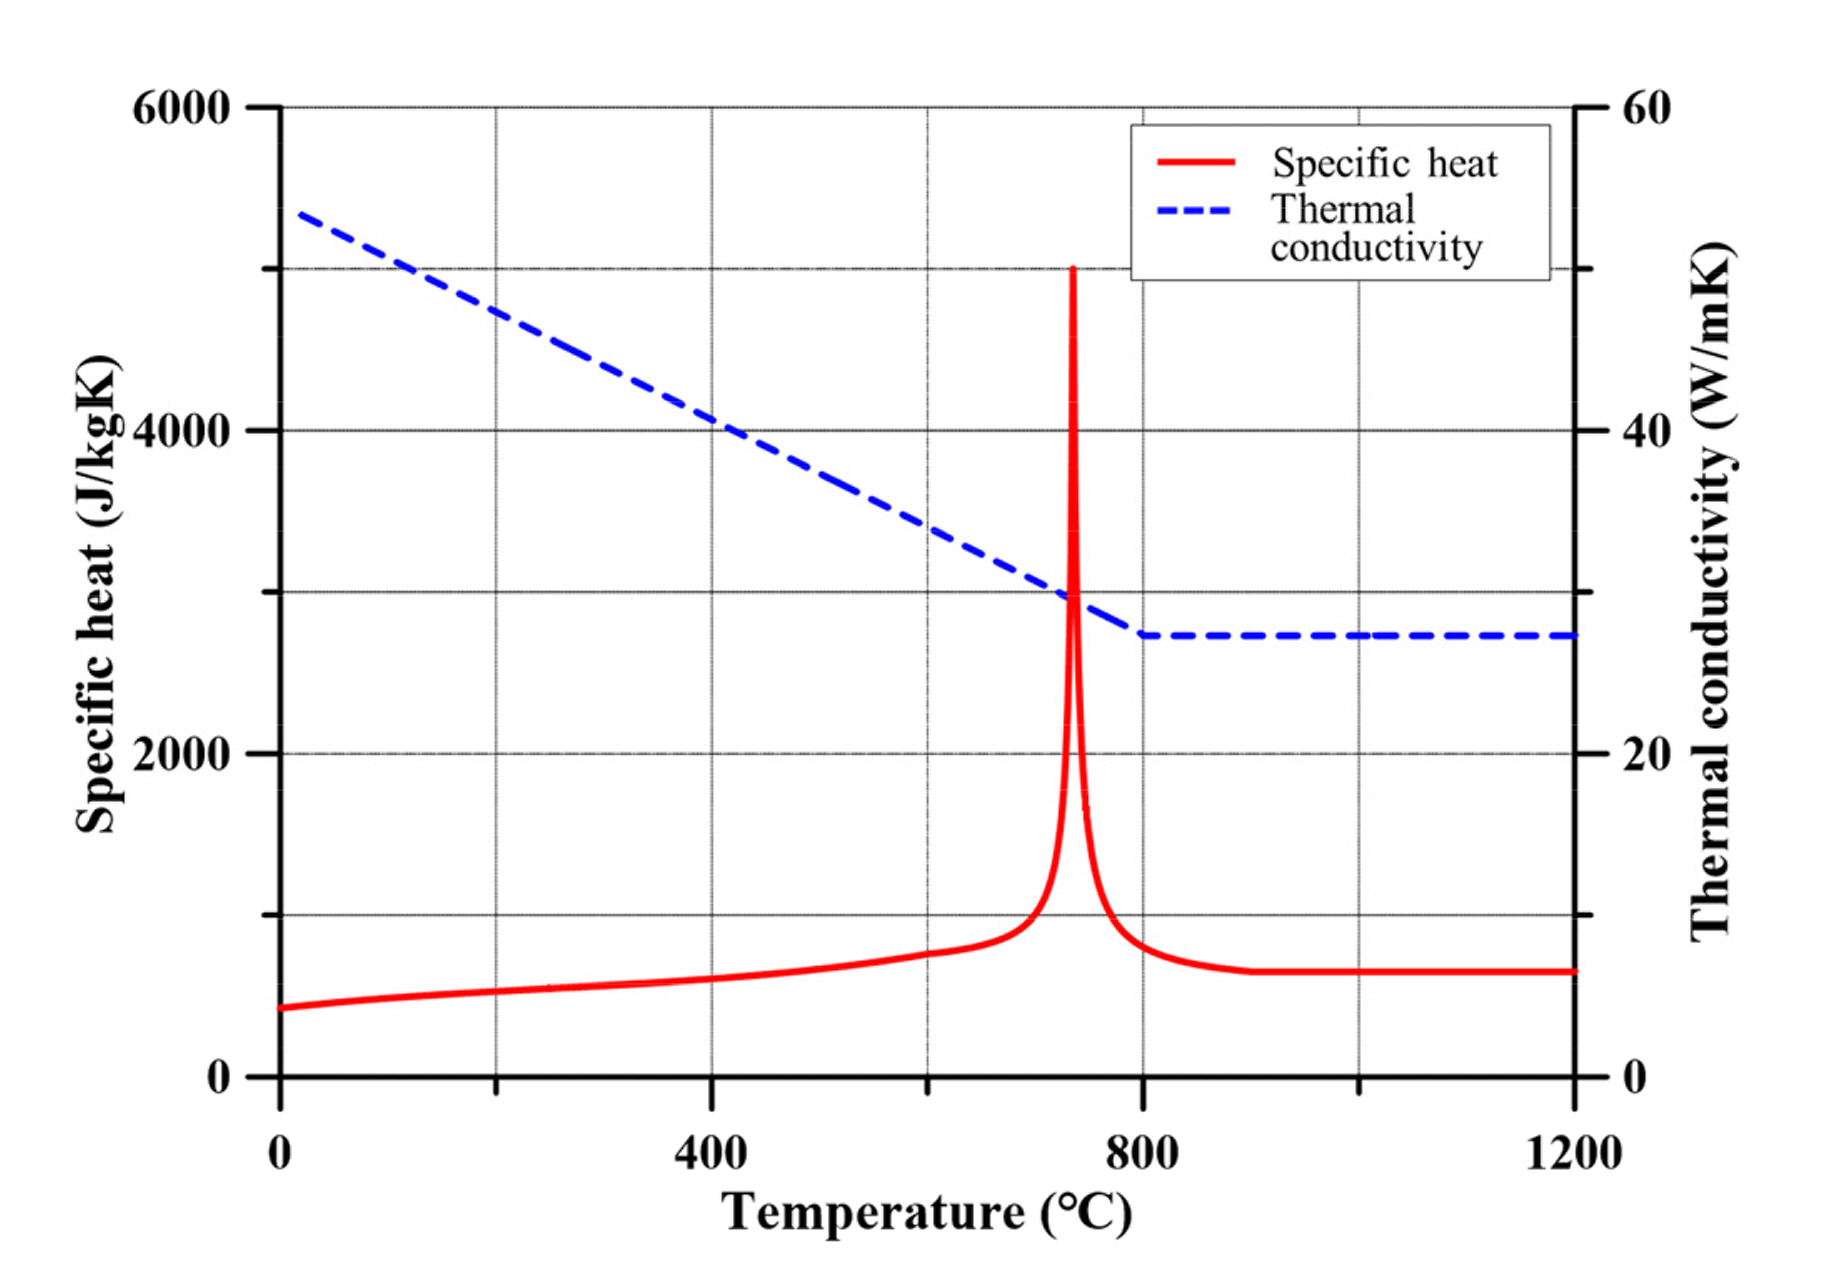
Thermal properties with varying temperatures (European Committee Standardization, 2005)
3.4.3 Load condition
The same boundary conditions were assumed as the impact analysis, and the load condition was considered so that the thermal loading acted throughout the same surface as the impact point of the fragment, as shown in Fig. 8(b). The thermal loading represented by the hydrocarbon fire curve presented in Eurocode 1 (European Committee Standardization, 2002) acted on the firewall fire exposure surface for 3600 seconds, as shown in Fig. 12.
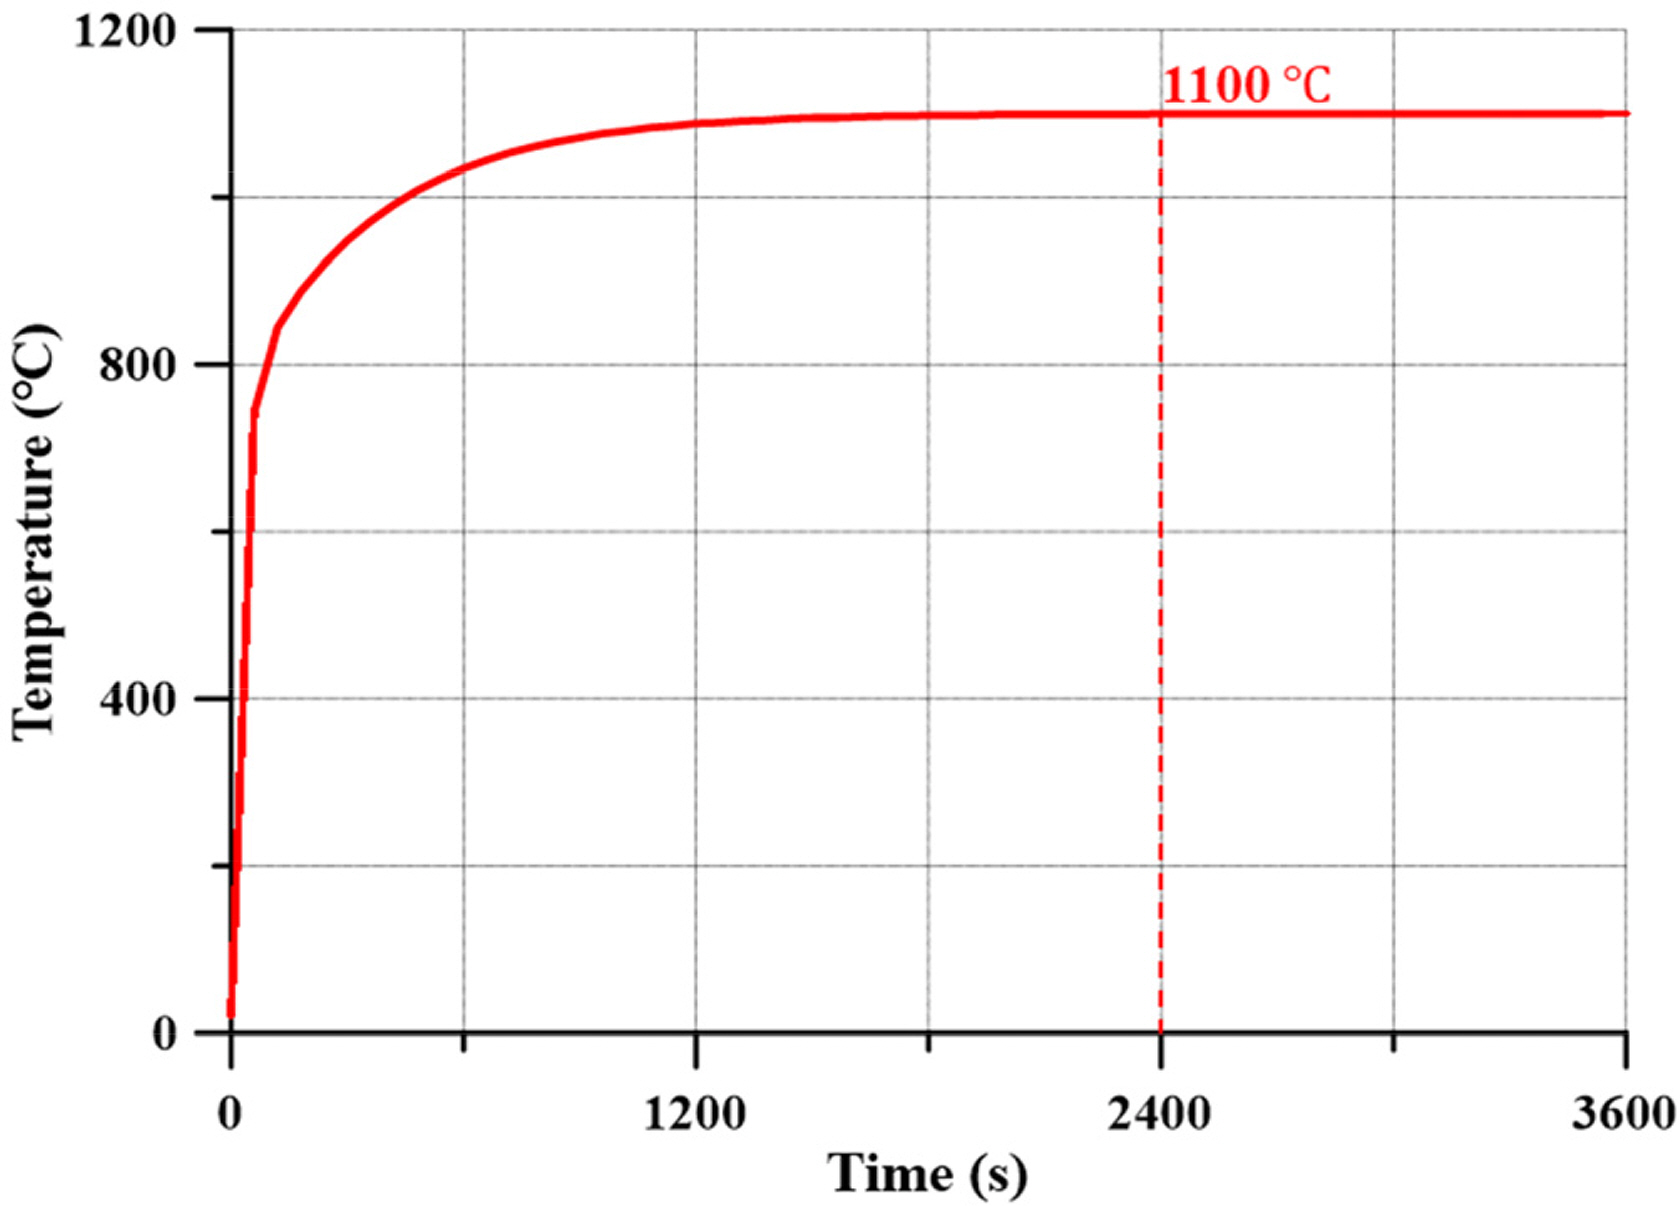
Hydrocarbon fire curve (European Committee Standardization, 2002)
3.5 Result
3.5.1 Comparison by the degree of damage
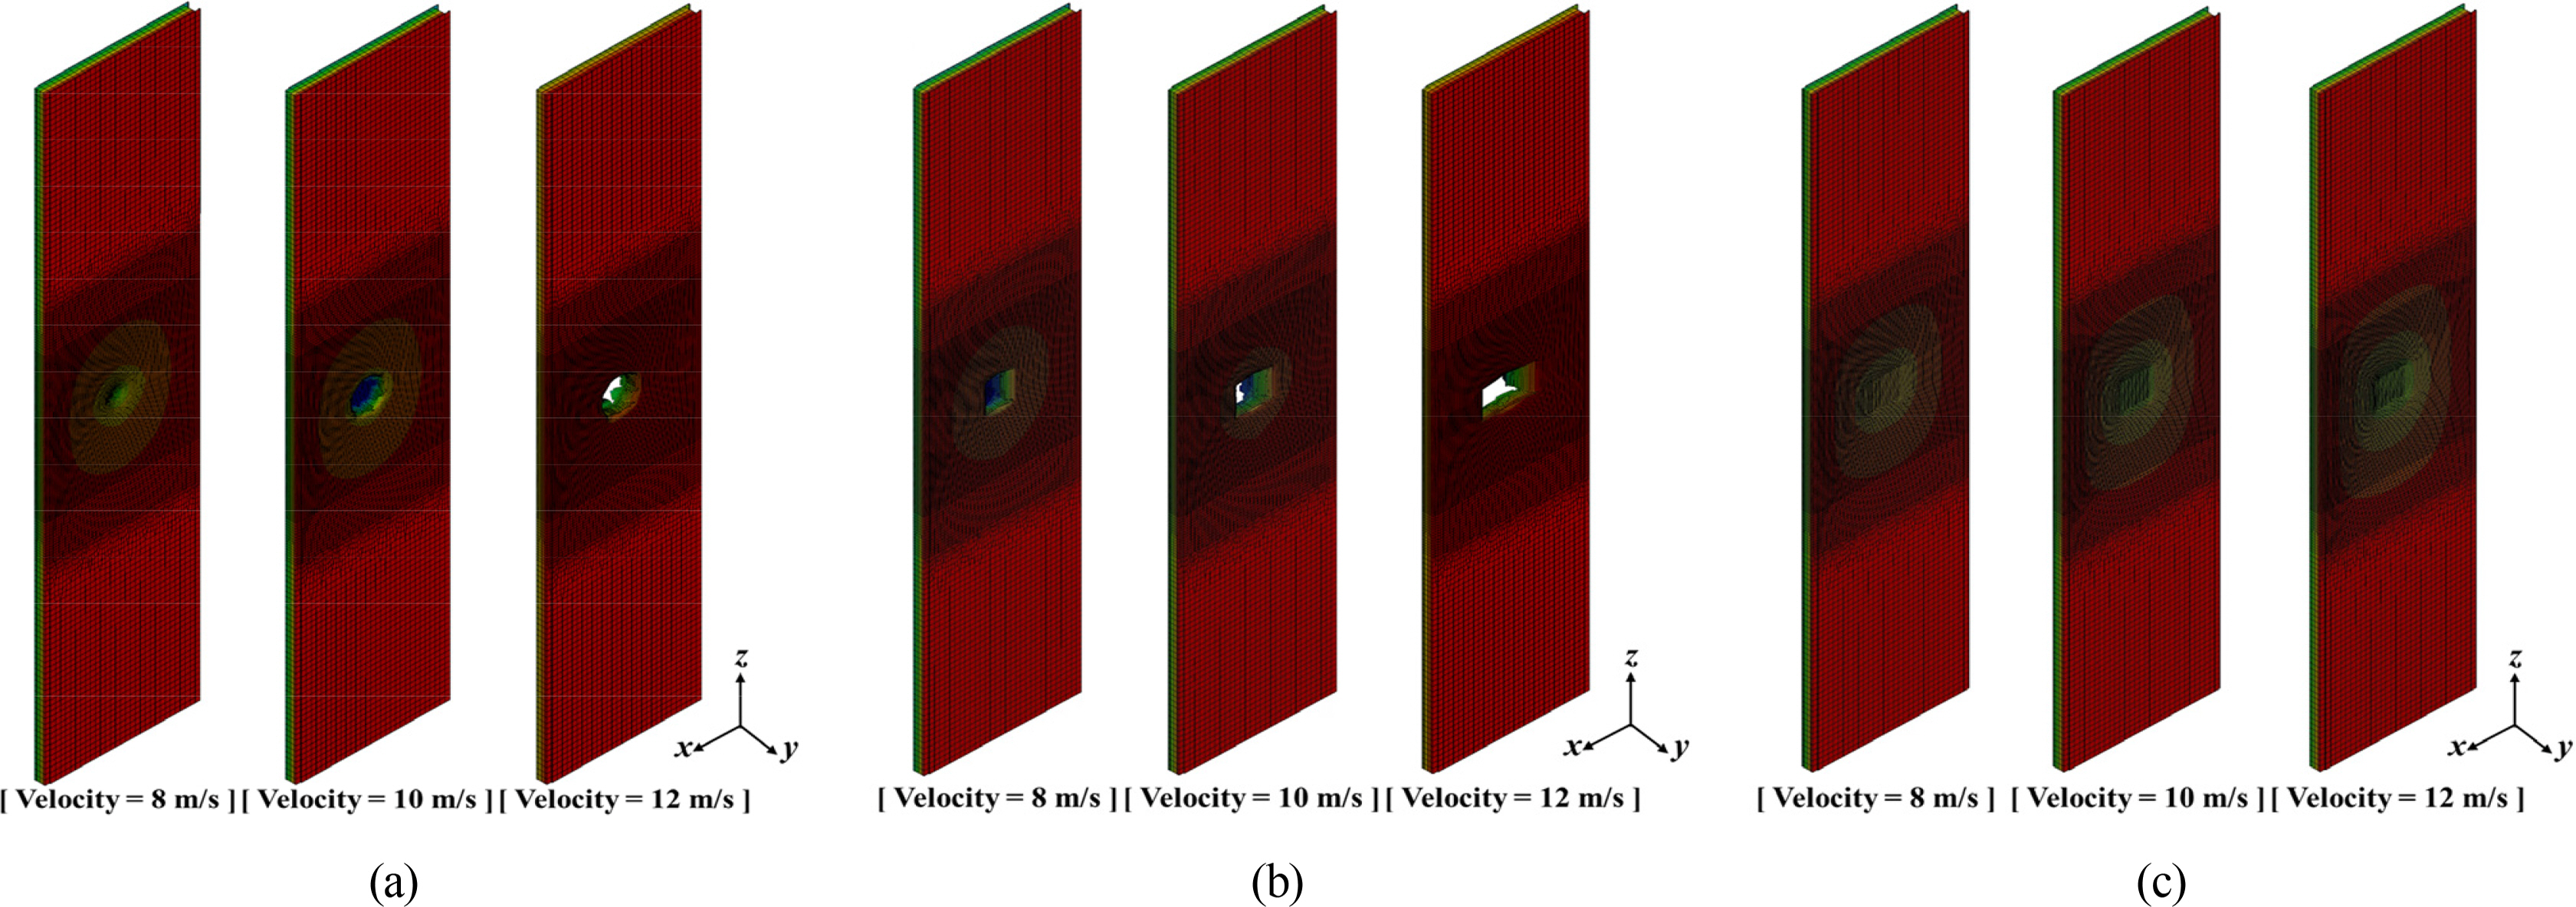
The degree of damage was calculated by measuring the reduced volume in the central section of the firewall panel, and the fire resistance performance was analyzed by comparing the temperature between the fire-exposed and unexposed surfaces of the firewall panel. Fig. 13 shows the temperature distribution after exposure to thermal load for one hour, and Fig. 14 presents the maximum temperature at each location. The asymmetric deformation of firewalls was caused by the geometric difference between the left and right ends to which the boundary condition was applied, as shown in Fig. 13.
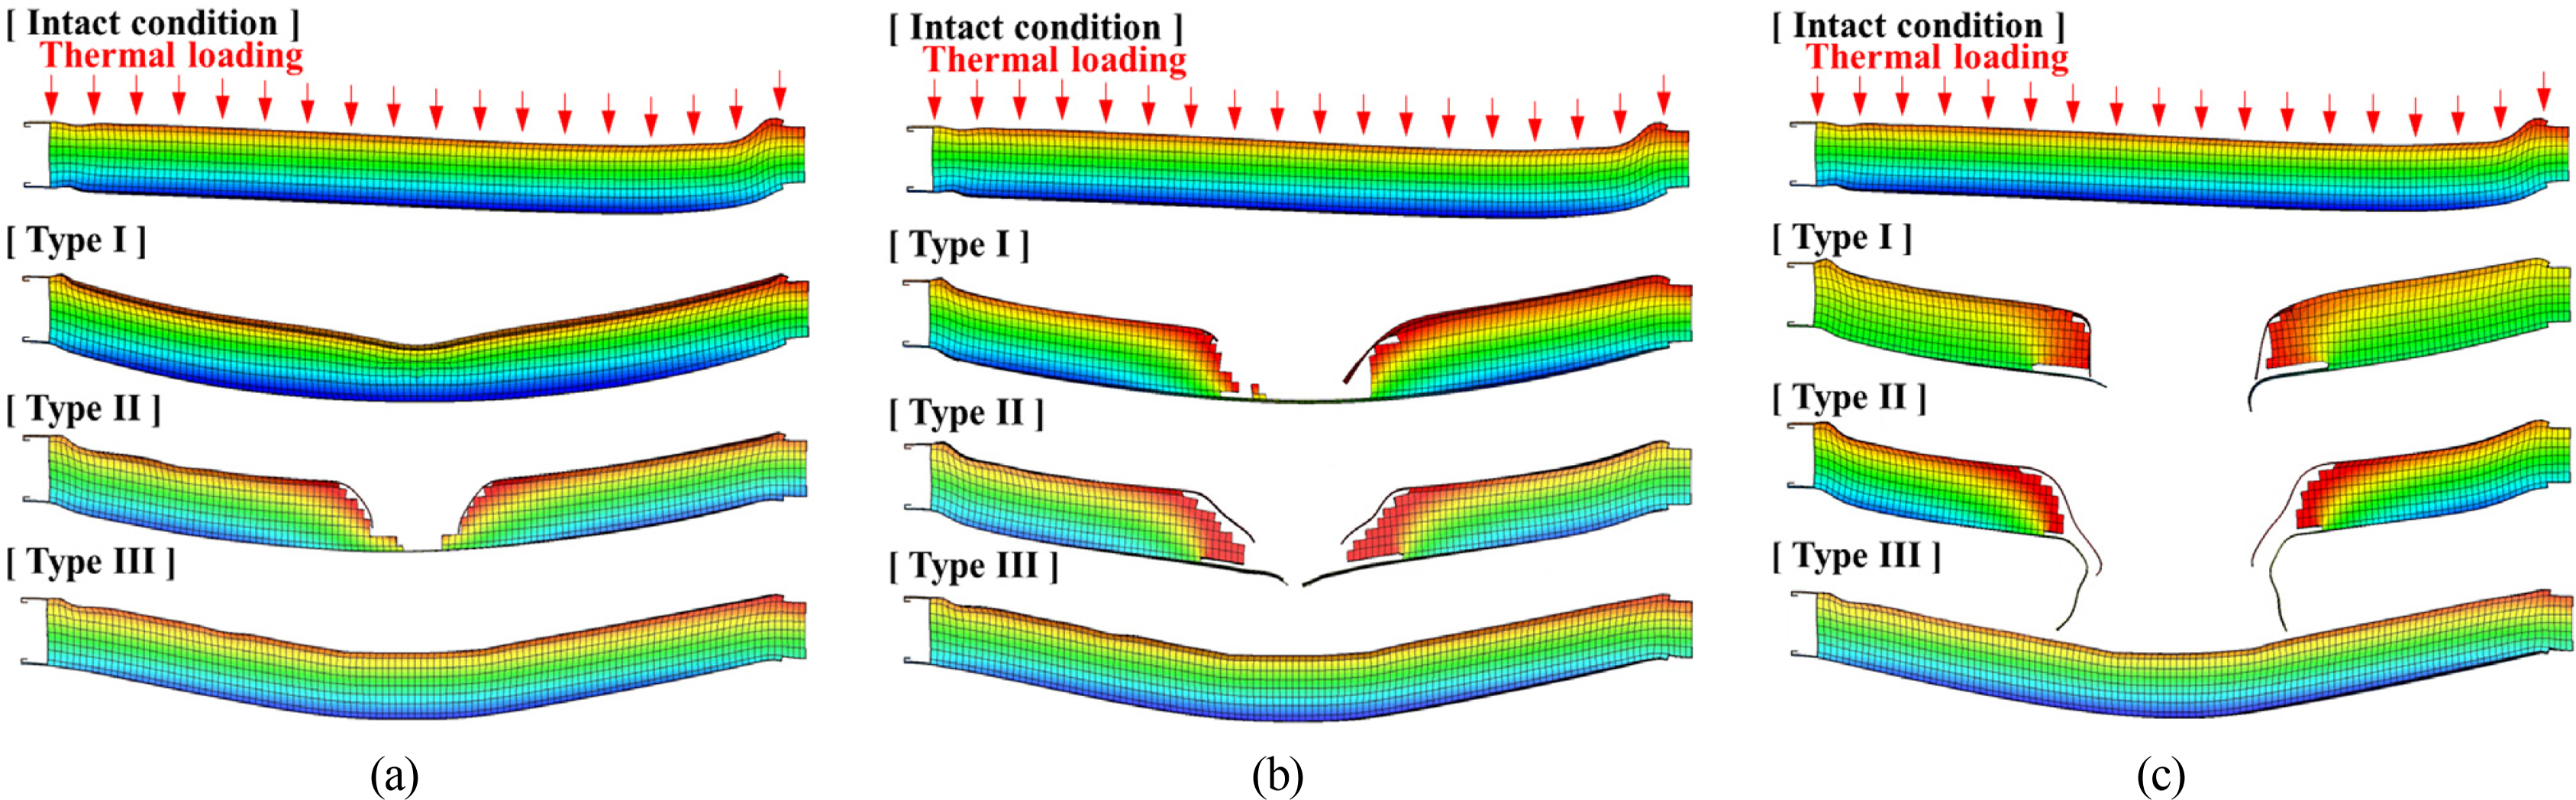
Temperature contour of the firewall panel center under thermal load at various impact velocities: (a) 8 m/s, (b) 10 m/s, and (c) 12 m/s
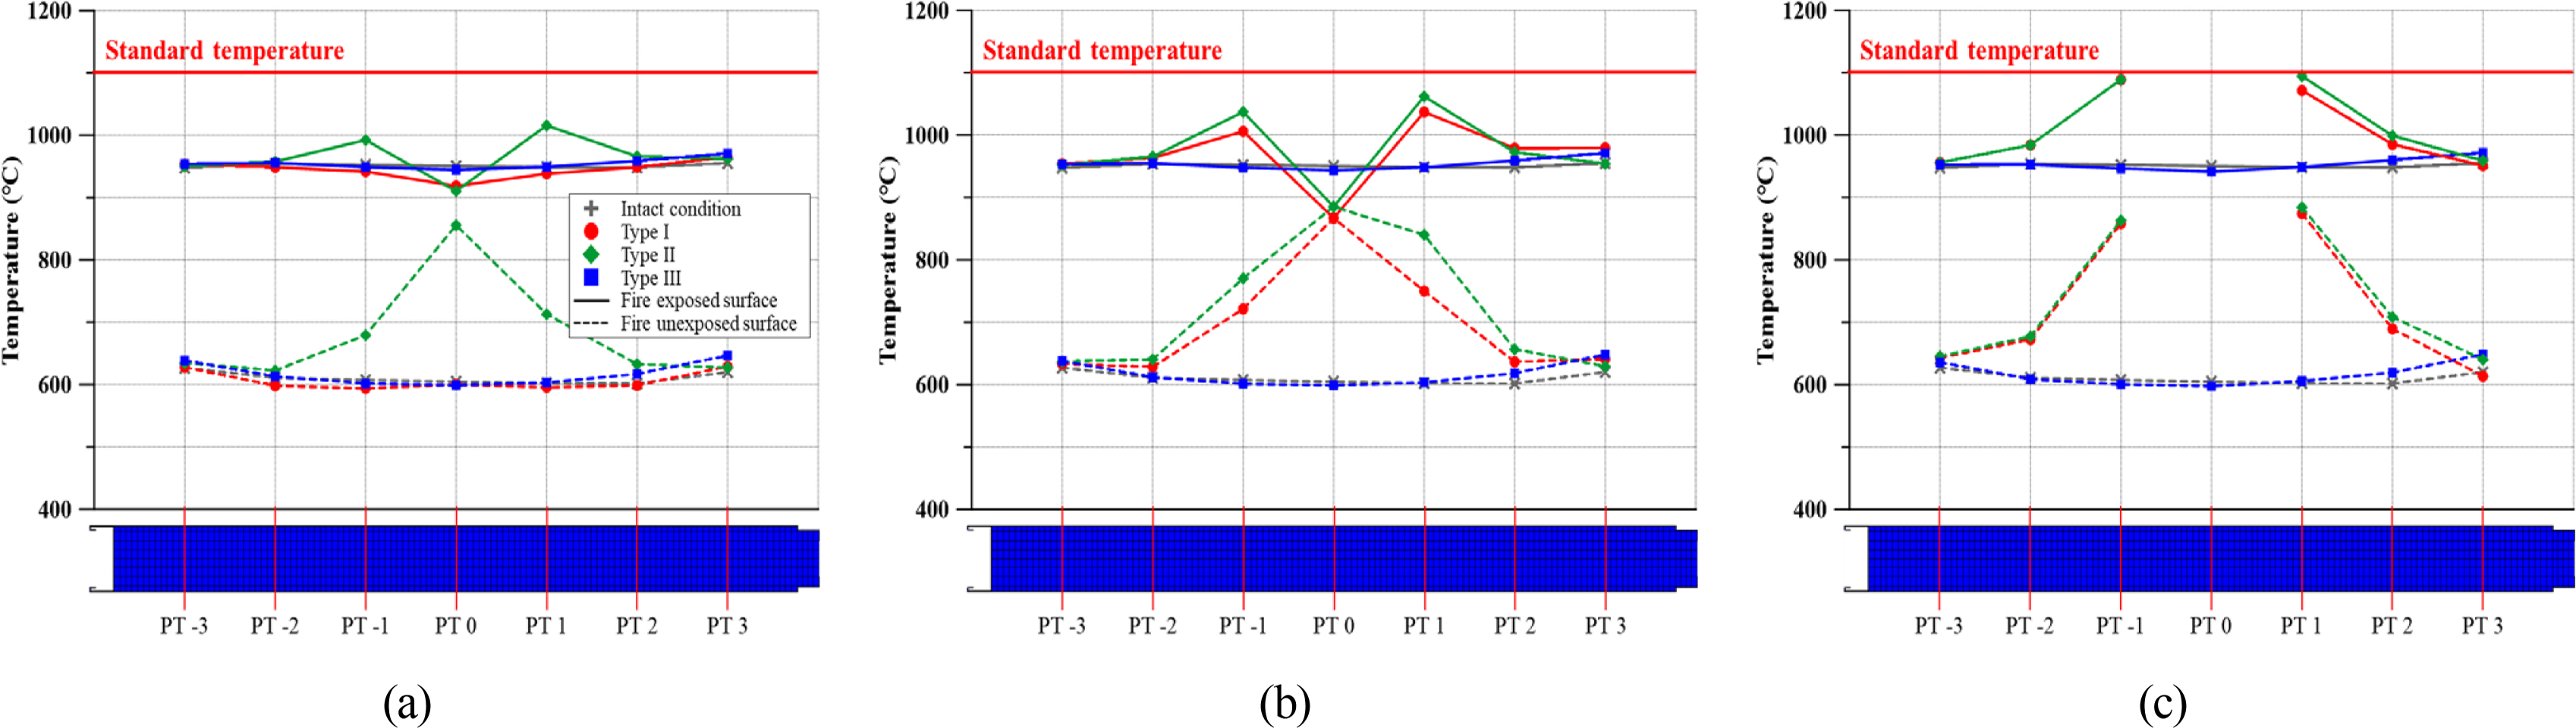
Maximum temperature comparison at each point with varying impact velocities: (a) 8 m/s, (b) 10 m/s, and (c) 12 m/s
In the case of firewall panels damaged by “Type I” and “Type II” fragments at an impact velocity of 8 m/s, there was a temperature difference of 0.14–41.48% from the intact firewall, but there was little difference in the case of the “Type III” fragment. Global deformation occurred at the structure and there was little volume change because the collision surface of the “Type III” fragment is wide and flat, as described in the impact analysis results in Section 3.4.
The “Type III” fragment at an impact velocity of 10 m/s showed a temperature and damaged volume difference of 0.16–4.53% and 0.01% compared to the intact firewall panel, respectively, as shown in Fig. 14(b). In the case of the “Type I” fragment, the temperature was increased by 43.36%, while the volume decreased by 94.46 %.
In the case of “Type I” and “Type II” at an impact velocity of 12 m/s, Fig. 14(c) shows the temperature distribution for the remaining points, except for the “PT0” point, which was immeasurable because of the penetration of the fragment. The temperature of the “PT-1” and “PT1”, which had the most differences in fire unexposed surface, was measured at 41.29%, 45.16% (“Type I”), 42.14%, and 46.81% (“Type II”) higher than the intact firewall panel, respectively.
At the position indicated in Fig. 15, the temperature difference and temperature ratio of the non-exposed surface to the fire-exposed surface depending on the degree of the volume damage were compared (Fig. 16). The temperature difference and ratio decreased and increased linearly depending on the volume reduction ratio, respectively. Compared to the intact condition, the temperature difference between both surfaces of the firewall panel was decreased by a maximum of 99.97%, and the temperature ratio between both surfaces was increased by up to 57.15%. The temperature characteristics differed according to the degree of damage. Therefore, the temperature characteristics showed a clear difference depending on the degree of damage, which was deemed necessary to evaluate the fire resistance performance of the firewall in consideration of the impact of the explosion, as proposed in this paper.
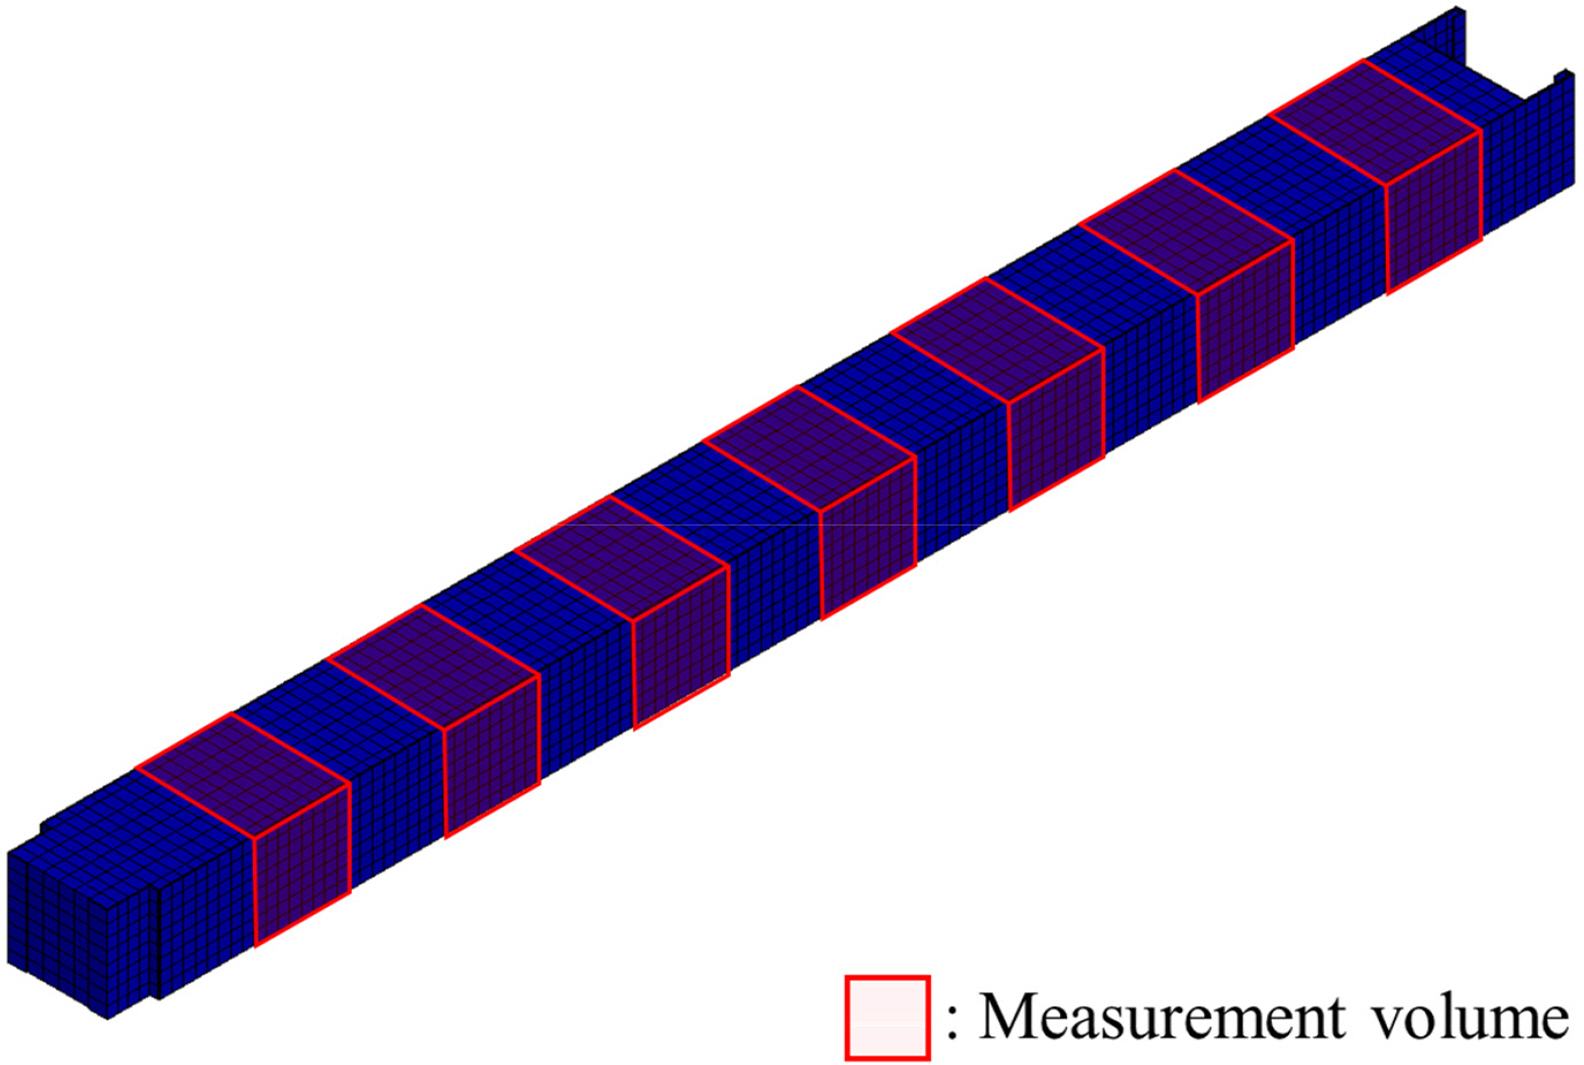
Measurement point of damaged volume
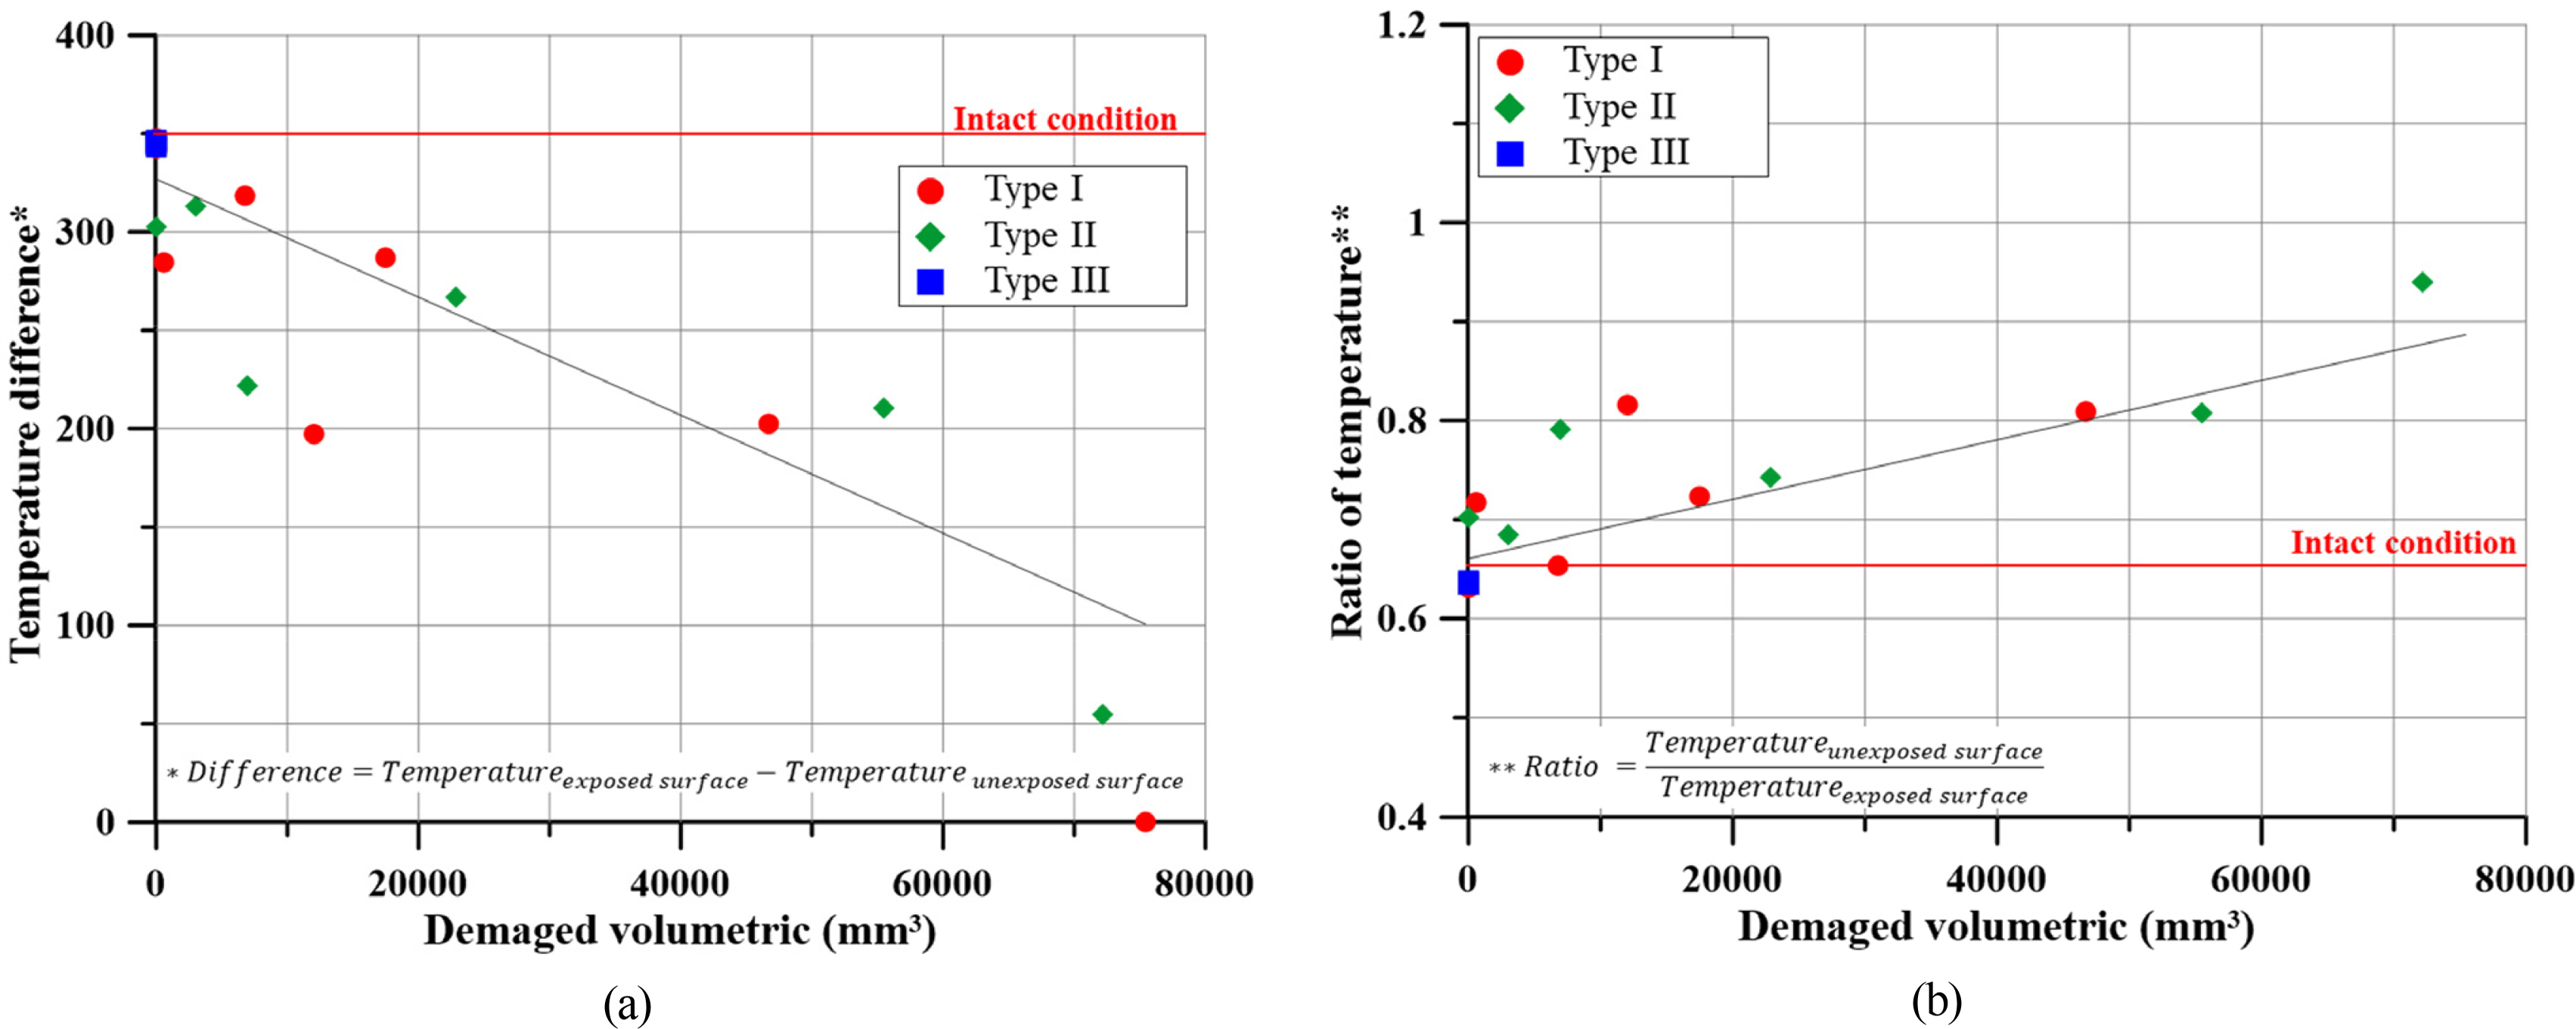
Comparison of the temperature characteristics at different damaged volumes: (a) Temperature difference; (b) Temperature ratio
3.5.2 Comparison by fire exposure time
The fire resistance performance was compared in terms of temperature increase rate and time to reach reference temperature based on analysis results of the firewall panel damaged by “Type II” fragment when a thermal load was applied. Figs. 17–19 show the curve of fire exposure time-measurement temperature at the “PT-1”, “PT0”, and “PT1” points on the fire-exposed and unexposed surfaces of the central section of the firewall panel.
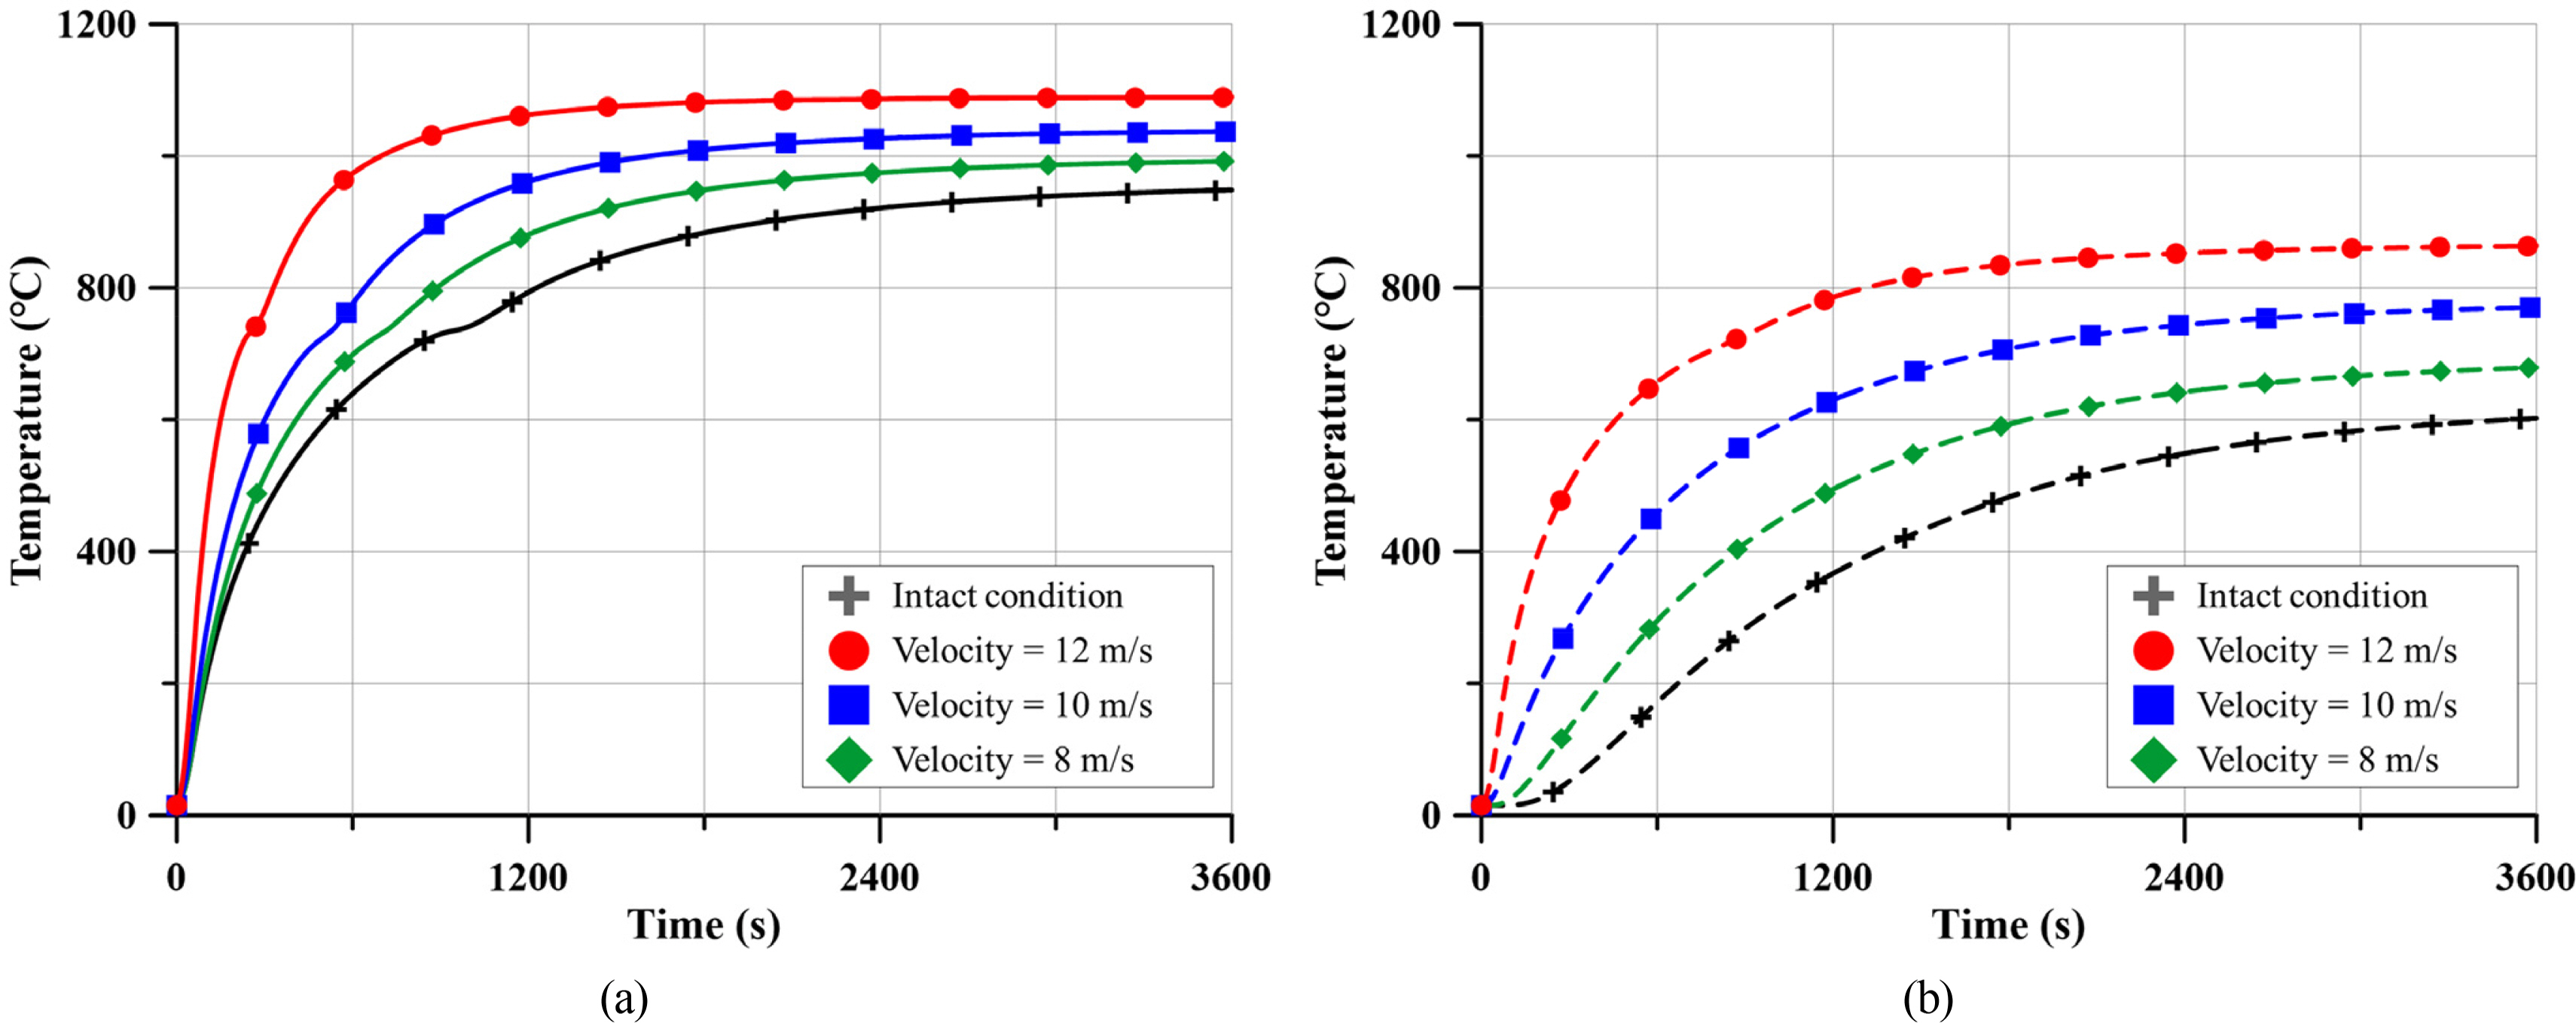
Temperature comparison at “PT -1” with the varying impact velocities: (a) Fire-exposed surface; (b) Fire unexposed surface

Temperature comparison at “PT 0” with the varying impact velocities: (a) Fire-exposed surface; (b) Fire unexposed surface

Temperature comparison at “PT 1” with the varying impact velocities: (a) Fire-exposed surface; (b) Fire unexposed surface
The temperature increase rate was compared in the range of 100 to 200°C, where the temperature increased rapidly, to quantitative analyze the change in fire resistance caused by damage, as shown in Fig. 20. Furthermore, the time to reach the reference temperature was derived according to the degree of damage, and 607.37°C was the maximum temperature of the fire unexposed surface at the intact firewall and used as the reference temperature.
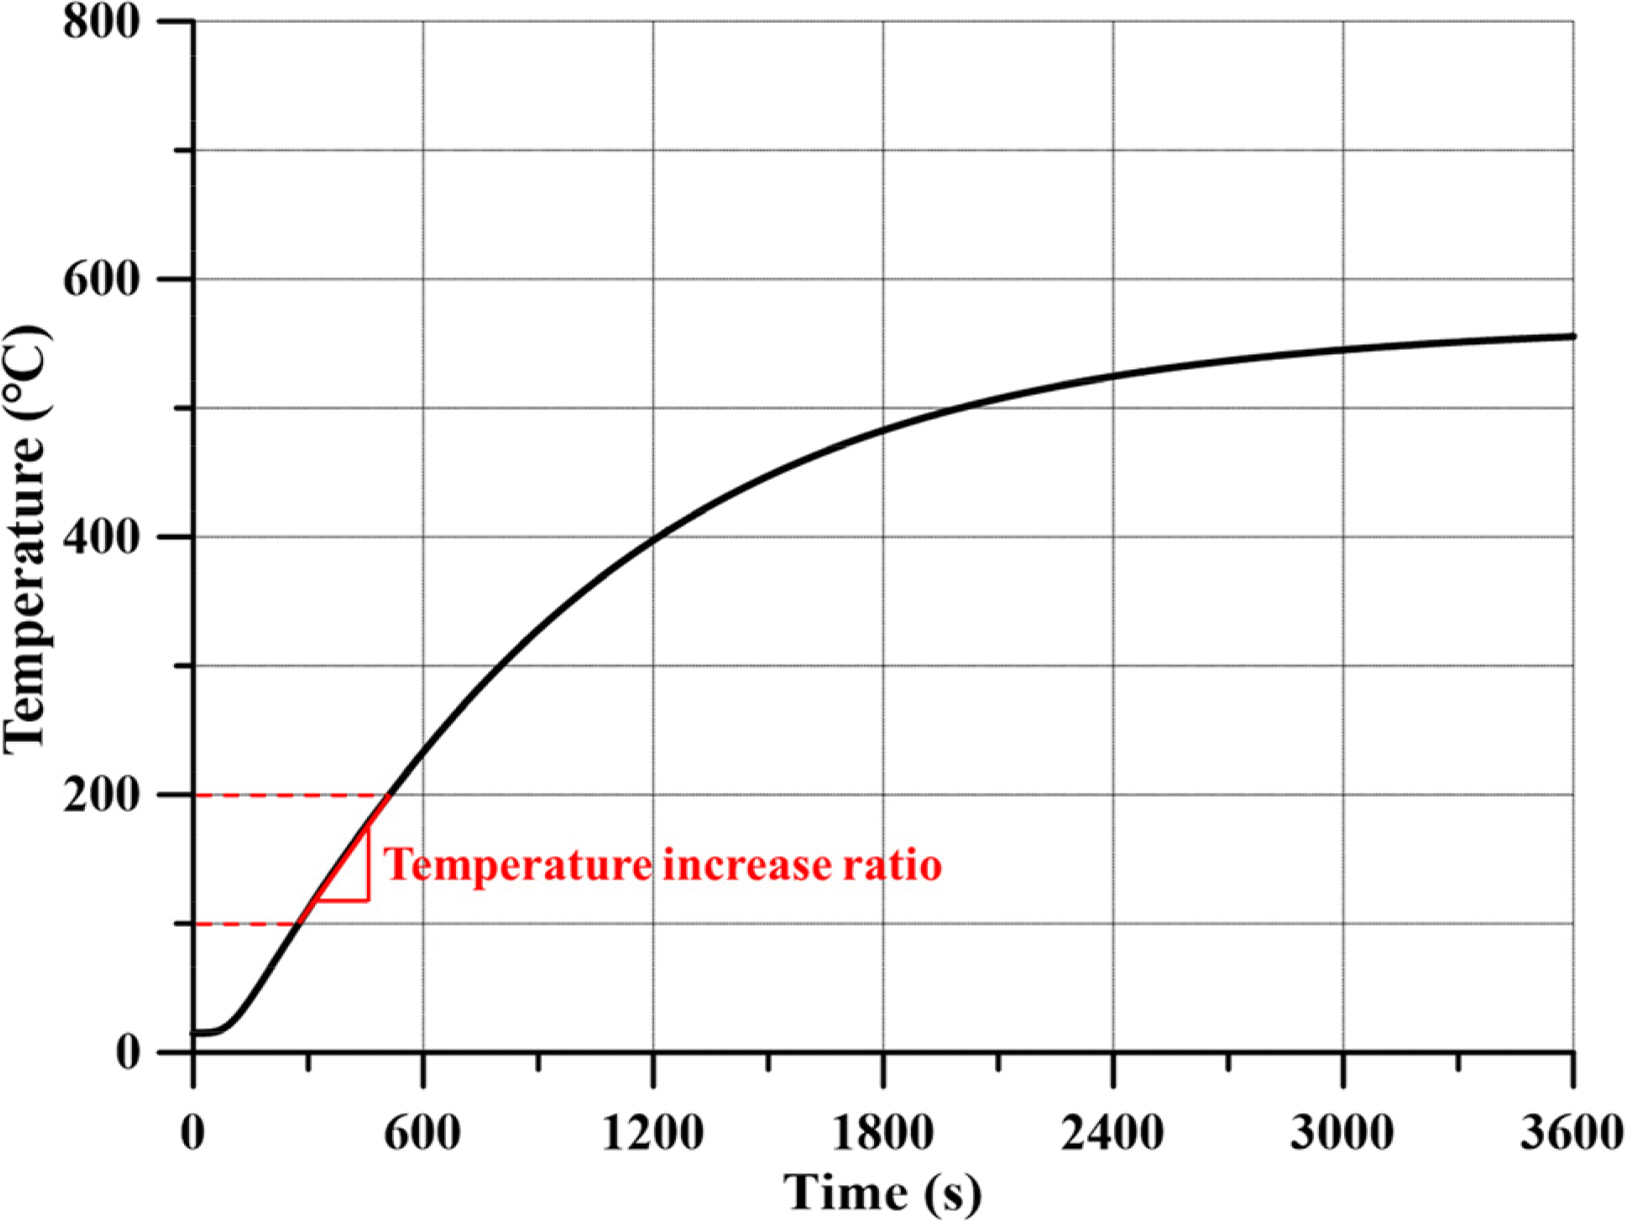
Computational method of temperature increase ratio
Based on the results of Figs. 17–19, the maximum temperature, temperature increase rate, and time to reach reference temperature of fire-exposed and unexposed surfaces were organized in Table 6 by each measurement point. The temperature between 100–200°C tended to increase at an inclination of 0.59–3.70 depending on the degree of damage. Thermal-structural response analysis showed that the time to reach the reference temperature of the firewall panel collided with the corner of a cube scattered at a velocity of 10 m/s was a minimum of 5.63 minutes. Thus, firewall damage is expected to affect the evacuation time and structural aspects.

Comparison of the fire resistance performance.
4. Conclusions
This study presented an advanced firewall design evaluation method for assessing the fire resistance performance associated with impact damage induced by explosions. Nine scenarios were selected to assess the variables for the shape and impact velocity of the fragments during a solid explosion. According to the evaluation method mentioned, the impact analysis was performed to determine the degree of damage owing to the explosion effect. Furthermore, the thermal-structural response analysis of the firewall panel applied with the degree of damage was performed, and the results were analyzed. The following conclusions were derived:
In the present study, the existing fire resistance evaluation method was supplemented, and advanced fire resistance evaluation methods and thermal-structural response analysis modeling techniques were presented.
A firewall panel with mineral wool, one of the materials of PFP, was selected as a target structure, and the impact analysis and the thermal-structural response analysis were performed to analyze thermal-structural characteristics by explosion damage.
A comparison of the fire-exposed and the non-exposed surface of the firewall panel showed that as the temperature difference decreased, the temperature ratio tended to increase as the volume reduction rate of the structure. Scenario analysis showed that when the volume decreased by up to 94.46%, the temperature difference decreased by up to 99.97%, and the temperature ratio increased by up to 57.15%.
A temperature increase rate of 0.41 was observed in the case of intact firewalls, but the temperature increased sharply to 0.59–3.70 in the case of damaged firewalls. Furthermore, the time to reach the reference temperature, 607.37°C in this paper, was reduced by 90.62% compared to the intact firewall with a minimum of 5.63 minutes, depending on the degree of damage.
Mineral wool is an insulating material and does not guarantee the resistance of the structure to damage, and research on dynamic material properties is insufficient. In this study, the dynamic fracture strain of mineral wool was estimated by parametric studies. Therefore, it is s necessary to derive the dynamic material properties through experiments on the target load, when a close investigation of the damage behavior characteristics of firewalls, including insulation materials, such as mineral wool materials.
The fire resistance performance was analyzed in terms of the temperature difference and ratio, temperature increase rate, and the time to reach reference temperature between both surfaces of the firewall panel. As a result, there was a clear difference in performance depending on the degree of damage. This method is anticipated to be a variable when calculating the design load considering the explosion impact.
The advanced method can reduce the damage to human life and property caused by fires and explosions. The fire resistance performance evaluation considering fire/explosion accidents will be effectively realized if appropriate standards are in place for the proposed evaluation method.
Acknowledgements
Some part of this study was presented in the 2022 Ocean Engineering CAE competition of the Korean Society of Ocean Engineers (KSOE).
Notes
Jung Kwan Seo serves a journal publication committee member of the Journal of Ocean Engineering and Technology, but he had no role in the decision to publish this article. No potential conflict of interest relevant to this article was reported.
The authors would like to acknowledge the financial support provided by the Defense Rapid Acquisition Technology Research Institute (DRATRI) of Korea (Project code 912849501).