1. Introduction
Marine accidents can develop into disasters causing large casualties and enormous environmental and property damage owing to their nature. An early response to a marine accident can play a key role in preventing the spread of the accident. Therefore, a damage control system and decision support system must be introduced to accurately detect an accident at its early stage and help the crew to recognize and respond to it (KRISO, 2017). As a study on the flood accident response system, a decision support system for active responses, such as ballasting of damaged ships, was developed (Lee, 2006; Calabrese et al., 2012; Hu et al., 2013; Hu et al., 2015). In these studies, damage information such as the extent and location of damage must be given by crew members or sensor data. In general, direct search for the location of damage by crew members in a ship with a complex structure may cause another safety problem.
Meanwhile, a mathematical model and virtual environment-based decision support system for real-time progressive flooding simulation of damaged ships were developed (Ruponen et al., 2012; Varela et al., 2014; Varela et al., 2015; Varela and Soares, 2007). This flood simulation system is reliable if the initial conditions for hull failure are accurately designed. Furthermore, a sensor-based study was conducted to estimate initial conditions for flooded compartments and to calculate progressive flooding (Ruponen et al., 2017; Bertheussen Karolius et al., 2018; Karolius et al., 2021). If the vessel is equipped with sufficient sensors, the flooding situation can be monitored in real time. However, flooding may not be detected depending on the position of the ship or the accident situation with the flood sensor installed only under safety regulations, and installing flood sensors that can monitor the entire ship in various situations is not cost-effective.
In this study, an algorithm for predicting the location of damage was developed by learning the heave, roll, and pitch motion data with restoring force among motion data obtained from the damaged ship simulation using an RNN(Recurrent Neural Network) model. It can be used for decision-making in case of progressive flooding simulation or accident response by predicting the location of damage with high accuracy without using flood sensors or direct searching by a crew member. In the prior study (Son et al., 2021), an algorithm for predicting the location of damage was developed using the short time Fourier transform (STFT) to obtain the case most similar to the real-time ship motion data among the damaged ship simulation data in various scenarios. Time-series data was transformed to a spectrogram matrix using STFT, and the real-time motion data converted under the same conditions were compared with all simulated scenarios to predict the damage location. The F1-score, used as an index to evaluate the accuracy of the model, is the harmonic average of Precision and Recall and is an index that expresses the accuracy of the model better than Accuracy when the data is unbalanced by class. In prior studies, the F1-score was observed to be as high as 0.90. However, comparing real-time ship motion data and simulation-based damaged ship motion data requires considerable computation, and further improvements are needed. As a follow-up study, the time series data was learned using an RNN model, and by comparing the results with those of the prior studies, the applicability of the damaged location prediction model using damaged ship motion data was reviewed.
2. Research Methodology
2.1 Recurrent Neural Network
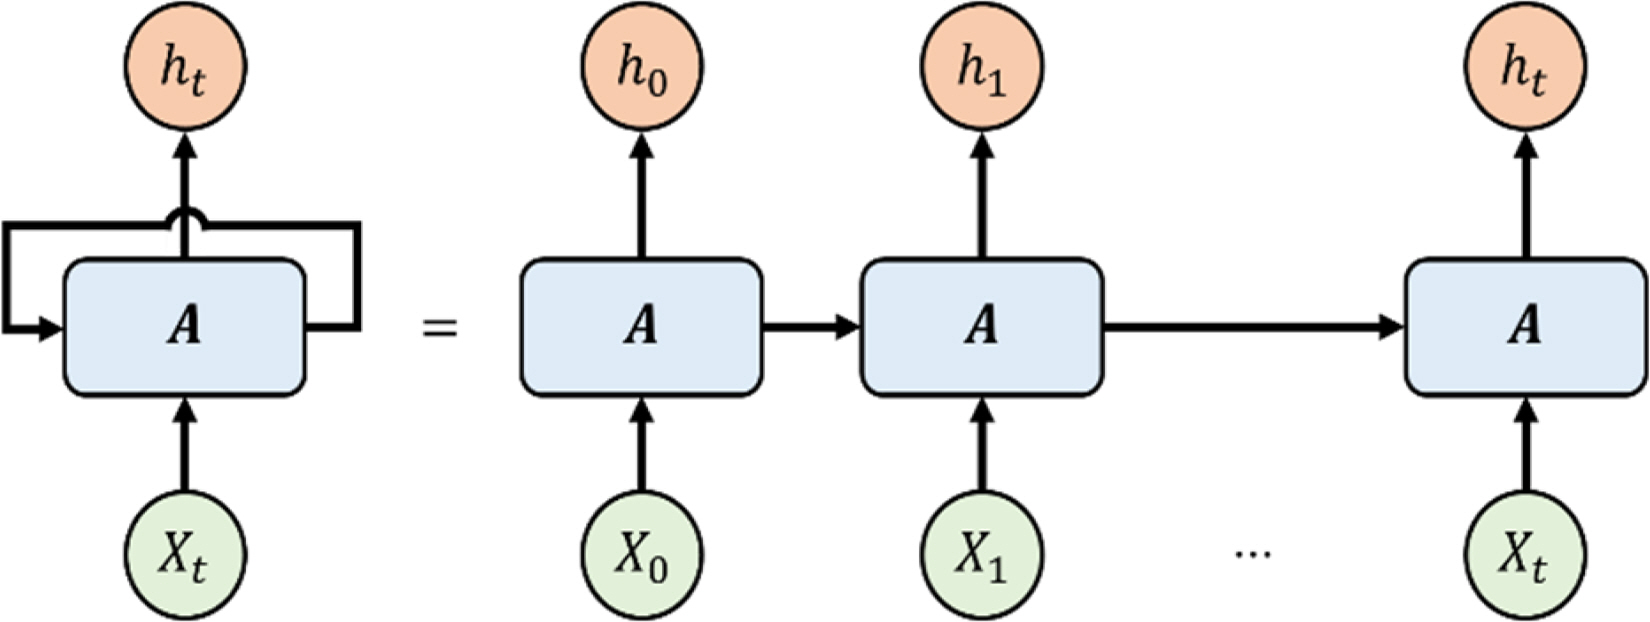
As shown in Fig. 1, a recurrent neural network (RNN) predicts by considering the data input at the previous time and at the current time. RNNs with these characteristics are widely used in natural language processing, machine translation, text analysis, emotion recognition, sentence generation, sensor data analysis, and image analysis (Kim, 2020). However, a simple RNN is not applicable when learning data showing trends over a long period of time through a backpropagation algorithm. A problem exists in that inferring a relationship is difficult when the position between the existing input data and the data to be referenced increases. This causes gradient exploding and gradient vanishing. Long short-term memory (LSTM) was developed to solve this problem (Noh and Cho, 2021).
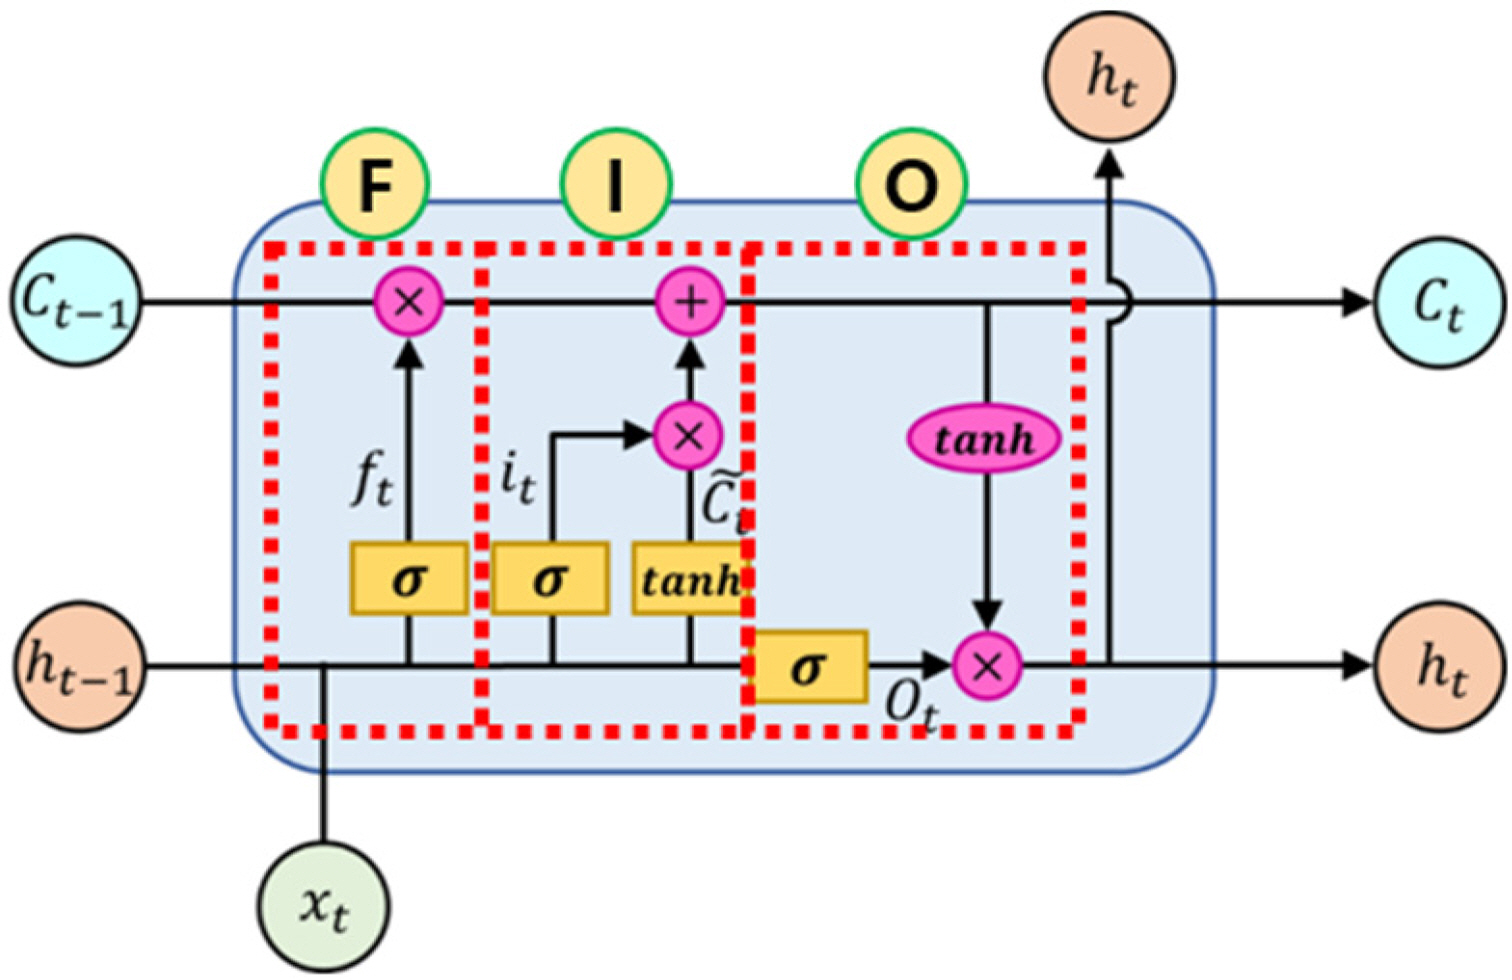
Unlike conventional RNNs, LSTM introduces cell state to enable long-term memory. At time t, the LSTM structure consists of a forget gate, an input gate, and output gate. In Fig. 2, F, I, and O boxes represent the forget, input, and output gates, respectively.
As shown in Eq. (1), A forget gate is a part used to erase unnecessary information from the cell state by deciding what information from the past should be retained. In this case, ht − 1 represents the hidden state at t − 1, xt represents the input data at t, and Wf and bf represent the weight and bias of the forget gate, respectively. Using sigmoid function σ, unnecessary information is assigned a weight close to 0 to forget the information, and important information is assigned a weight close to 1 to learn to completely preserve the information. The calculated ft is transferred to the cell state for the next operation.
The input gate is a gate for storing current information as shown in Eqs. (2)–(4). Using current input value xtand previous hidden state ht − 1, it indicating the degree to remember the current input value and the current local state C̄t are obtained. Global cell state Ct to be transmitted to the next hidden state is determined by reflecting the received previous cell state Ct− 1 . In this case, Wi and bi denote the weight and bias of the input gate, respectively, and WC and bC denote the weight and bias of the cell state, respectively.
As shown in Eqs. (5) and (6), the output gate calculates current hidden state ht that will be delivered to the hidden layer reflecting current global cell state Ct obtained with ot, which expresses the extent of memory of the current output value calculated using previous hidden layer ht − 1, and current input value xt. In this case, WO and bO denote the weight and bias of the output gate, respectively.
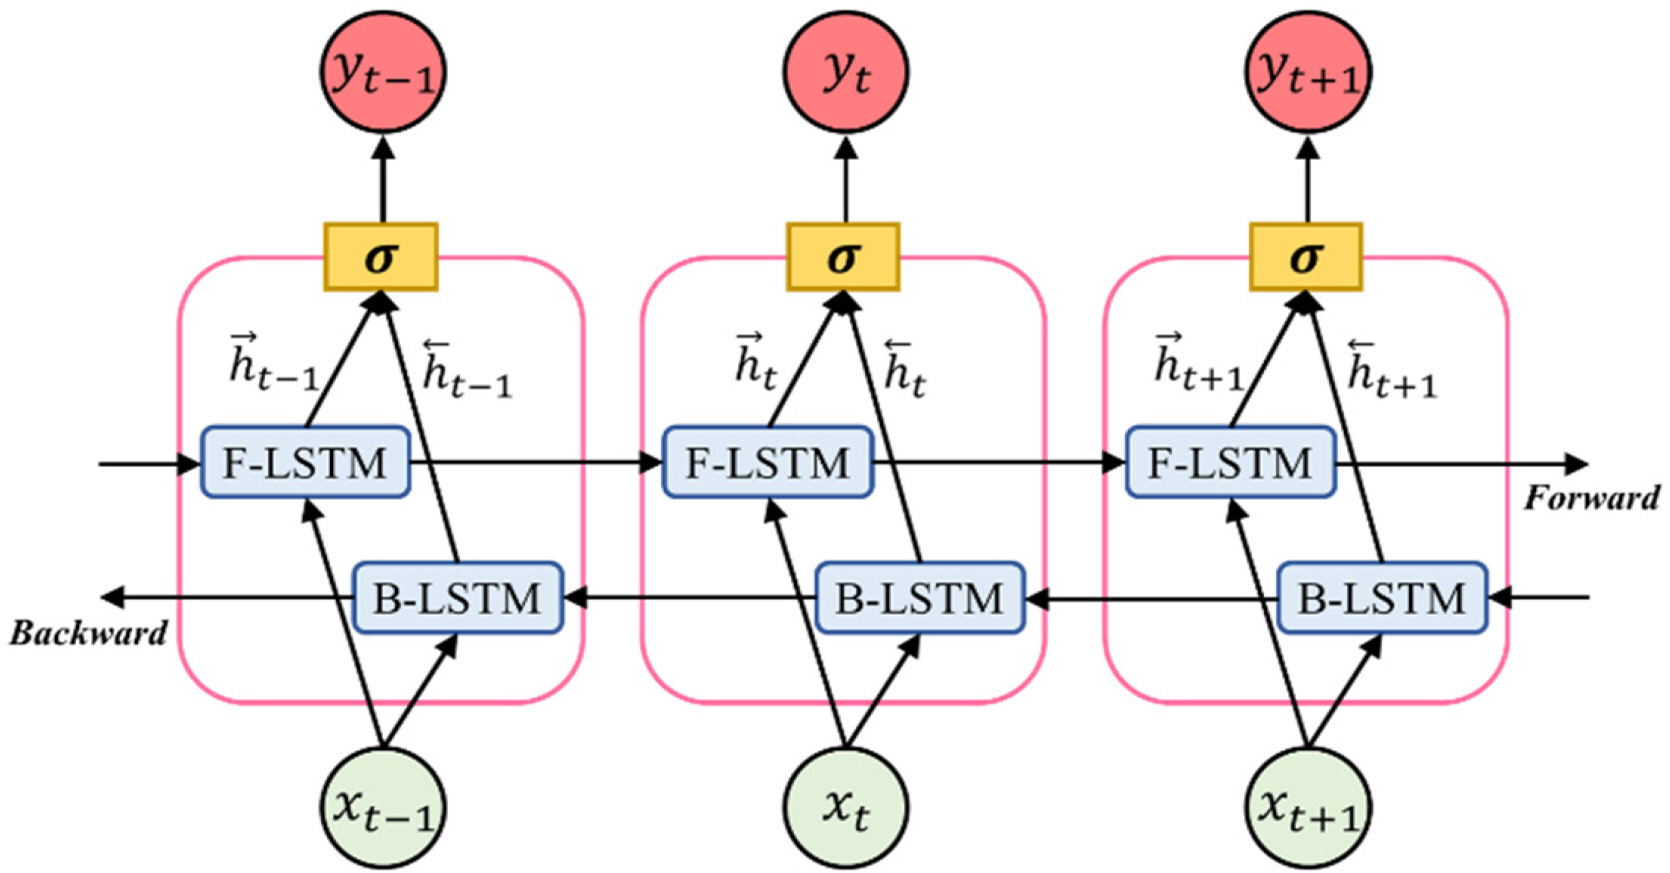
Bidirectional LSTM (BiLSTM) is a combination of forward LSTM (F-LSTM) and backward LSTM (B-LSTM) as shown in Fig. 3. When time series data of a certain length is given as an input, F-LSTM learns time series data in the same order as the input, and B-LSTM learns in the reverse order of the input. Each F-LSTM and B-LSTM learn independently to derive each hidden layer. When LSTM is applied to time series data, a certain length of the data for each feature is used as one input. Input values are generated at regular intervals by overlapping. In this case, the length of the input time series data is called the window length. These BiLSTM models are being widely used in time series classification and prediction fields such as natural language processing and handwriting recognition, and in most studies, they performed better than ordinary LSTMs.
2.2 Multiple Classification Model Performance Indicators
A confusion matrix is a representative method used to evaluate the performance of a classification model. As shown in Fig. 4, the matching types of the actual class and the predicted class by the classification model can be divided into four types. True positive (TP) indicates positive being classified as positive, true negative (TN) indicates negative being classified as negative, false negative (FN) indicates positive being classified as negative, and false positive (FP) indicates negative being classified as positive.
Accuracy, Recall, Precision, and F1-score are major indicators of model performance as a confusion matrix and are defined by Eqs. (7)–(10).
Accuracy is the ratio of the number of correct answers, that is, the number of TP and TN predictions, to the total number of predictions. Although it most intuitively indicates the performance of the model, if the number of negative and positive data is unbalanced, the reliability of the indicator decreases. Therefore, Recall, Precision, and F1-score are introduced. Recall is the ratio of the true positive value of the actual positive value. Precision is the ratio of the true positive of the positive predicted value. F1-score is the harmonic mean of Recall and Precision. F1-score can evaluate the performance of a classification model even when the data are imbalanced (Park et al., 2020). In this study, classification performance was evaluated using the F1-score obtained by assigning different weights according to the amount of data in each class.
3. Data and Learning
3.1 Damaged Ship Motion Data
A 5,200-ton class vessel of the Korea Institute of Maritime and Fisheries Technology with the main specifications of 145 m in length, 18 m in width, and 7.5 m in depth was used as a simulated model in this study.
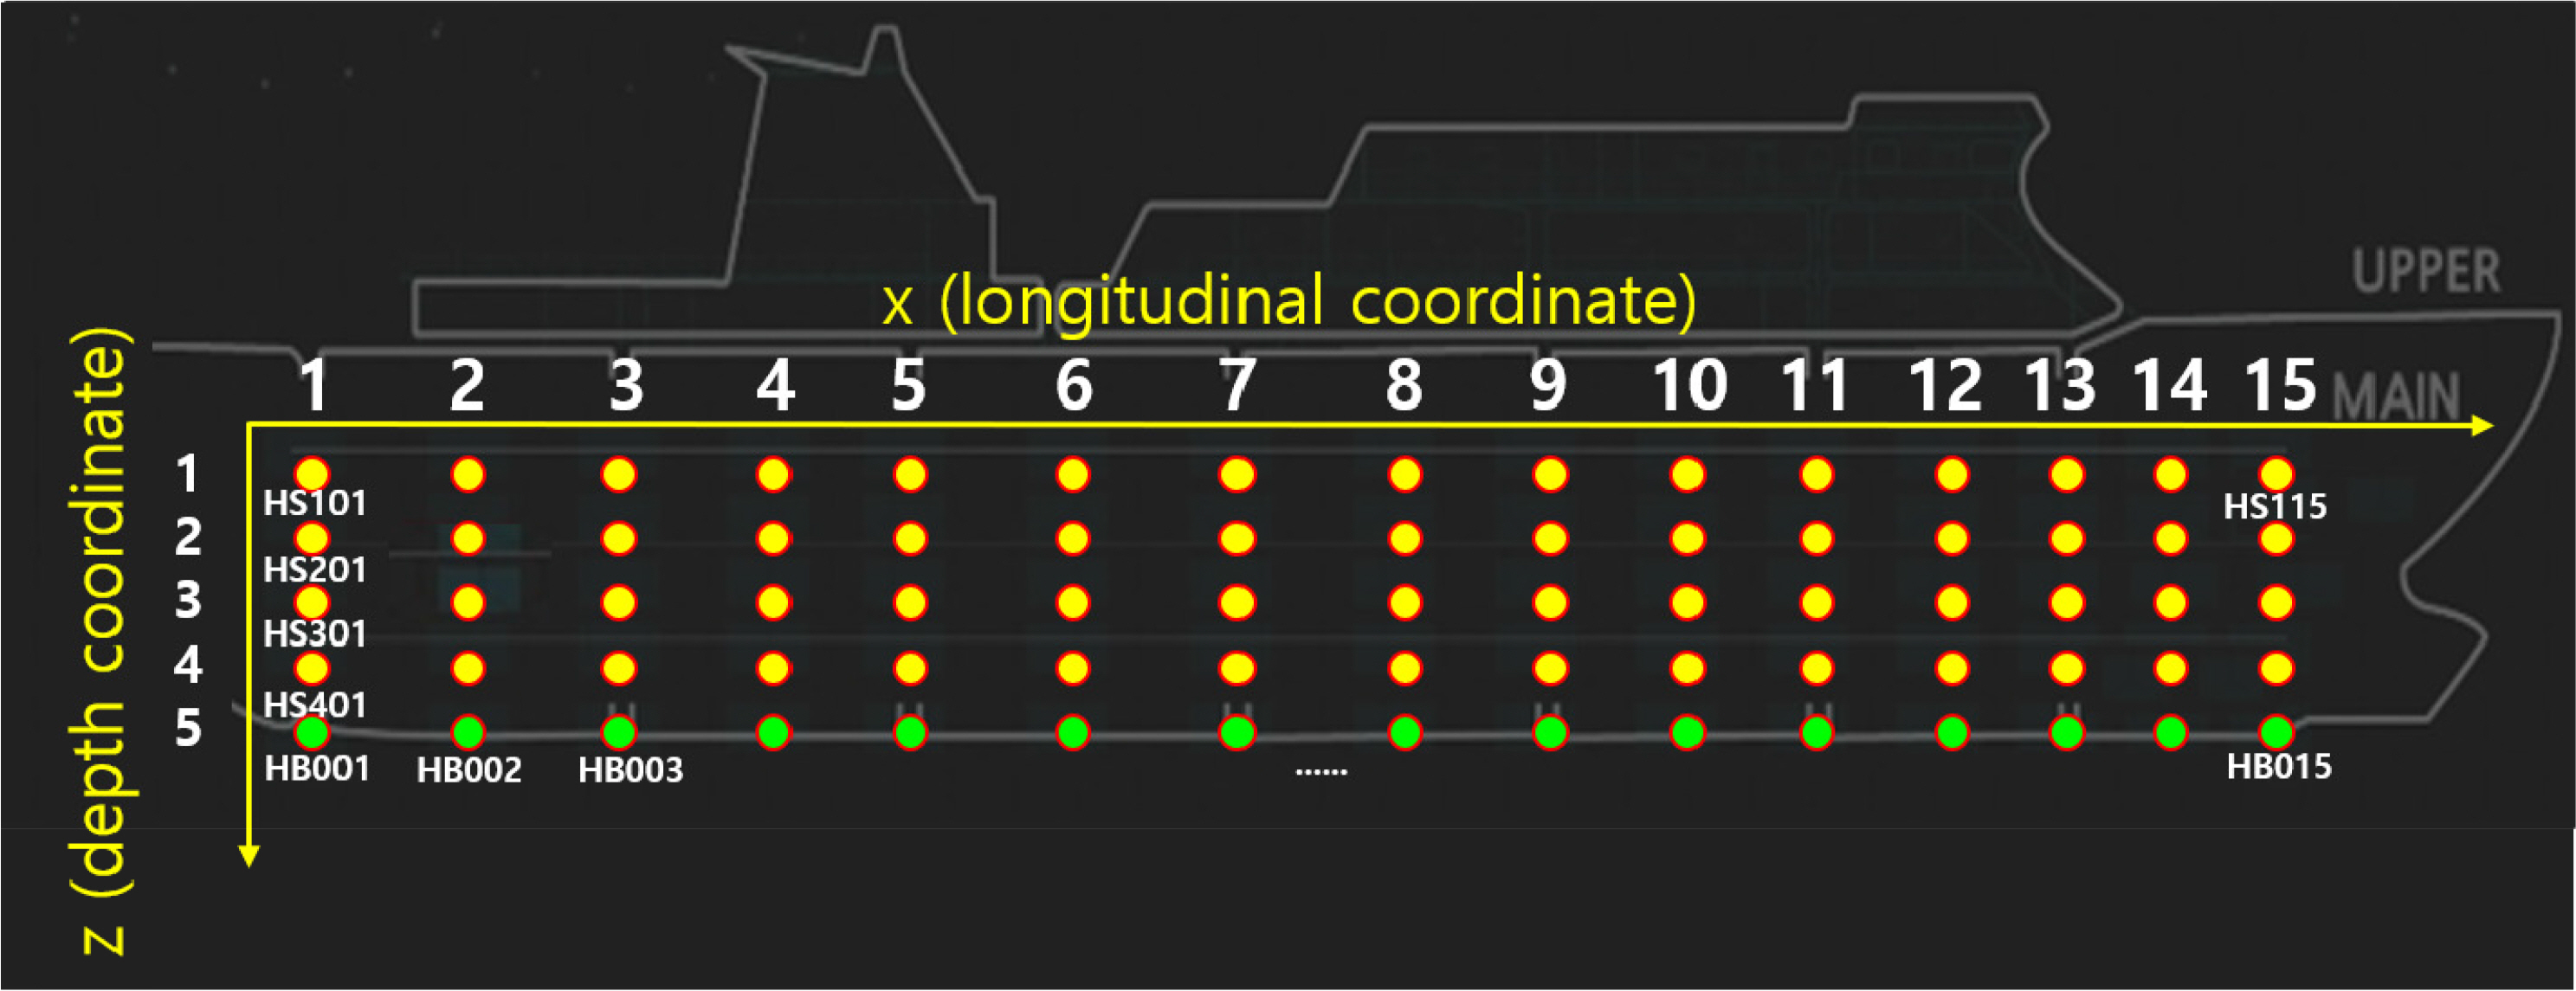
The motion data of 5400 scenarios were obtained by simulating the behavior of the damaged ship for 1 h with a combination of 75 damaged locations, three damage sizes, three sea states, and eight regular wave incident angles. The Korea Research Institute of Ships & Ocean Engineering in-house code ‘SMTP’ (Lee, 2015) was used for the simulation. As shown in Fig. 5, the damage location was divided into 75 with 15 locations in the longitudinal direction, one at the bottom of the ship, and four at the side of the ship in the height direction.
The damage size was divided into 30%, 70%, and 100% of the maximum damage size derived from statistical data (IMO, 2003). In this study, the maximum damage area at the hull side, MaxHS, owing to collision is expressed as Eq. (11), and the maximum damage area at the hull bottom, MaxHB, owing to stranding is expressed as Eq. (12).
Here, L indicates the overall length, D indicates the depth, and B indicates the moulded breadth.
For the sea state, the average wave height and period corresponding to sea states 4, 5, and 6, as presented in Table 1, were applied. The incident angle of the regular wave was simulated by dividing 0° to 315° in eight directions at intervals of 45°.
The downflooding angle is the minimum heeling angle at which an opening that is not watertight and not submerged. Owing to the nature of the simulation, a capsizing criterion for the motion data of the damaged ship is required. Therefore, when the rolling angle was equal to or greater than the downflooding angle, the ship was decided as capsized, and only time series data up to that point were used (DNV GL, 2017).
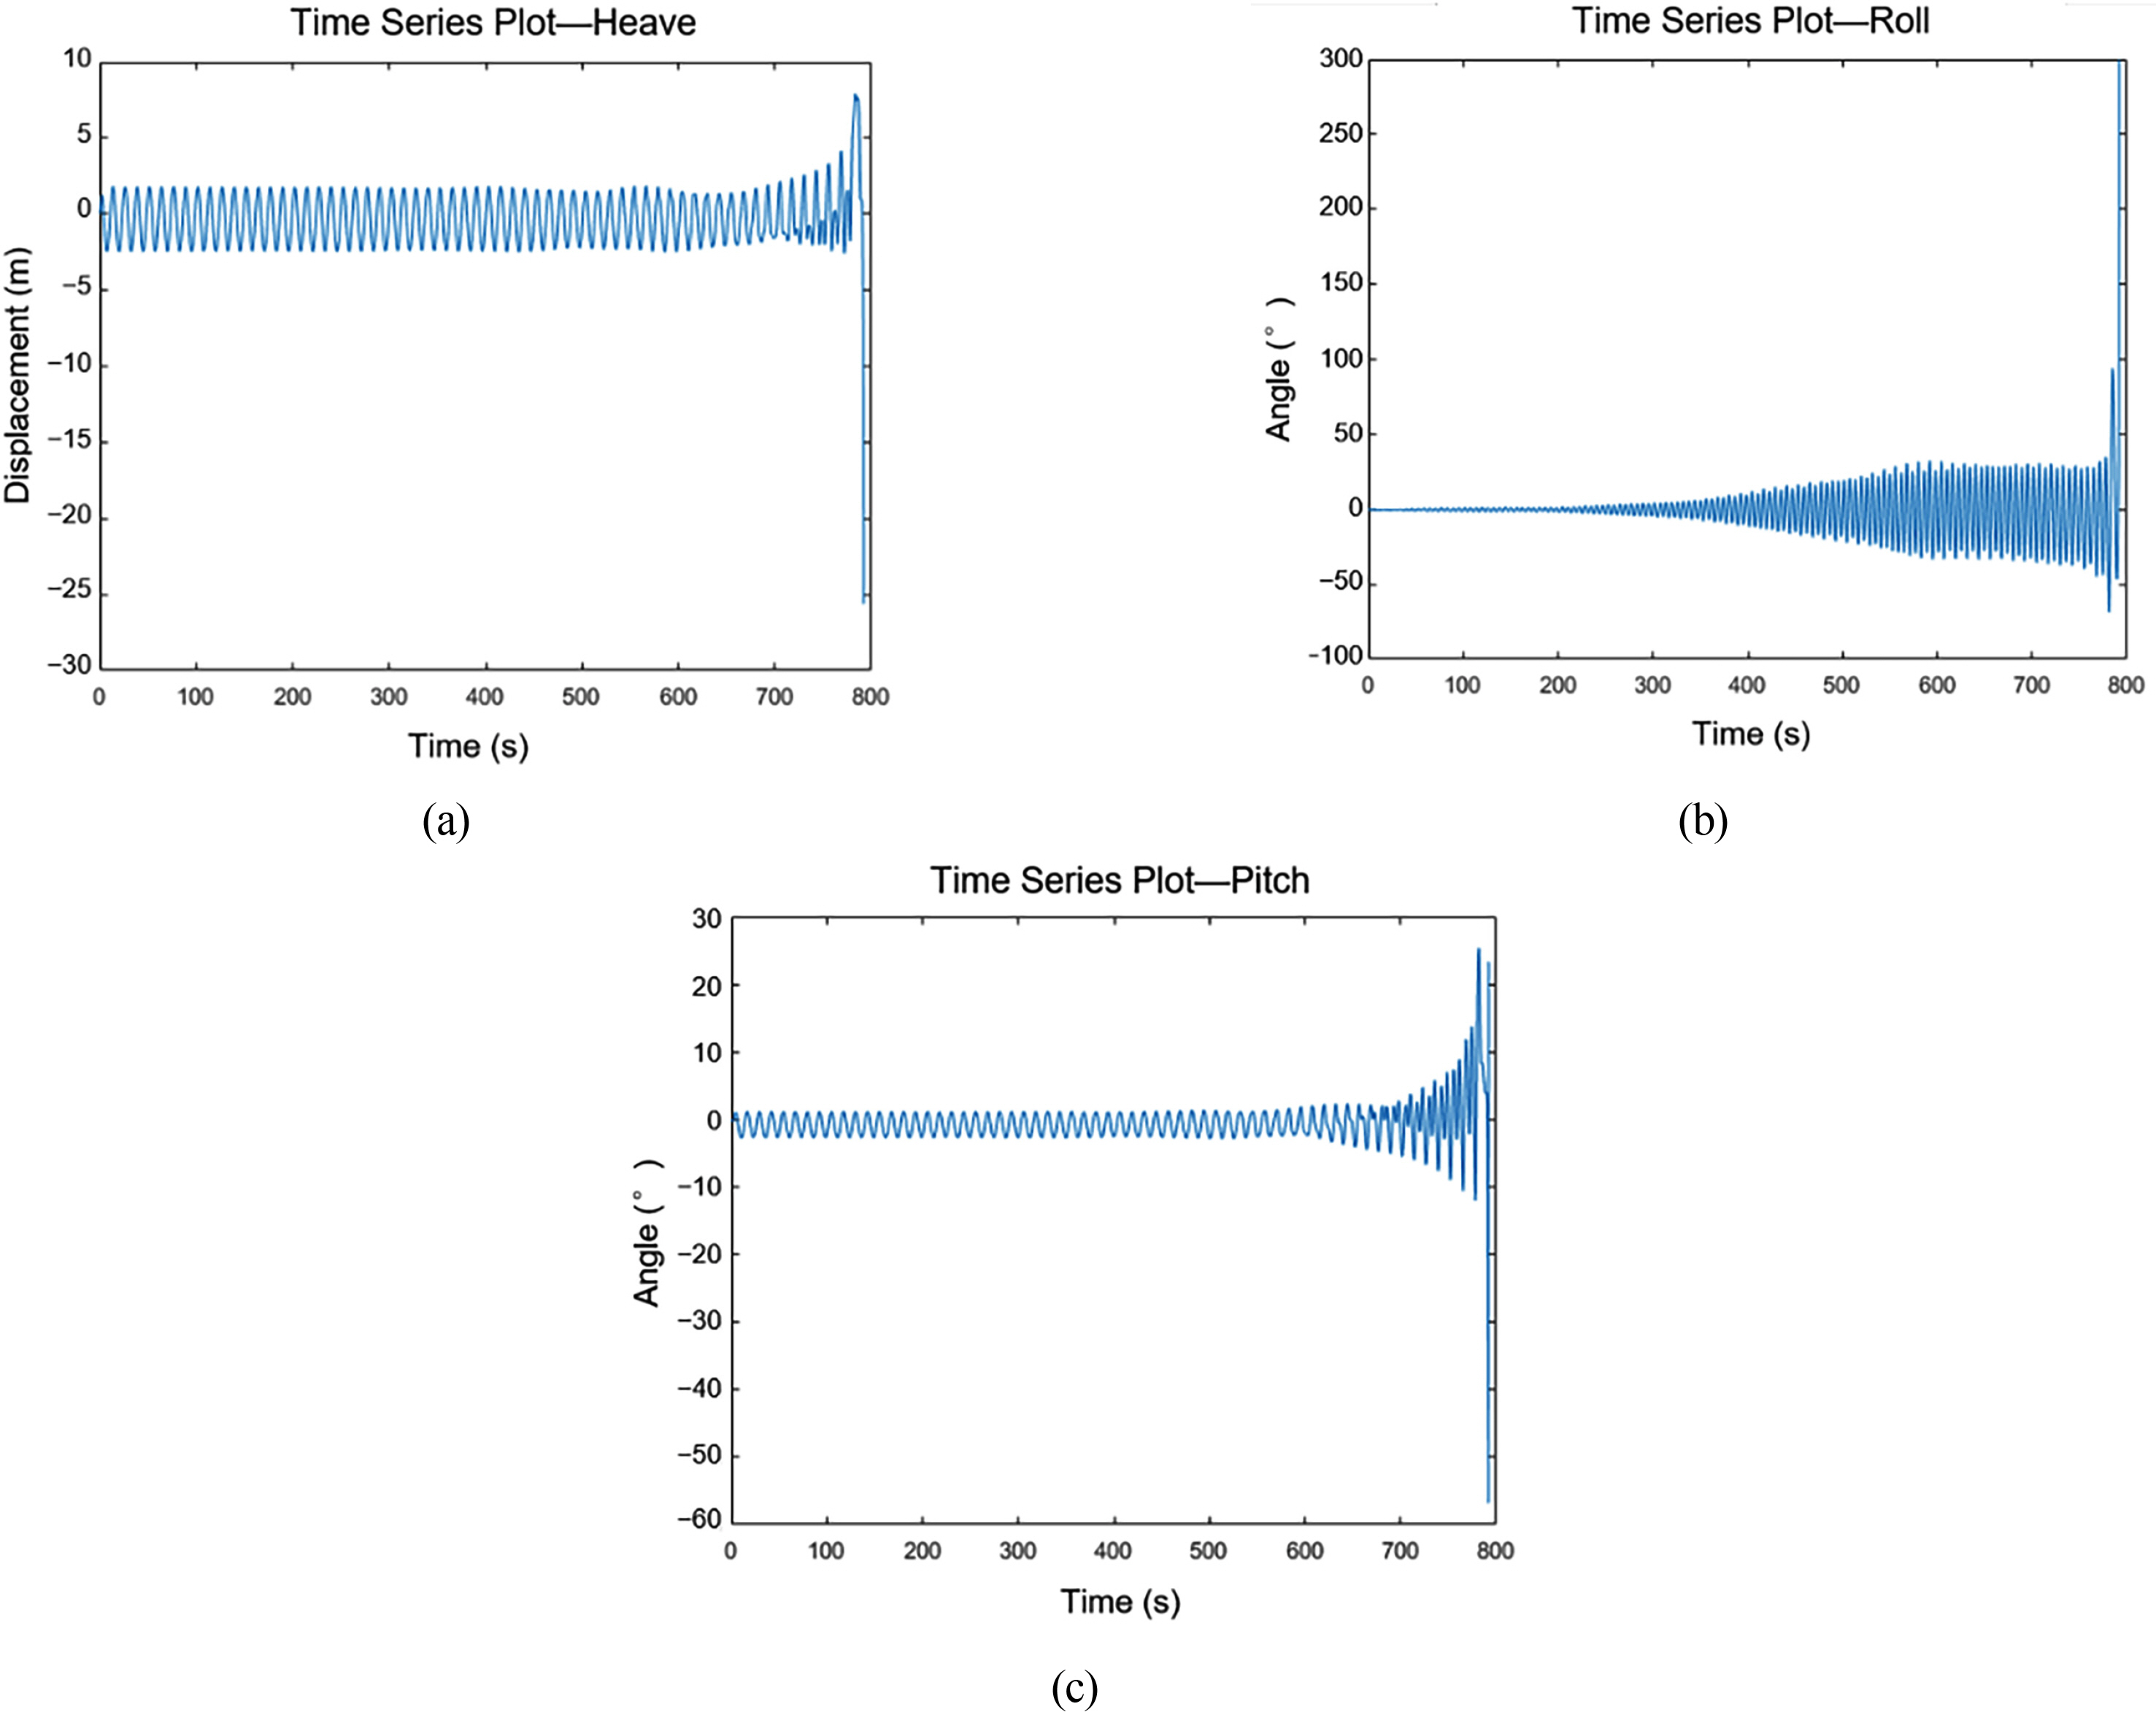
As an example, the case HB001HA100_SS06WA135, which means that the damage location HB001, closest to the stern among damage locations on the hull bottom, the damage size of 100% of the stochastic maximum damage area, sea state 6, the ship motion time series data of heave, roll, and pitch when the regular wave incident angle is 135°, is shown in Fig. 6.
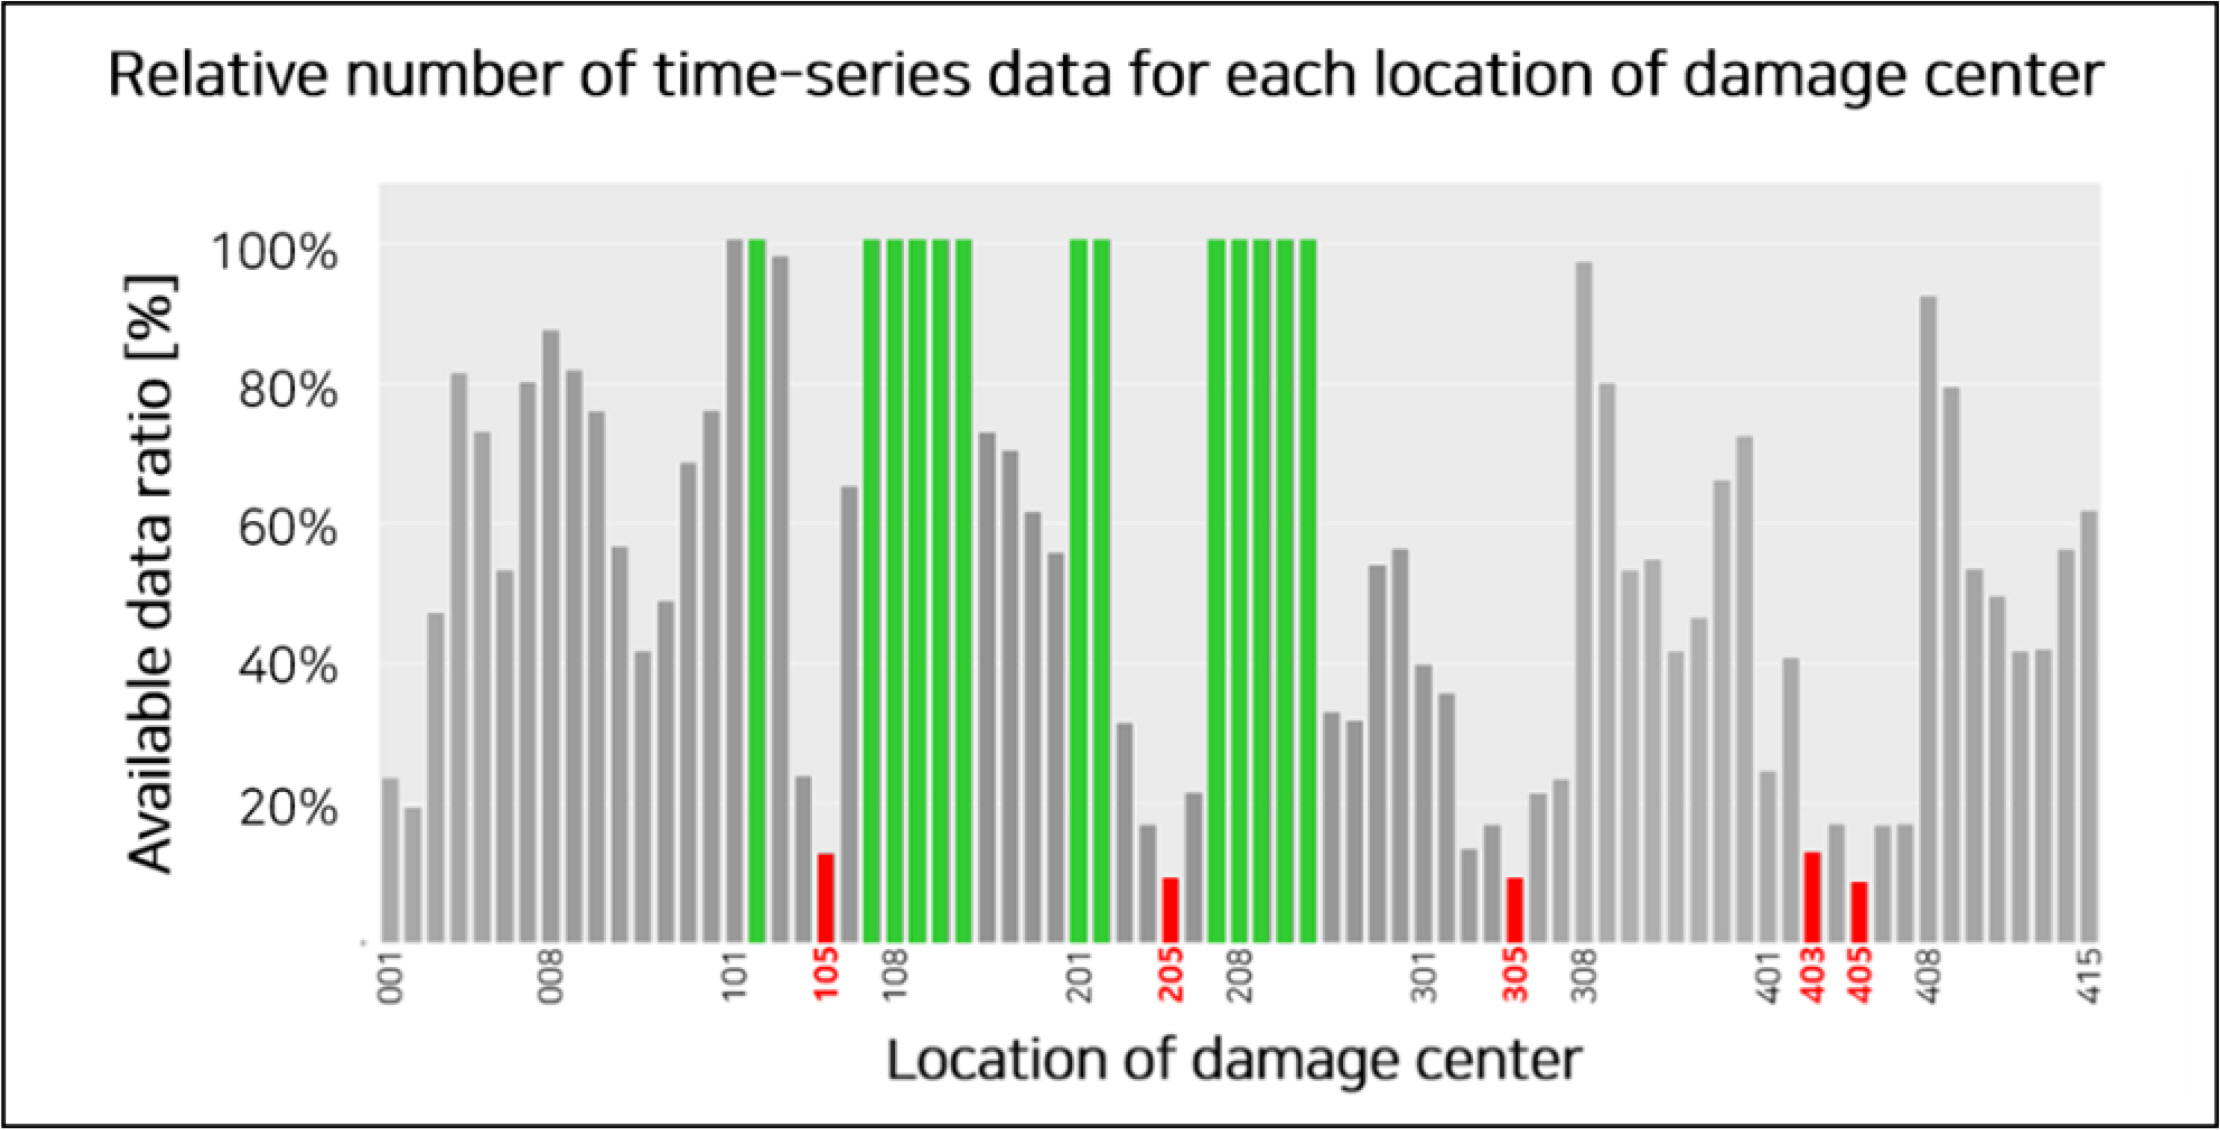
As shown in the example, several cases existed where the capsizing occurred earlier than an hour at a specific damaged location. In this case, the amount of data was small compared with the amount of data corresponding to the damage location where the capsizing did not occur within 1 h even under various conditions. Fig. 7 shows the relative ratio of the number of the data according to each damage location class. As shown in Fig. 7, the number of the data varied depending on the location of the damage. For example, the number of scenarios for each damage location is 72 with a combination of three maximum damage sizes, three sea states, and eight regular wave incident angles. As shown in Fig. 7, in all scenarios where the damage occurred at location 201, the rolling angle of the simulation data did not exceed the downflooding angle of 45°; therefore, all data could be used. However, in the case of damage at location 405, the amount of data available for learning was insufficient than the data at location 201.
3.2 BiLSTM Classification Model
In this study, a prediction model of the damage location was developed by learning the damaged ship motion time series data using BiLSTM. Among the simulation motion data for 5400 damage scenarios, heave, roll, and pitch were learned to learn the relationship between the damaged ship motion and the damage location.
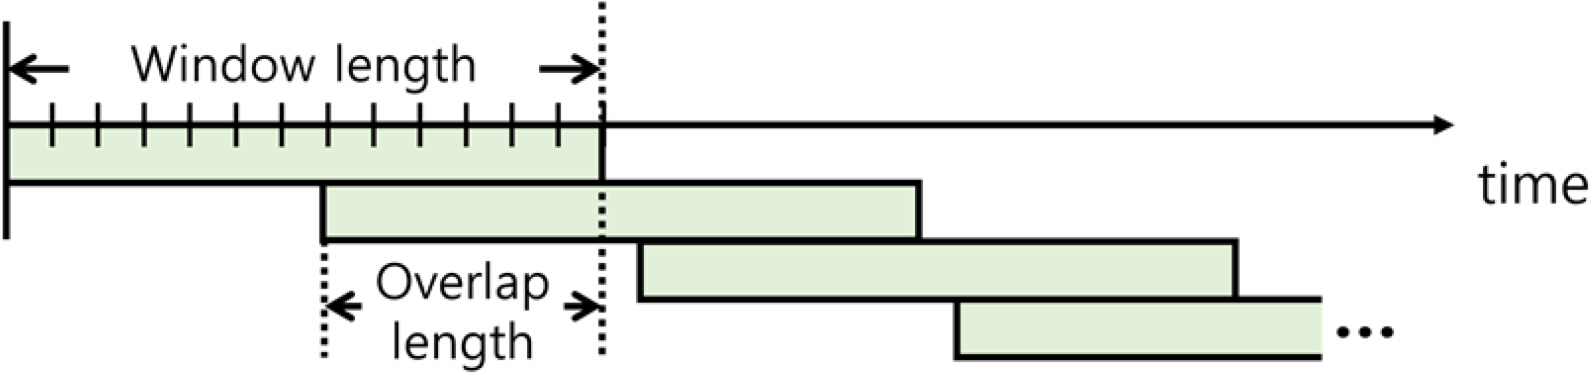
The simulation data used in this study was recorded in every 0.5 s. Because this is a complex wave with a small frequency owing to the nature of the ship motion, the data obtained in units of 0.5 s for 200 window lengths, that is, 100 s, were used as input. In addition, to learn the change in time series data with the passage of time, the overlap length was set to 160 and prediction was performed every 20 s. Fig. 8 shows the window length and overlap length as a concept for using time series data as input values.
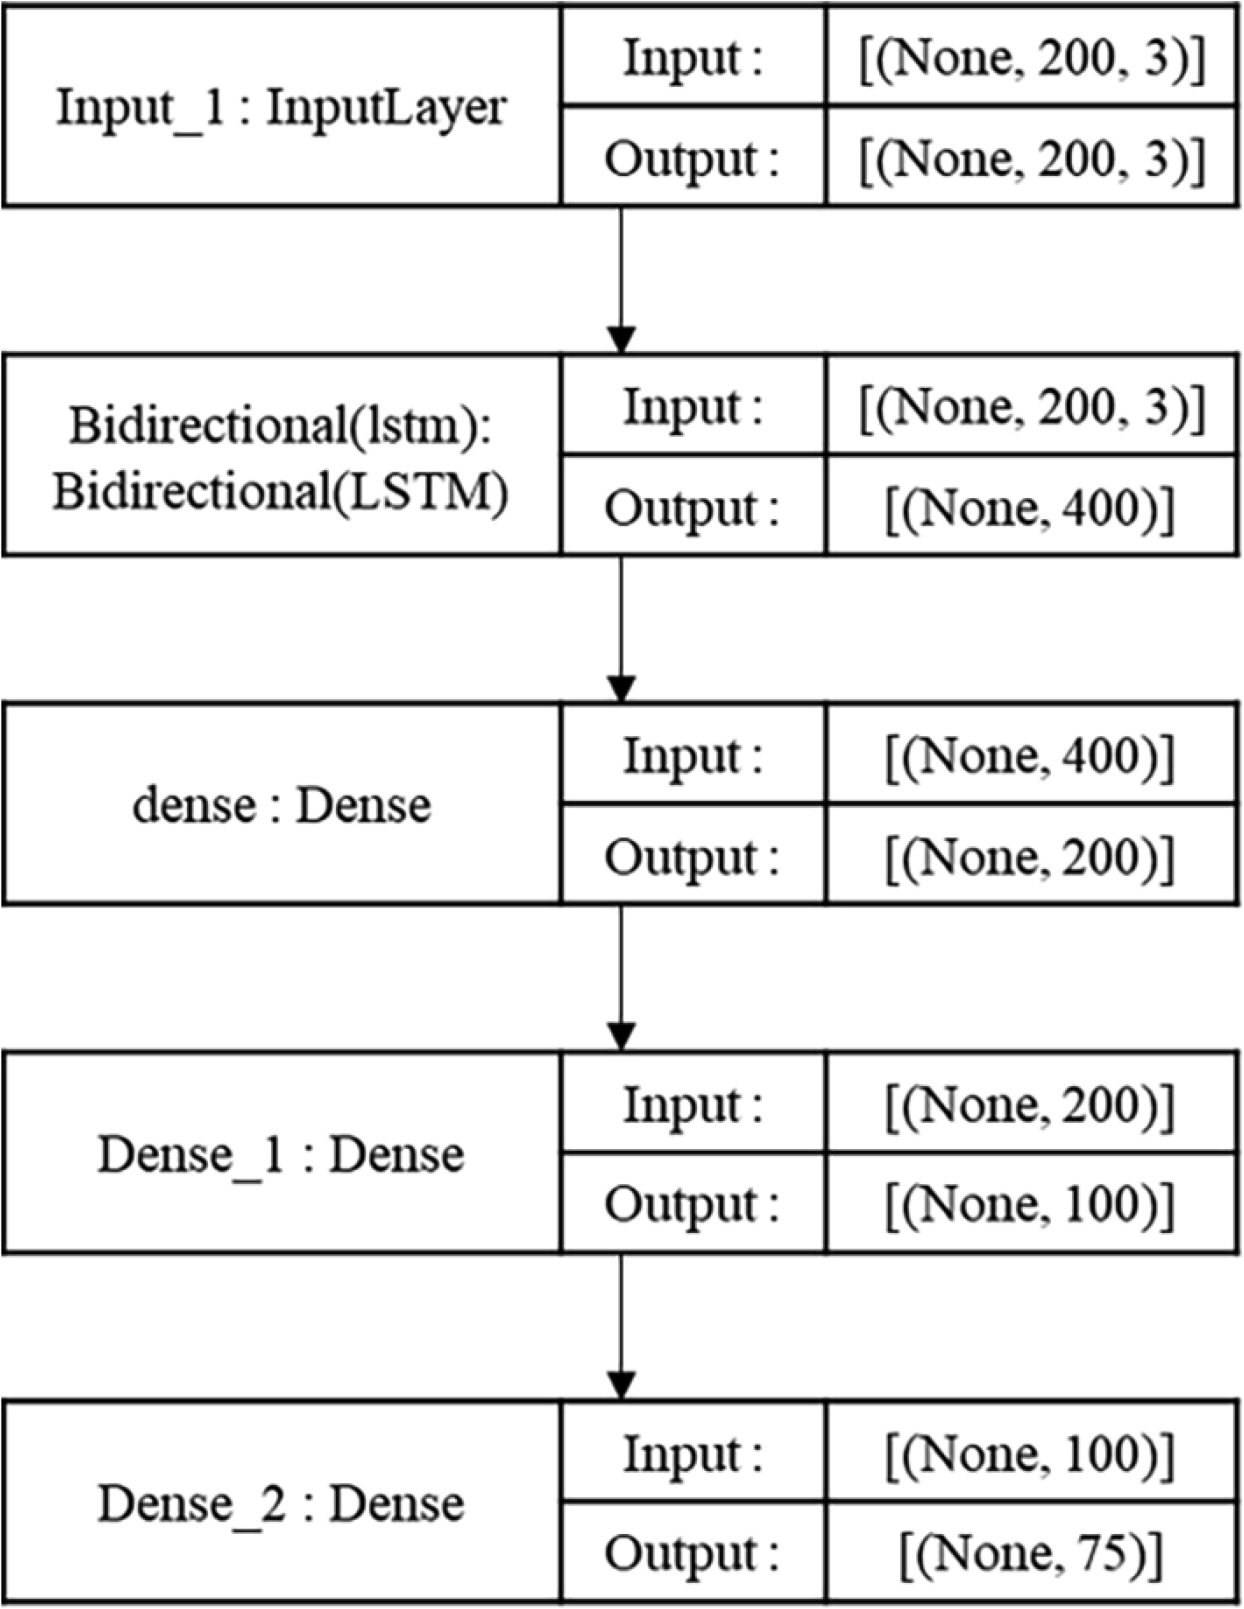
To learn the characteristics of time series data, it should be divided into an appropriate length and used as an input. Because ship motion has a small frequency, it is not easy to learn its characteristics if only short data is used as an input. Therefore, in this study, 200 units of time series data from heave, roll, and pitch were used as an input. In Fig. 9, the unit of InputLayer is [(None, 200, 3)], which implies that heave, roll, and pitch are used as three input features, and 200 time series data are used for each feature. “None” is a factor related to the length of the data to be input and indicates the number of the data that has not yet been determined. The deep neural network consists of a BiLSTM layer and dense layers (fully-connected layer) that reduce the dimension of the layer. The structure of the classification model is shown in Fig. 9. Robust scaler was used for data standardization. Training and testing data of the model was divided at a rate 8:2. For the activation and loss functions, “SoftMax” and “categorical cross entropy,” which are used for multi-classification problems, were used, and the batch size was 64 and epoch 100 was trained. Because of the data imbalance for each class, test data were collected in proportion to the amount of data in each class.
4. Results of the Research
Damage location prediction is a multi-classification problem and data is imbalanced according to each damage location class. Therefore, the final model was selected using the F1-score, a weighted harmonic mean of Precision and Recall, as an index rather than Accuracy. Table 2 presents a comparison of the performance of the previous research model and the model using BiLSTM for 200 time steps.
The F1-scores of 53 of 75 classes were 0.90 or higher. As shown in the error matrix in Fig. 10, most of the classification model is distributed in the diagonal line; this is the case where the correct answer class is matched.
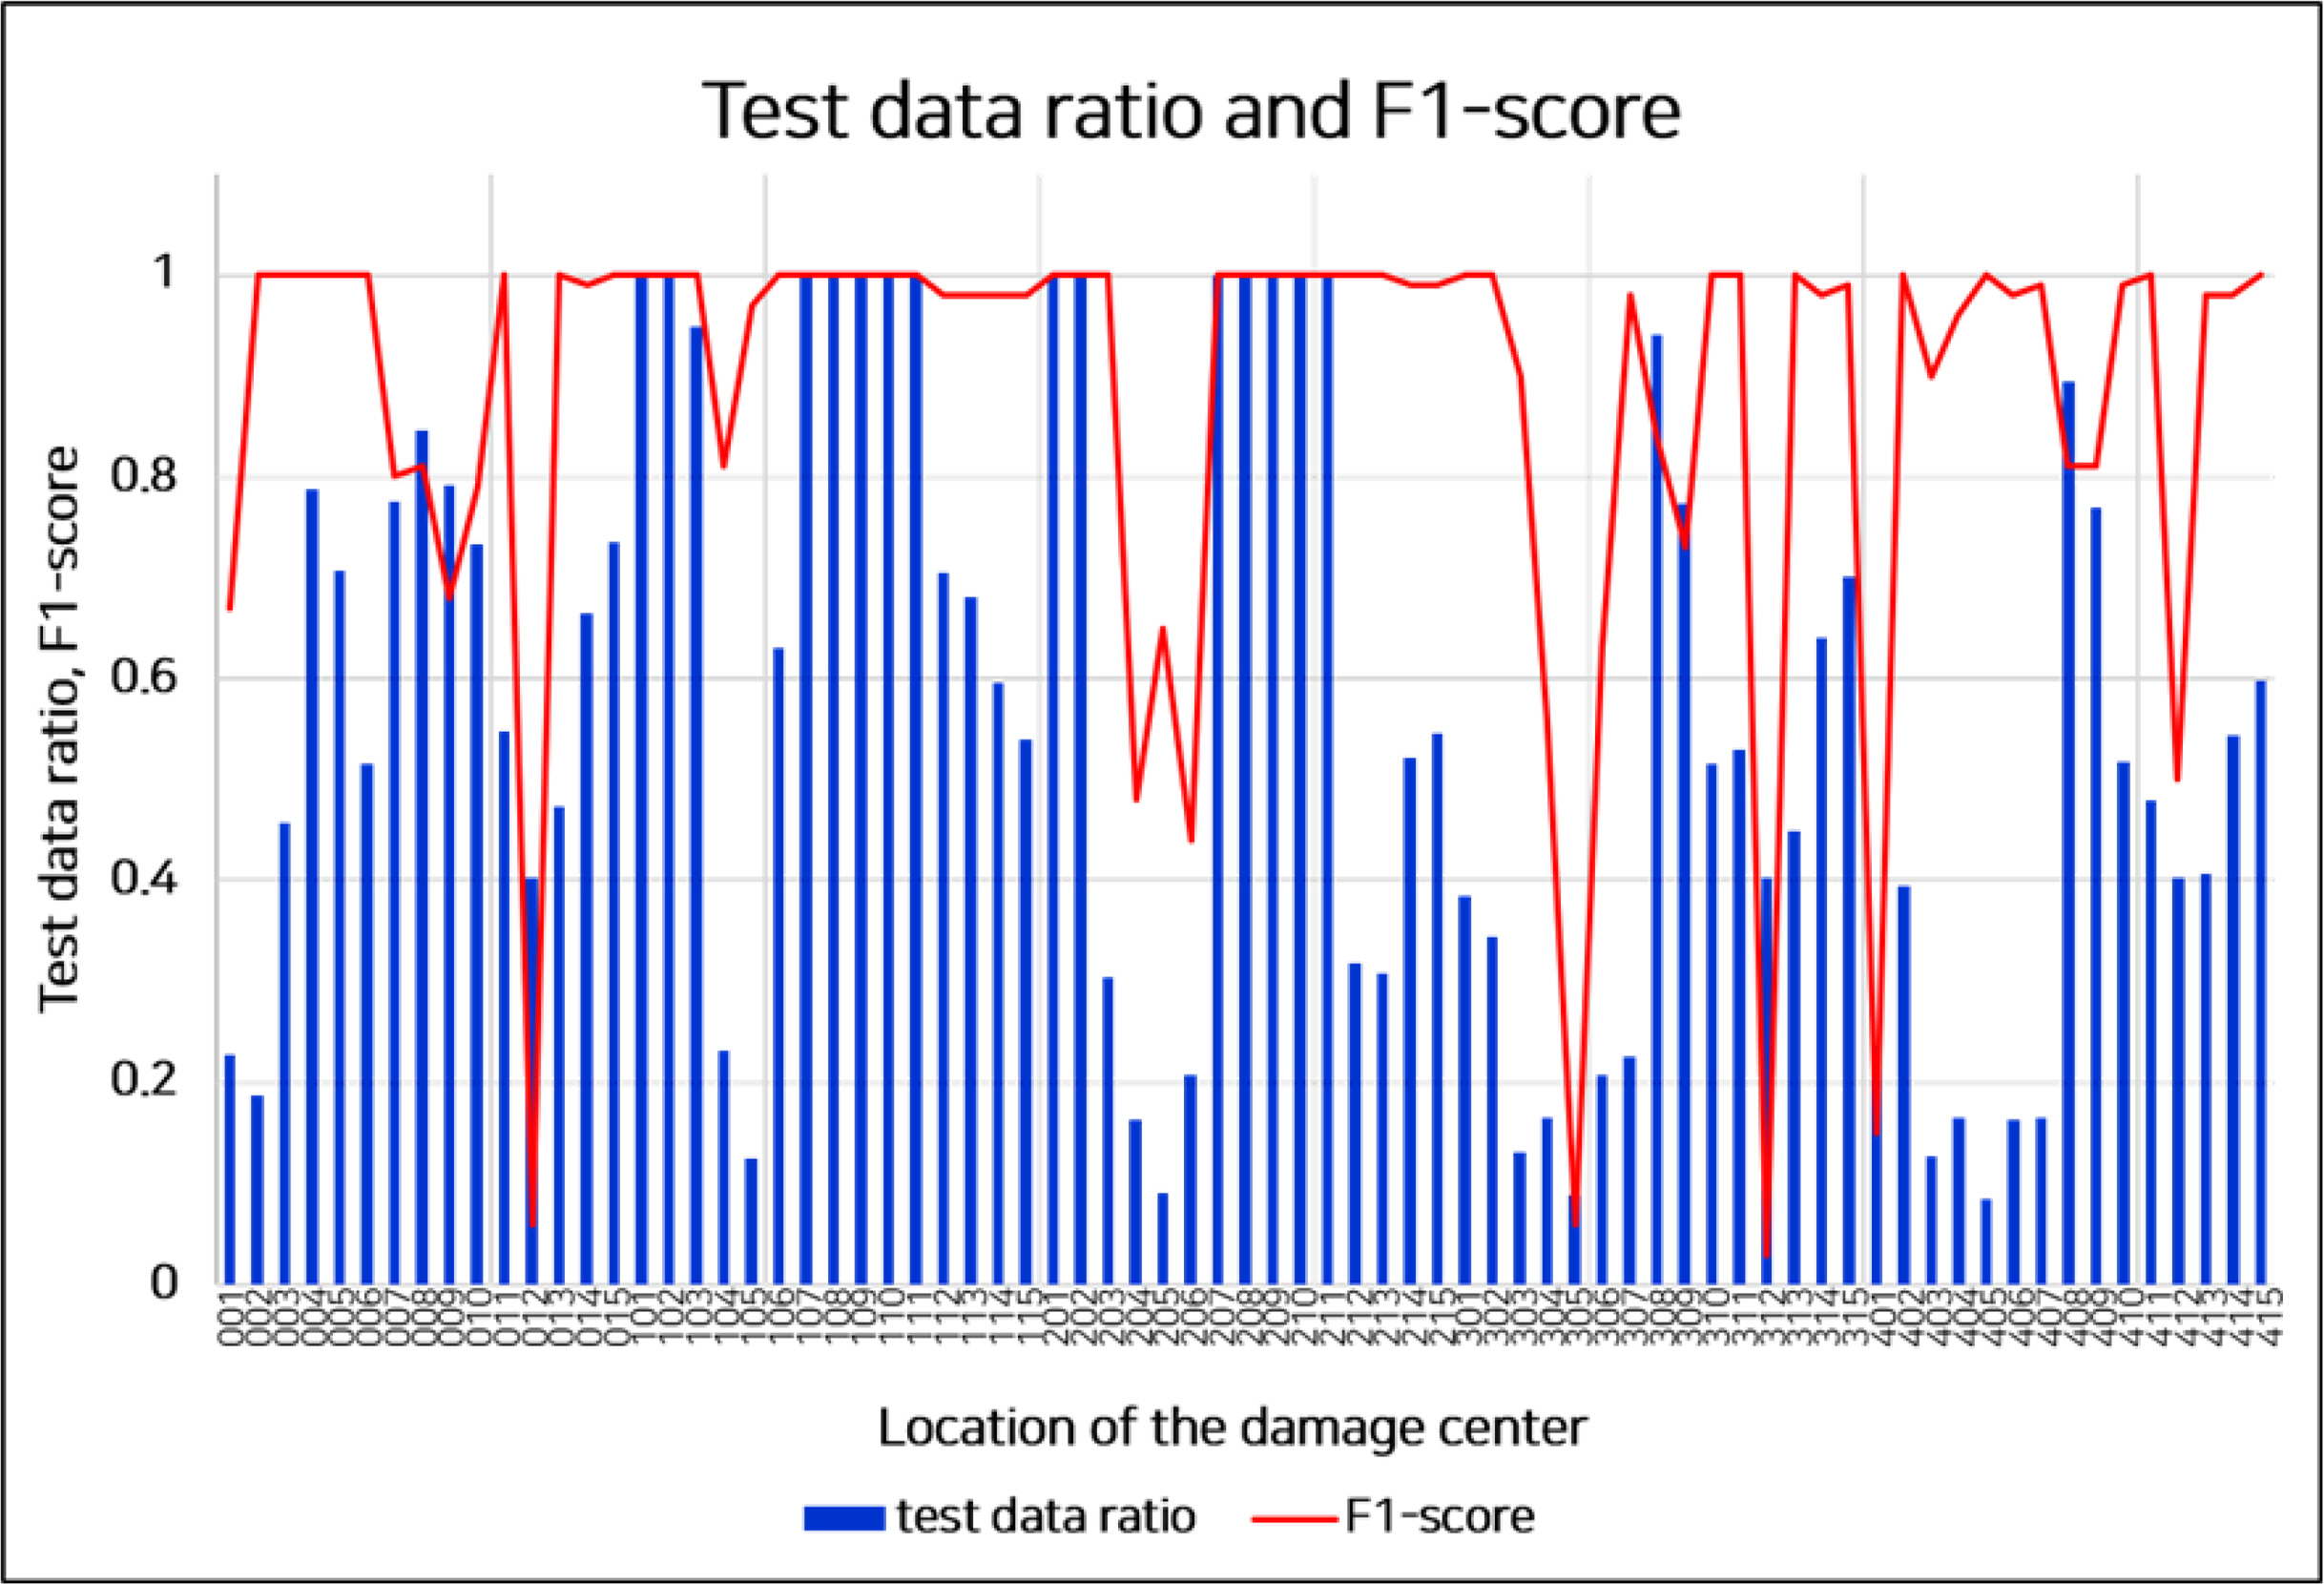
At specific damage locations, flooding tended to proceed rapidly. This implied that a sufficient amount of data could not be collected for all damage locations. Fig. 11 shows data ratios and F1-scores for each of the 75 damage locations. Because the test data was extracted proportionally by each class data, the test data ratio was the same for the entire test. As shown in Fig. 11, the F1-score was low owing to the insufficient amount of the data at some specific damaged locations because of rapidly proceeded capsizing. The number of data and the F1-score of the model are partly proportional.
5. Conclusion
In this study, an algorithm for prediction of the damage location was developed by learning the damaged ship motion time series data with BiLSTM. Through the simulation, the motion data of the damaged ship for 1 h were collected at 0.5-s intervals. A total of 200 units, that is, data collected for 100 s was used as an input, and a model was developed to predict the damage location every 20 s by overlapping the 80% of the previous input.
Consequently, the model showed a high accuracy with an F1-score of 0.92, and 53 of 75 classes showed an F1-score of 0.90 or higher. The damage location prediction model in the damaged ship using this BiLSTM showed better classification performance than the previous model that classified the damage location by converting the ship’s heave, roll, and pitch motions into spectrograms. In addition, computing time and cost efficiency were improved.
The developed model can be used as a part of the flood damage control system. This model enables rapid initial response by predicting the location of damage with high accuracy before proceeding with a direct damage location search by a crew member when the location of damage cannot be accurately determined by flood detection sensors, and it can be applied in case the flooding sensor is missed or malfunctions. Furthermore, the predicted damage location can be used as input with high accuracy to the progressive flooding simulator, with on-board real-time calculations.
In future research, we plan to develop a model that can improve the accuracy of the prediction of the damage location even when an imbalance in data exists. In addition, we plan to continue developing a decision support system to respond to ship accidents.