Computational Investigation of Seakeeping Performance of a Surfaced Submarine in Regular Waves
Article information

Abstract
A submarine is optimized to operate below the water surface because it spends most of its time in a submerged condition. However, the performance in free surface conditions is also important because it is unavoidable for port departure and arrival. Generally, potential flow theory is used for seakeeping analysis of a surface ship and is known for excellent numerical accuracy. In the case of a submarine, the accuracy of potential theory is high underwater but is low in free surface conditions because of the nonlinearity near the free surface area. In this study, the seakeeping performance of a Canadian Victoria Class submarine in regular waves was investigated to improve the numerical accuracy in free surface conditions by using computational fluid dynamics (CFD). The results were compared to those of model tests. In addition, the potential theory software Hydrostar developed by Bureau Veritas was also used for seakeeping performance to compare with CFD results. From the calculation results, it was found that the seakeeping analysis by using CFD gives good results compared with those of potential theory. In conclusion, seakeeping analysis based on CFD can be a good solution for estimating the seakeeping performance of submarines in free surface conditions.
1. Introduction
Over the last 100 years, since the development of the diesel-powered submarine by the French Navy in 1863, submarine design has changed remarkably. The hull form of early submarines was similar to those of surface ships, but a rounded hull form was used to reduce water resistance and increase speed for tactical planning (Krishna and Krishnankutty, 2016). Submarines spend most of their time below the water surface, so the design was optimized for submerged conditions. However, the performance in free surface conditions is also important because submarines face various scenarios. Military submarines avoid going out on the water to minimize exposure to enemies, but free surface conditions are unavoidable for port departure and arrival, and it is necessary to study the seakeeping performance in extreme environments (Burcher and Rydill, 1995). In addition, submarines have very poor rolling in free surface conditions because they have a rounded shape with very few appendages. For these reasons, research on the seakeeping performance of submarines in free surface conditions is steadily continuing, but only a few papers have been published for security reasons.
Hedberg (2006) created a method to simulate the roll motion of a submarine in a linear way in the frequency domain and in a nonlinear way in the time domain for a surfaced submarine. The two methods are used to study how difference sea states, adding appendages, and varying the transverse metacenter height affects the roll angle of submarine while surfaced. Thornhill and Hermanski (2008) performed a computational fluid dynamics (CFD) simulation and physical experiments based on a 2D surfaced submarine section for estimating the effects on roll motion of a closed versus free-flooding casing and found that the opening size had a significant impact on roll damping. Vogels (2016) investigated the roll damping of surfaced submarines based on the mathematical model and experiments using several combinations of rudder configuration, forward speed, roll amplitude, and roll frequency. Cansiz and Yildiz (2021) created a mathematical model of roll decay motion for a submarine in surface conditions, and the roll damping term was obtained numerically by carrying out roll decay simulations using CFD code.
Generally, potential flow theory is used for seakeeping analysis of a surface ship and is known for excellent numerical accuracy. Potential flow theory was invented by Gerritsma and Beukelman (1970) based on the assumption of a slender ship. Bingham (1994) overcame the assumption of a slender ship and used 3D codes based on free surface conditions and a wave source. Kring (1994) applied a Rankine source to consider both the hull and free surface for seakeeping analysis, but there was a limitation in not sufficiently considering the viscous effects. In the case of a submarine, the accuracy of potential flow theory is high underwater but is low in free surface conditions because of the nonlinearity near the free surface area, low damping, etc. Therefore, seakeeping analysis for surface conditions is extremely challenging, and most shipyards seem to rely on a wave basin test.
In general, a submarine has limited access to public documents due to issues such as military secrets and security maintenance, and it is extremely difficult to obtain related material. In this study, a Canadian Victoria Class submarine was chosen as a target vessel, and the experimental results have been published in the 2010 11th International Symposium on Practical Design of Ships and Other Floating Structures (PRADS) (Hermanski and Kim, 2010). The main goal of this study is to improve the numerical accuracy in free surface conditions using CFD. Compared to physical experiments, CFD is financially efficient, and the intensity of physical labor is low. However, there has been a drawback in that it is difficult for computer hardware to perform large-capacity calculation. But recently, with the development of computer hardware technology, the value of CFD has been increasing. In this study, Star-CCM+ was used as a Reynolds-averaged Naver Stokes (RANS) solver to estimate the seakeeping performance of a submarine, and the results were compared to those of model tests from a published paper (Hermanski and Kim, 2010). In addition, the potential theory software Hydrostar developed by Bureau Veritas was also used for seakeeping performance to compare with the CFD results.
2. Target Vessel
In the present study, the Canadian Victoria Class submarine was chosen as a target vessel, which is illustrated in Fig. 1. The experimental results of the Canadian Victoria Class submarine have been published in the 2010 PRADS 11th triennial (Hermanski and Kim, 2010), which is one of the reasons why the Canadian Victoria Class submarine was chosen. A 3D model was created from the body plan in the published paper and was repaired using Star-CCM+. The bare hull for numerical calculation is 1:14.96 scale, and the main dimensions are defined in Table 1.
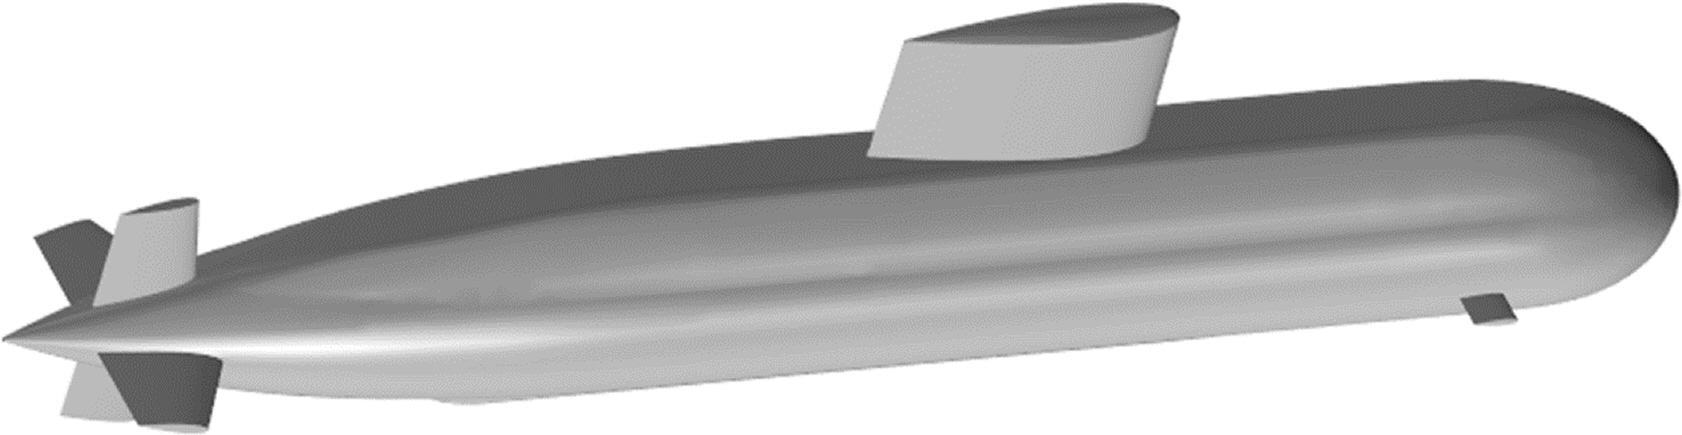
3D model of the Canadian Victoria Class Submarine

Principal dimensions of the Canadian Victoria Class Submarine
3. Seakeeping Analysis
3.1 Potential Flow Theory
In the present study, CFD code and potential flow theory were used for seakeeping analysis of the submarine, and the results were compared to those of the model tests for verification. The seakeeping analysis based on potential flow theory was performed with Hydrostar for Experts V8.10, which has been developed by Bureau Veritas since 1991. Hydrostar is powerful 3D diffraction/radiation potential software that provides a complete solution to a first-order problem of wave diffraction and radiation and also second-order low-frequency wave loads for a floating body with or without forward speed in deep water and in finite water depth (BV, 2019). For 3D diffraction/radiation potential theory, the hull was modeled as panels according the hull geometry. The number of panels is governed by the panel size, and the maximal panel length should be smaller than 1/6 of the minimum wave length considered for analysis. The panel model used in Hydrostar is shown in Fig. 2.
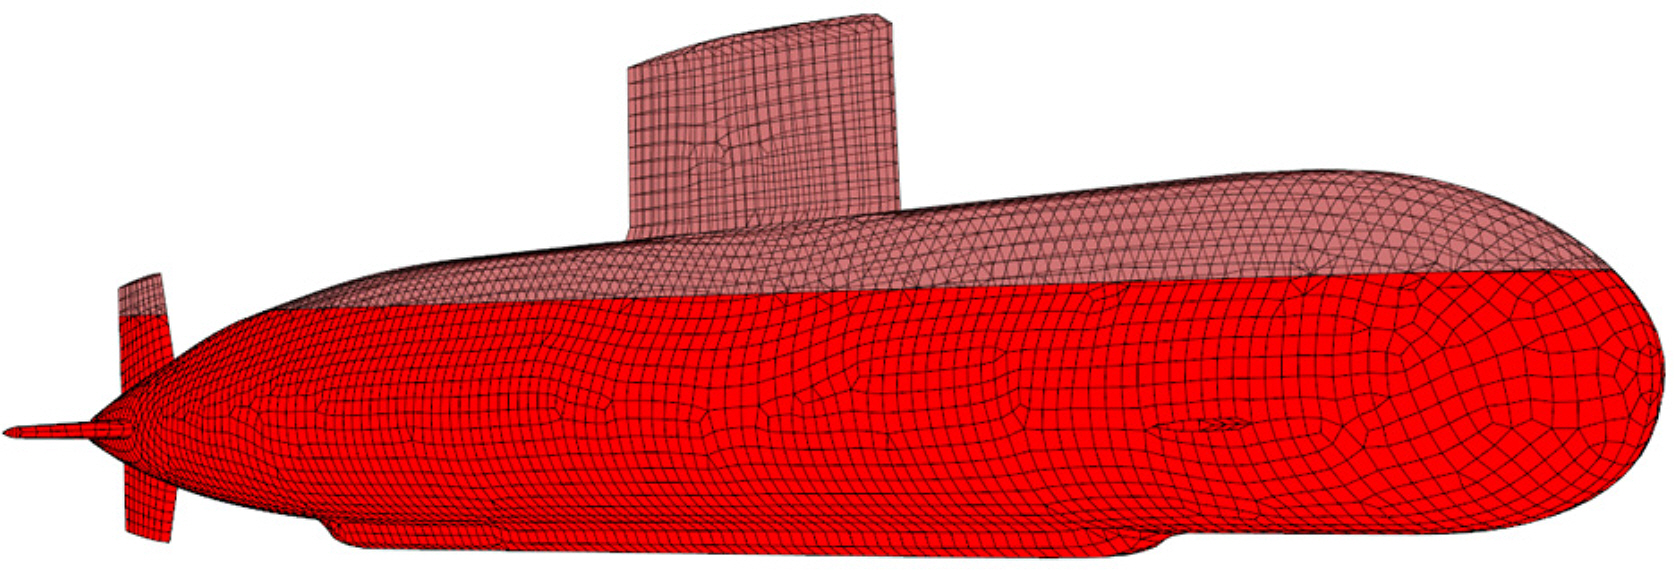
Panel mesh for potential code
The seakeeping analysis was performed at all wave headings from head (180º) to following (0º) seas (12 headings with 30º spacing), and a forward speed of 3 knots (1.54 m/s) was used. Wave frequencies of 0.27 rad/s to 1.32 rad/s were used with steps in wave frequencies not exceeding 0.04 rad/s. Since the viscosity effect on the roll response is important to arrive at a realistic roll angle, appropriate roll viscous damping should be included. In this study, 5% viscous roll damping was taken from a roll decay test in a published paper (Hermanski and Kim, 2010).
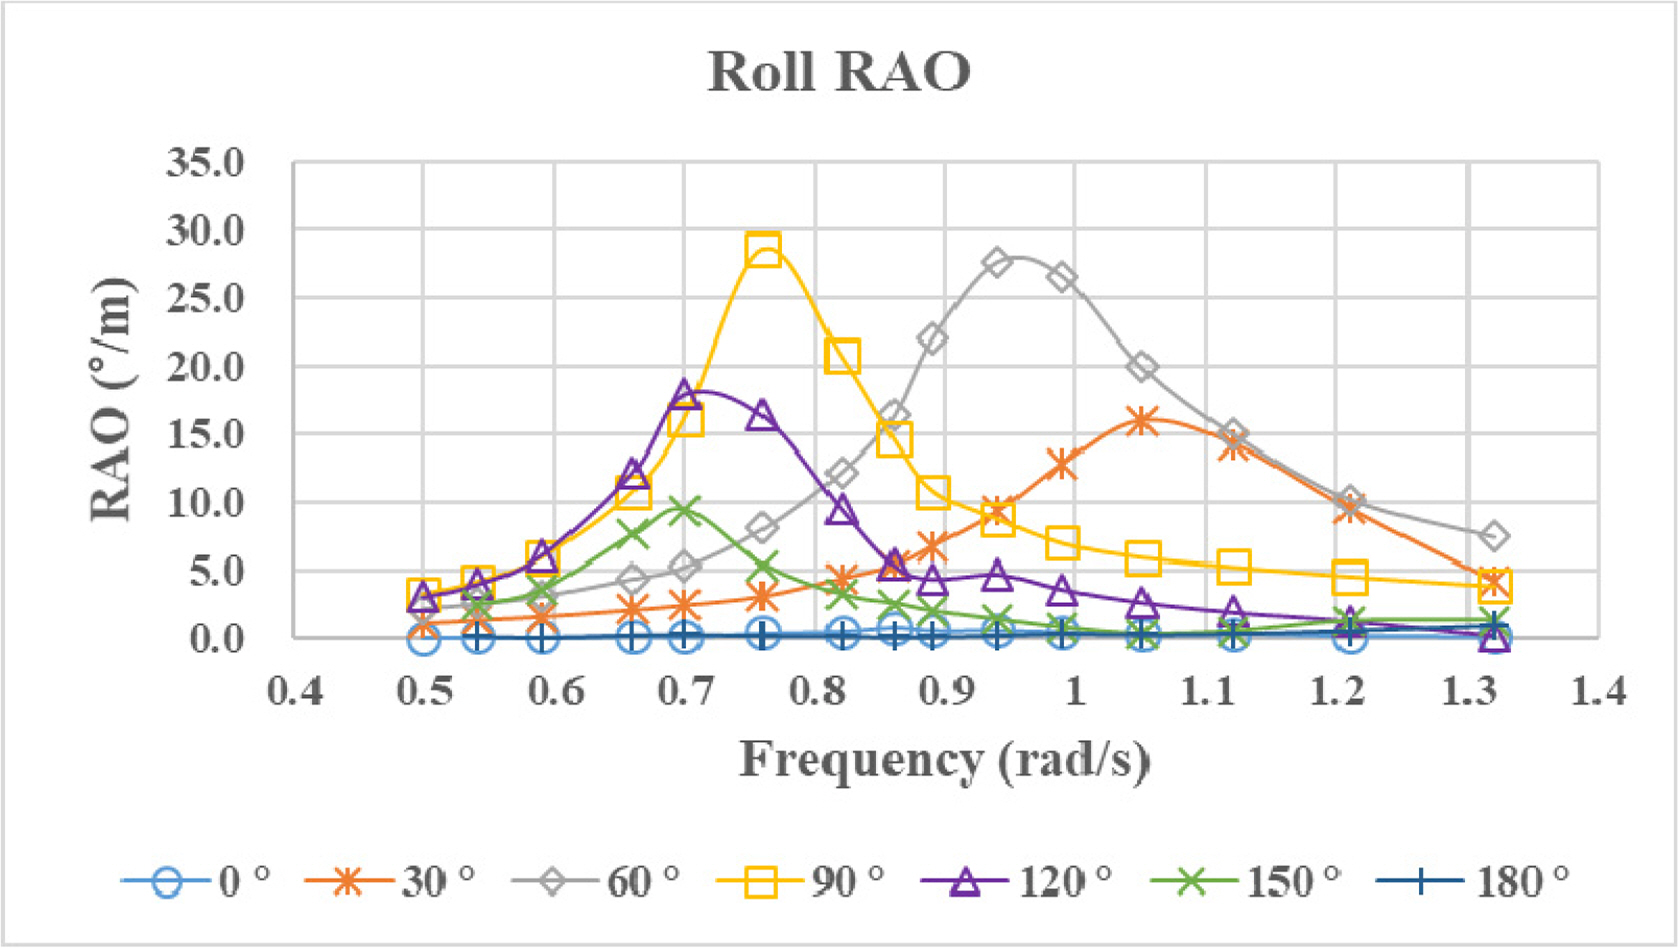
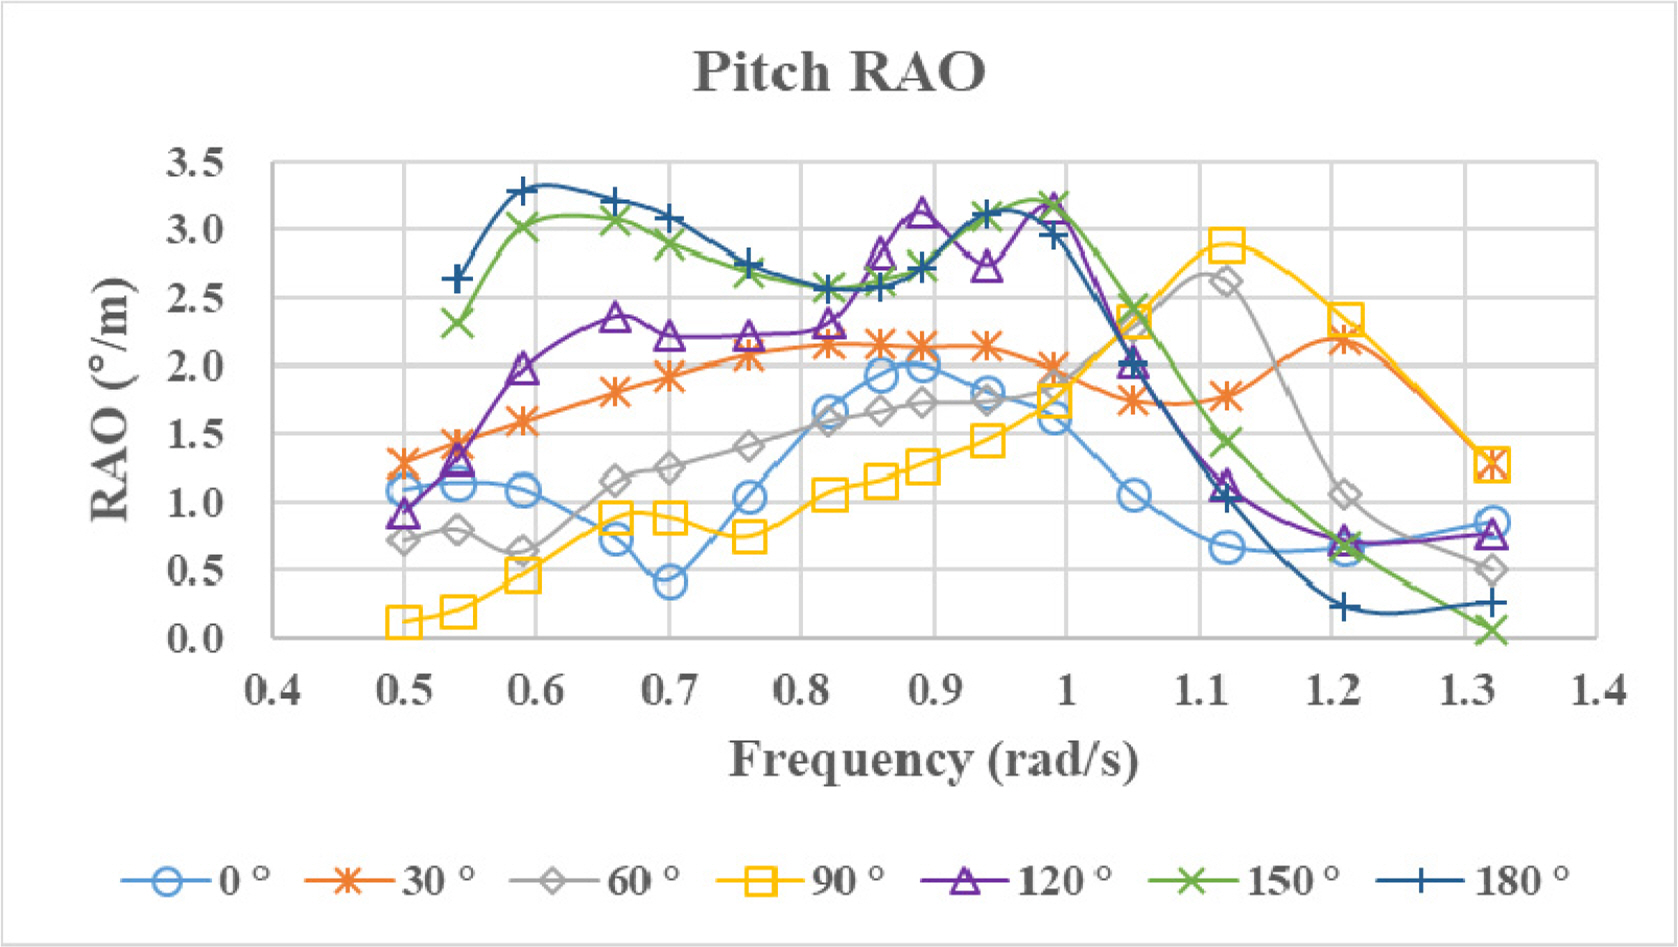
After the modeling and mesh generation were completed, the response amplitude operators (RAOs) with six degrees of freedom were calculated, and the results of heave, roll, and pitch are shown in Figs. 3–5. From the results, unlike the heave and pitch RAOs of typical surface ship, those of a surfaced submarine take double peaks into account. Roll RAOs of quartering waves (30º, 60º and 120º) are higher than that of beam sea (90º). These results seem to be due to the nonlinearity near the free surface area, as will be shown later.
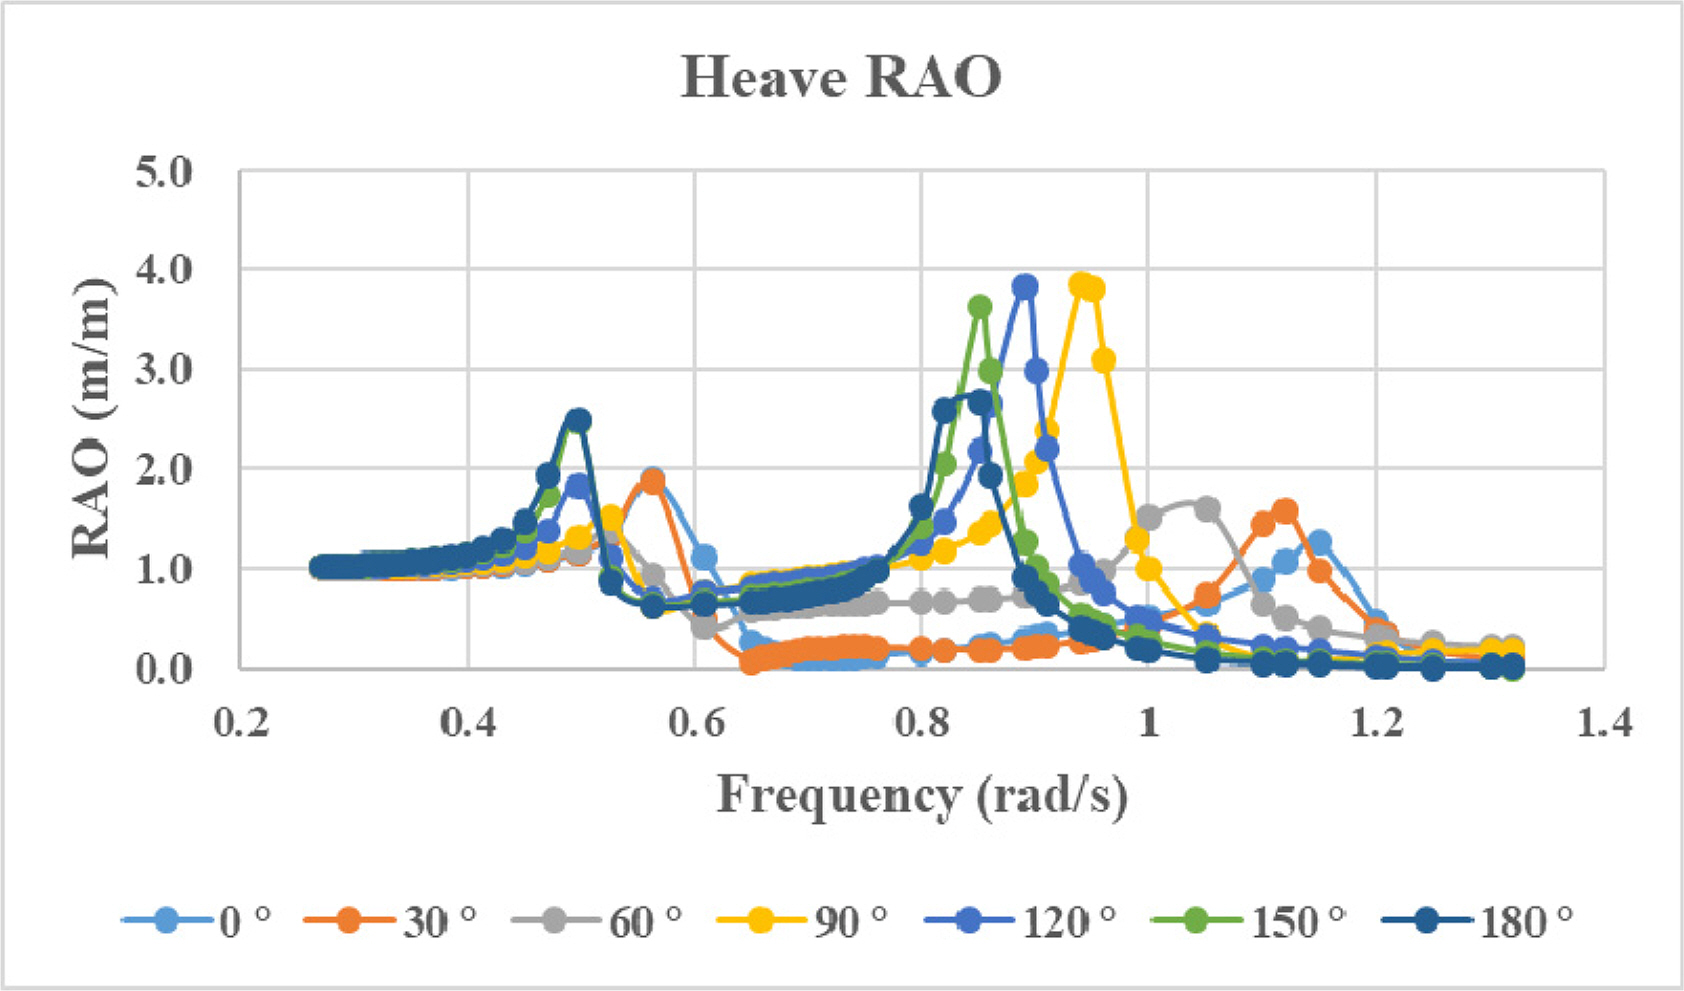
Heave RAOs from potential code

Roll RAOs from potential code
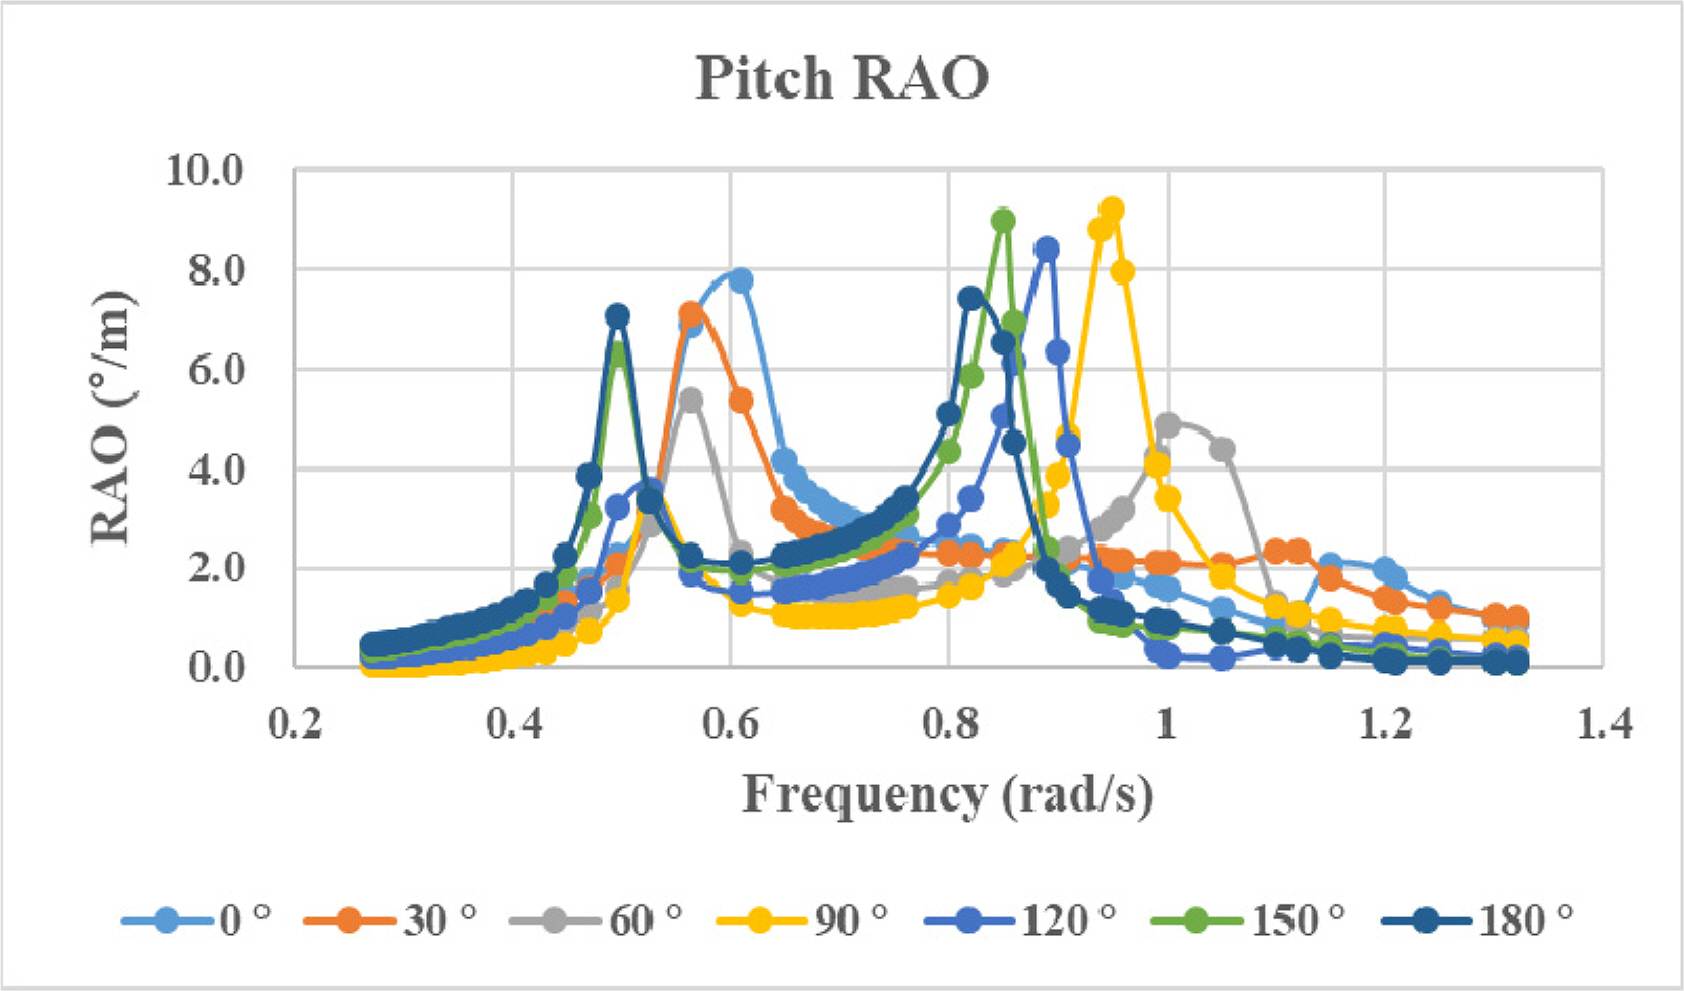
Pitch RAOs from potential code
3.2 Computational Fluid Dynamics
The seakeeping analysis based on the regular wave simulation was performed with the commercial CFD software STAR-CCM+ V15.06. Fig. 6 shows the computational domain that was used in this study. The computational domain consists of two regions (a tank region and overset region) and was generated with size corresponding to 0.7 times the ship length (L) from the forward direction of the ship to 3.3 times L from the backward direction, 3.0 times Lpp in the horizontal direction, and 2.5 times Lpp in the vertical direction. The dynamic fluid body interaction method with overset grid and two sets of spring damper system were used to simulate the 6 degrees of freedom of motion.
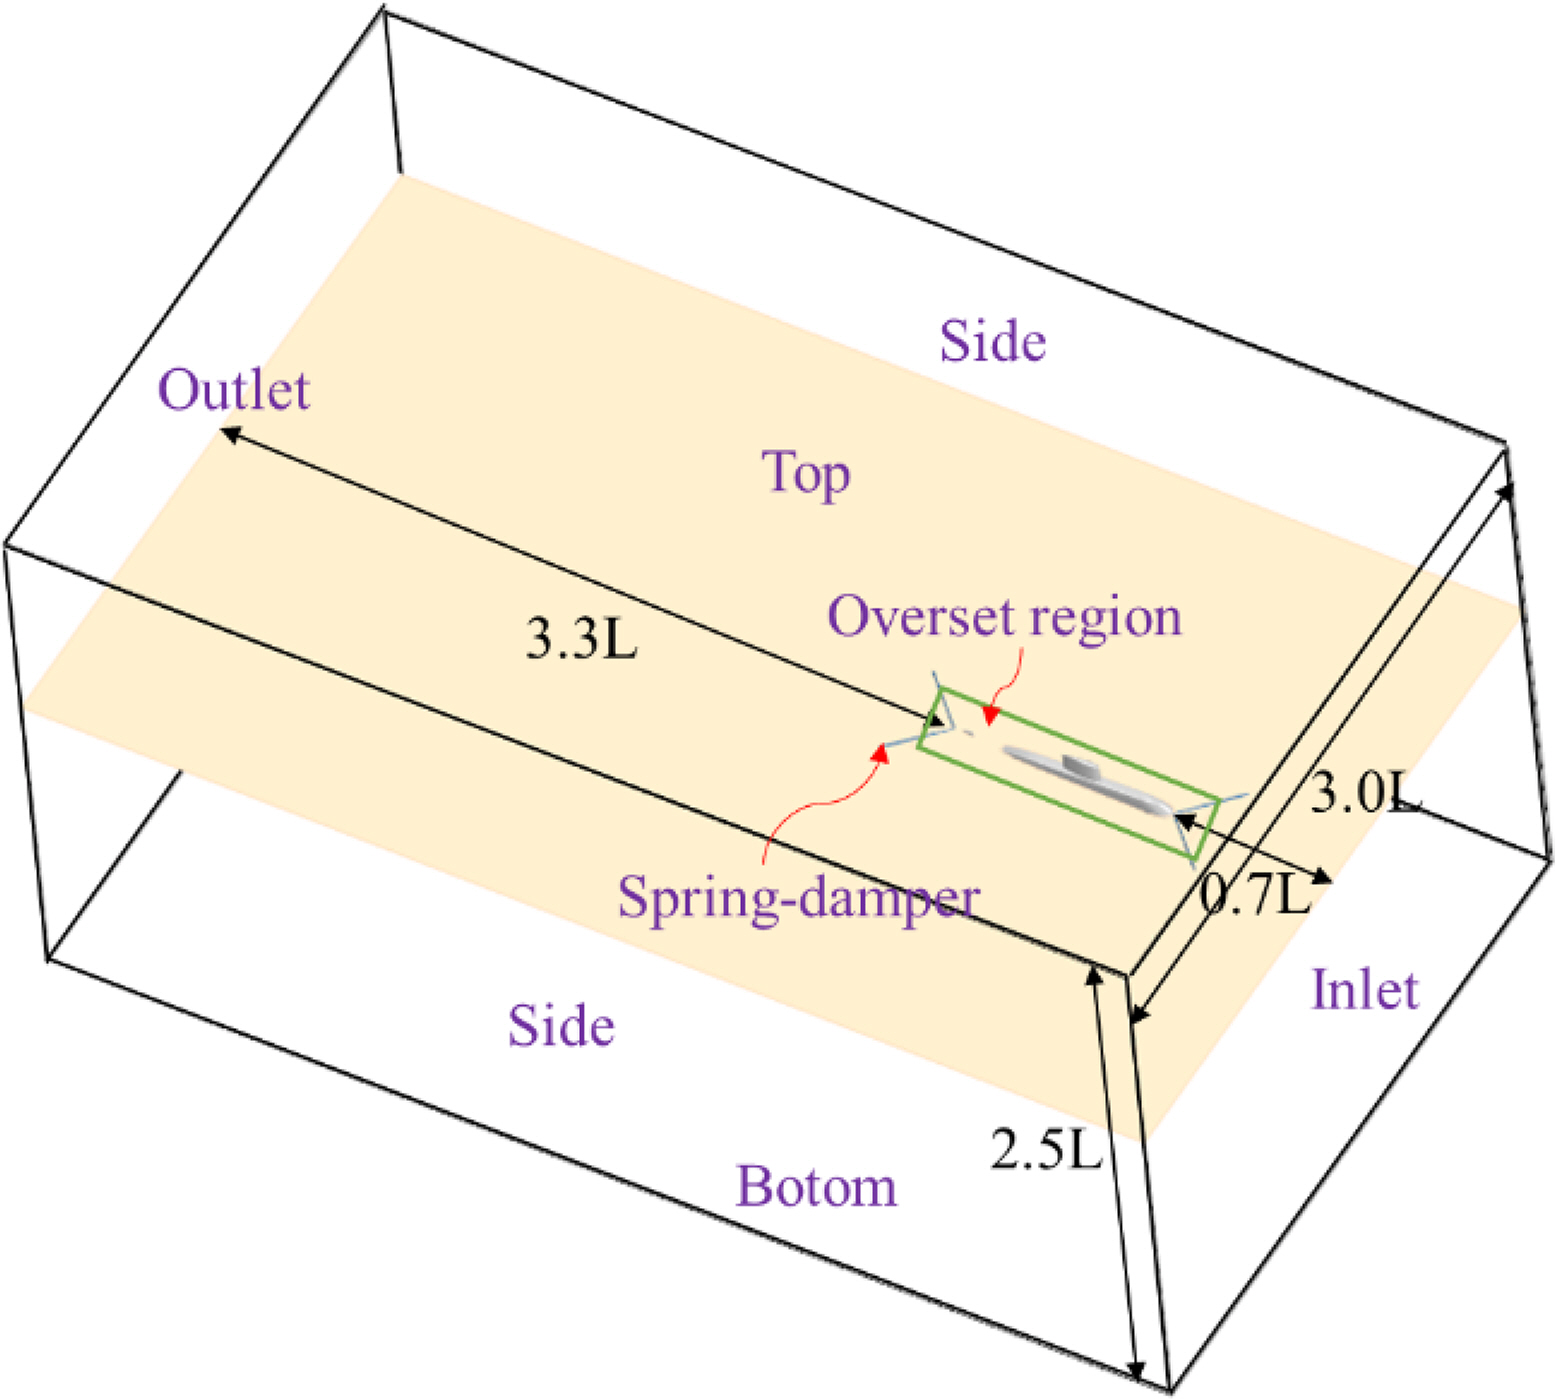
Computational domain for regular wave simulation
For body-environment coupling, a pair of linear springs was attached to the bow and stern, and an elasticity coefficient of 100 N/m was used to minimize the effect on the ship’s motions. The boundary conditions for the inlet, outlet, top, bottom and side (port and starboard) were assigned as velocity inlets, and the velocity was defined as the same flow as the submarine’s target speed. For considering the free surface, the volume of fluid (VOF) method was used, and a VOF wave forcing zone was applied to the inlet (forcing zone size: 0.3L), outlet (forcing zone size: 1.5L), and side (forcing zone size: 0.25L) to eliminate disturbed flows.
The simulation conditions for regular wave cases are described in Table 2. The regular wave simulations were performed with seven wave headings and forward speeds of 3 knots (1.54 m/s). The wavelength (λ) was between 0.5 and 3.5 times the ship length, and the wave steepness (H/λ) was fixed with a value of 1/50. The turbulence was modeled with the realizable k-ε turbulence model for numerical stability and is generally used for the marine industry. In order to reduce the wave dissipation, a second-order scheme in time was applied, and a 5th-order Stokes wave was used in the simulation. The time step was selected to be able to perform 500 calculations per period based on the encounter period, and the calculation was performed so that the encounter period was repeated 10 time or more.

Simulation conditions for regular waves
The mesh was made with a trimmed mesh in STAR-CCM+. Four prism layers were used to accurately measure the boundary layer flow on the hull surface, and the first layer thickness (Y+) was 10–40. The configuration of the mesh used in a regular wave simulation is shown in Fig. 7 and Fig. 8.

Mesh distribution for head sea (180º) simulation

Mesh distribution for quartering and following sea simulation
A grid convergence test was performed to find the optimal grid resolution for three grids based on Richardson extrapolation (ITTC Resistance Committee, 2017). For this purpose, it was performed on course, medium, and fine grids for heave, pitch, and roll RAOs. The three grids are determined by increasing the size of the grid with the refinement ratio (ri ). Based on the simulation time, a refinement ratio (ri ) of

Information of different types of grids for convergence test
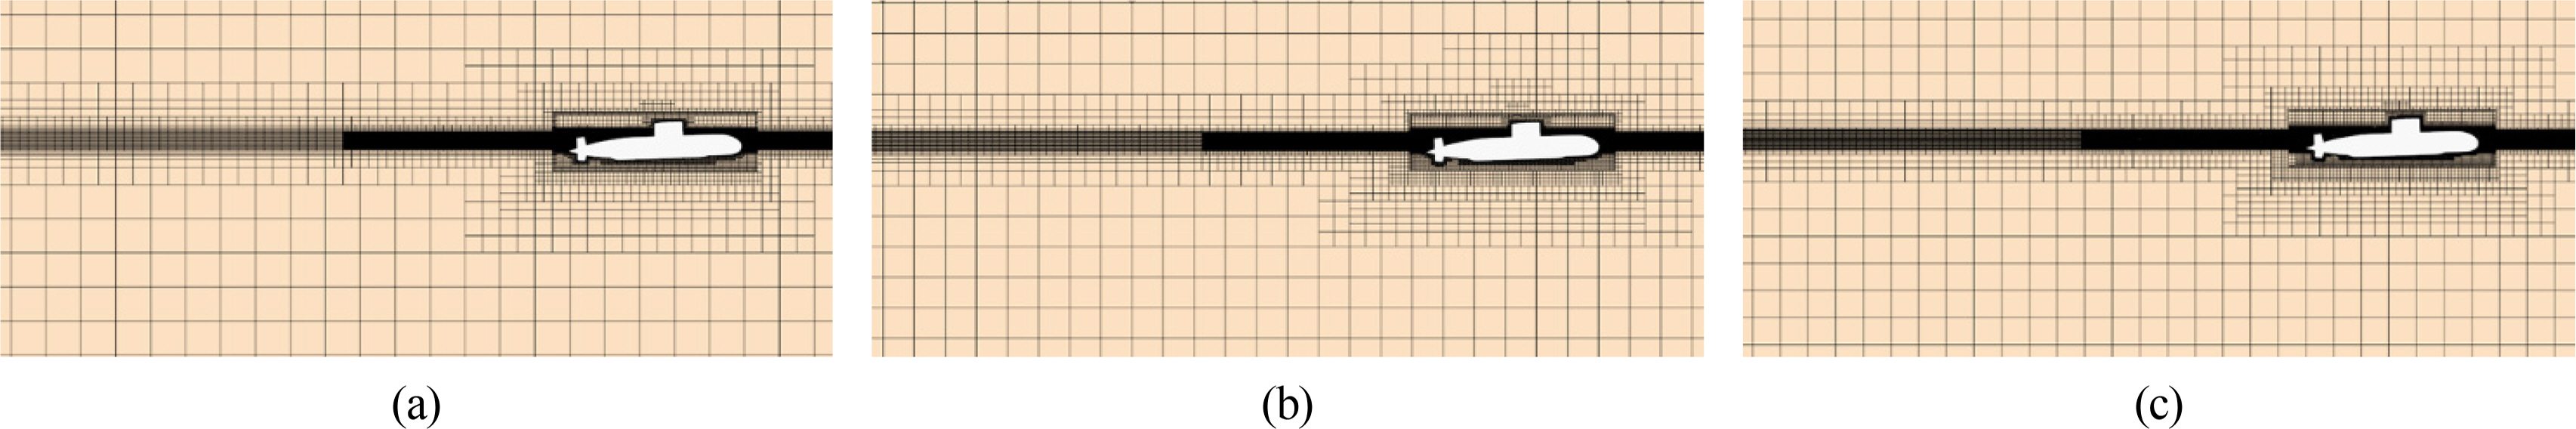
Different grids on side view: (a) Coarse grid; (b) Medium grid; (c) Fine grid
The heave, pitch, and roll RAOs are selected for grid convergence test: ship on regular waves, head sea (μ = 180º) and beam sea (μ = 90º). The both cases ship speed was 3 knots (1.54 m/s) and the results of grid convergence study are summarized in Table 4. The convergence ratio is defined by Eq. (1).
S1 = Coarse grid (2.8M)
S2 = Medium grid (3.6M)
S3 = Fine grid (4.9M)
∊21 = S2 - S1: The difference of coarse and medium grids
∊32 = S3 - S2: The difference of medium and fine grids
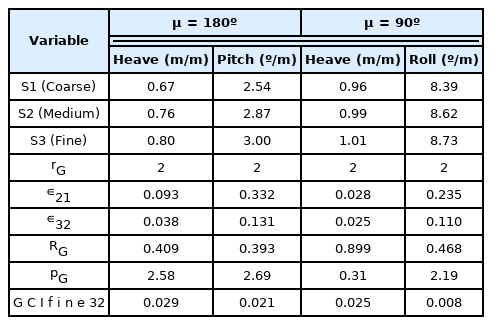
Grid convergence test results
Convergence conditions are defined according to the convergence rate calculated by Richardson extrapolation as follows:
Ri > 1: Grid divergence
Ri < 0: Oscillatory convergence
0 < Ri < 1: Monotonic convergence
As shown in Table 4, RG for heave, pitch, and roll shows that monotonic convergence is achieved for all simulation variables because they are between 0 and 1. It is shown that the tendency of calculated results converge as the size of the grid is reduced. The order of accuracy pG is defined by Eq. (2).
Based on Celik et al. (2008), the Grid Convergence Index (GCI) is defined using the following equations:
As shown in Table 4, the maximum GCI is 0.029 in heave motion and head sea, and the minimum GCI is 0.008 in roll motion and beam sea, all of which are within an acceptable range. In this study, grids of 4.9 million cells were used based on the grid convergence test, and 100 grids per wavelength and 16 grids per wave height were selected. From the CFD simulation, heave, roll, and pitch responses were obtained based on the earth-fixed coordinate system. Fig. 10 shows the time histories of the roll and pitch response. The motion RAOs were calculated from average of responses after the transient range, as shown in Fig. 10.

Time series of roll and pitch response in beam sea (λ/L = 1.0, rectangle box: available time history range): (a) Roll response; (b) Pitch response
Figs. 11–13 show the motion RAOs obtained from the CFD simulation. The motion RAOs were normalized with the wave amplitude. Unlike the results of potential code, the maximum roll response was found in beam sea. The natural roll period was 8.3 seconds, which is a slightly smaller value compared with the target value (8.76 s). In the motion RAOs, the maximum values of heave and pitch were found in beam sea and head sea, respectively. As with the potential code, the heave and pitch RAOs from CFD simulation showed double peaks, which will be discussed later with the comparison results.

Heave RAOs obtained from CFD simulation
Roll RAOs obtained from CFD simulation
Pitch RAOs obtained from CFD simulation
4. Comparison Results and Discussion
4.1 Motion RAOs
The simulation results (potential code and CFD) for motion RAOs were compared and validated with the model test results. As mentioned earlier, the model test results were obtained from a published paper (Hermanski and Kim, 2010). The comparison results with experimental data are shown in Fig. 14. Unfortunately, experimental data were available for only beam sea conditions. From the results, the roll RAOs of CFD show good agreement with experimental results at wave frequency > 0.76 rad/s. For low wave frequency (frequency < 0.76 rad/s), the roll RAOs of CFD show a smaller value than the experimental results. This result seems to be due to a small difference of roll natural period between the CFD results and experimental results.
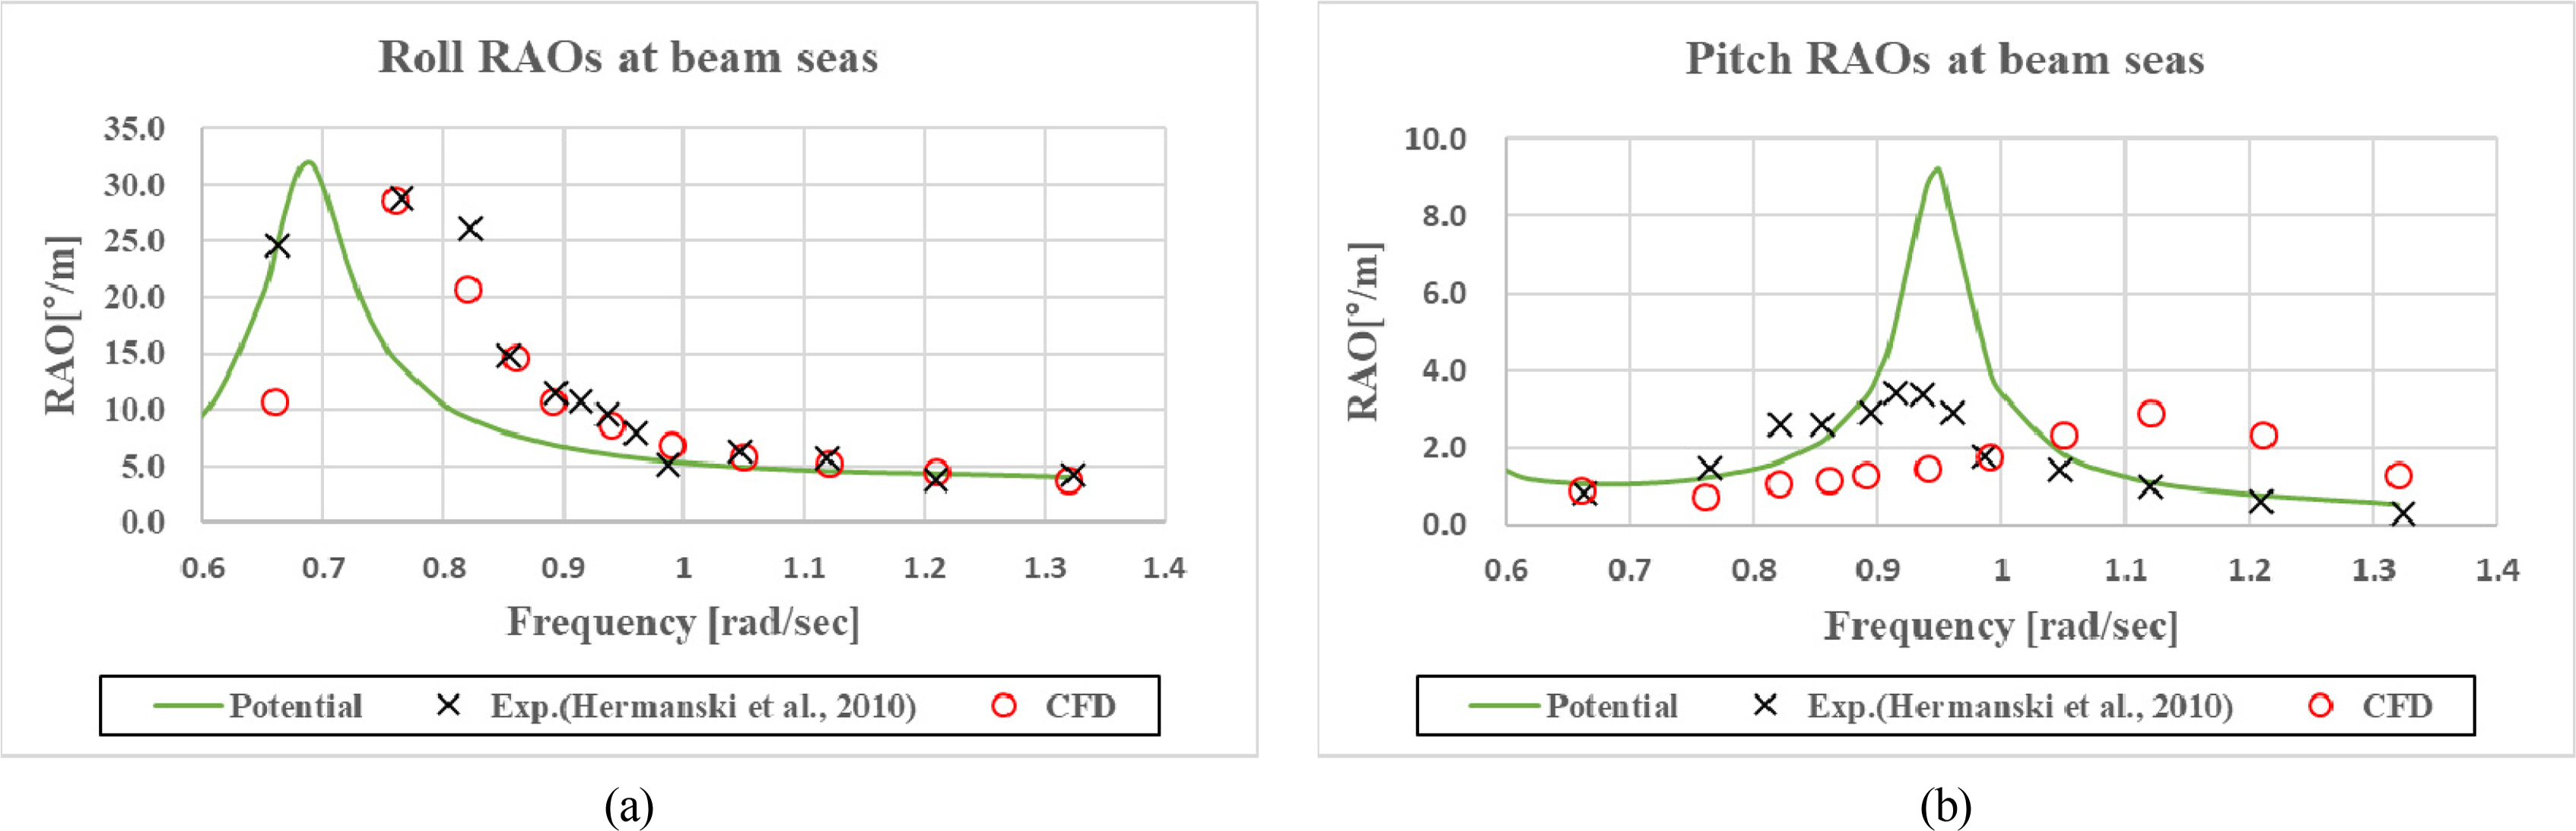
Comparison of roll and pitch RAOs (μ = 90º): (a) Roll RAO; (b) Pitch RAO
On the other hand, roll RAOs obtained from potential code show a big deviation from experimental results. The pitch motion is not dominant in beam sea, but when compared within available experimental data, the results of the potential code showed a big difference compared to the experimental results in the resonance frequency range. These differences might be due to nonlinear effects, which quickly become important due to the particular body geometry close to waterline. As shown in the CFD results (Fig. 15), the wetted surface area on the free surface changes dramatically, especially in the stern area, but the potential code does not take this into account.

Wave contours on free surface from CFD simulation (μ = 90º): (a) t = 42 s ; (b) t = 45 s
4.2 Motion Response
Quantitative comparison of estimated motion responses was performed. The motion responses in irregular waves can be obtained by spectral analysis employing the motion RAOs and generated wave spectrum. In this study, a Joint North Sea Wave Project spectrum for fetch-limited seas was used, and the parameters are summarized in Table 5.

Simulation conditions for irregular waves
The estimated motion responses are shown in Figs. 16–18. The roll motion responses are compared in Fig. 16. As can be seen from Fig. 16, roll motions from the CFD code showed similar trends to the experimental results, while the roll motions from the potential code showed significantly larger values than the experimental results, and the tendency is different. These differences might be due to nonlinear effects, which quickly become important due to the particular body geometry close to the waterline.
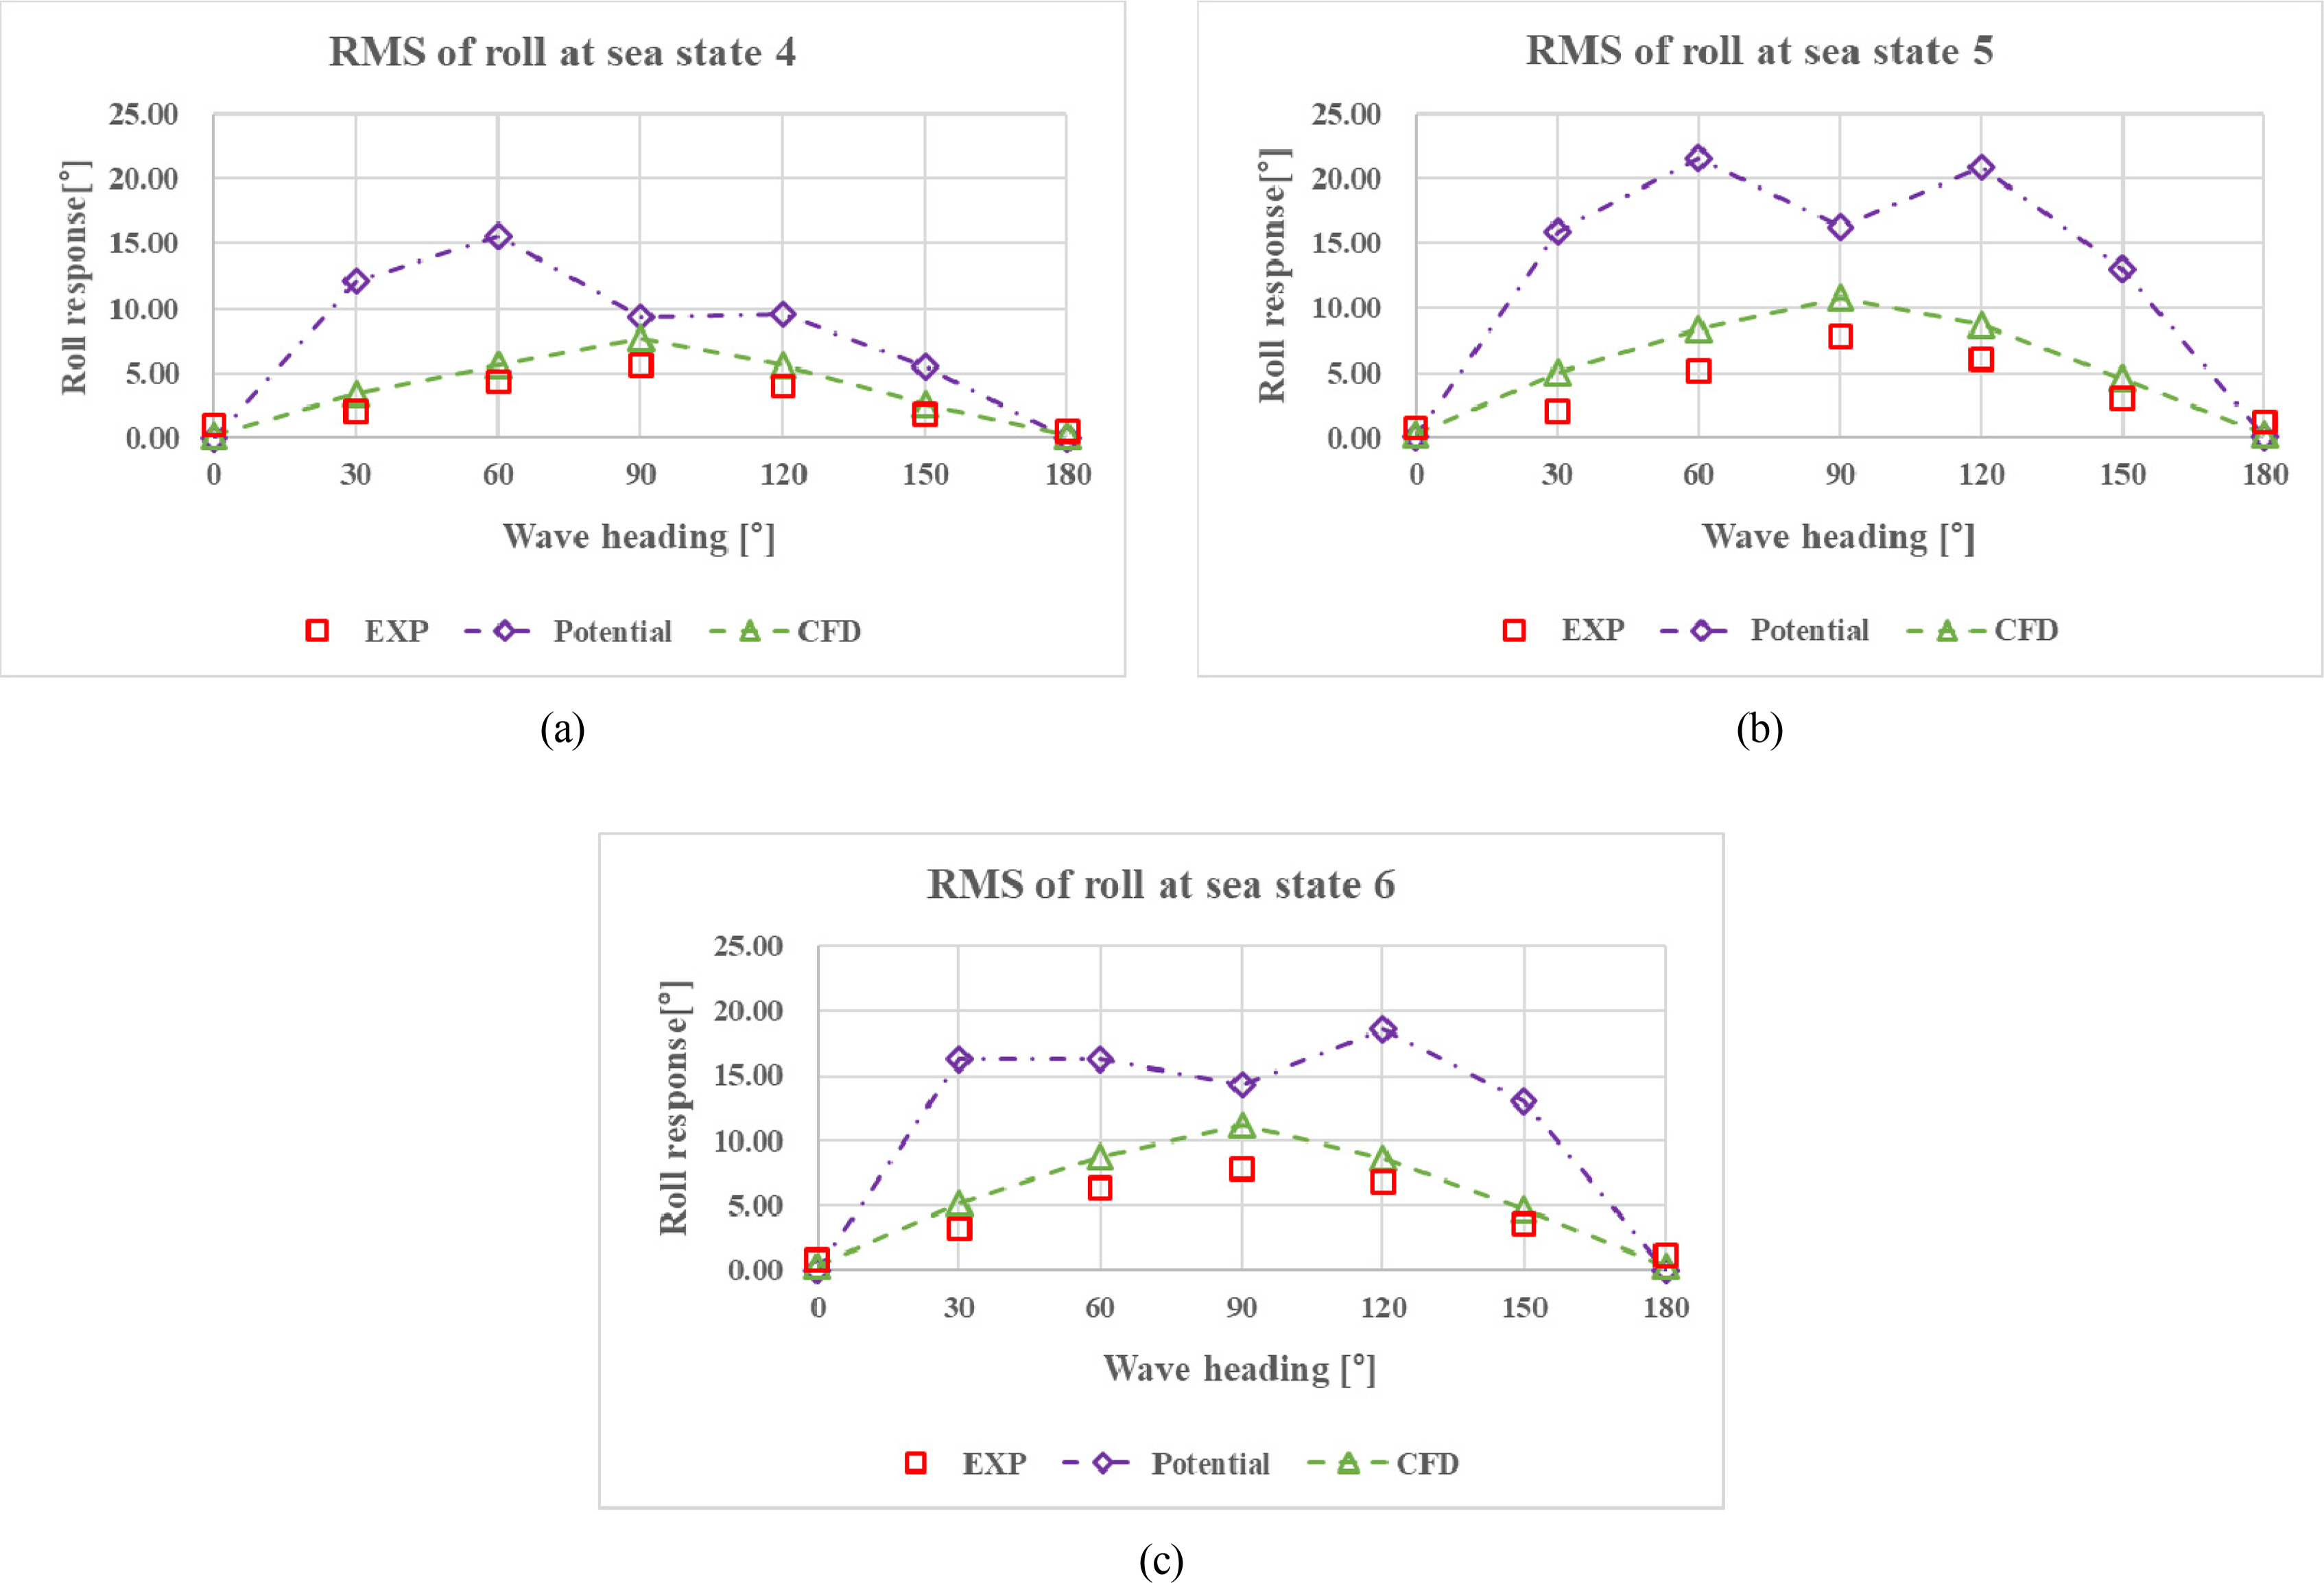
Comparison of roll motion responses: (a) Roll motions at SS4; (b) Roll motions at SS5; (c) Roll motions at SS6

Comparison of pitch motion responses: (a) Roll motions at SS4; (b) Roll motions at SS5; (c) Roll motions at SS6
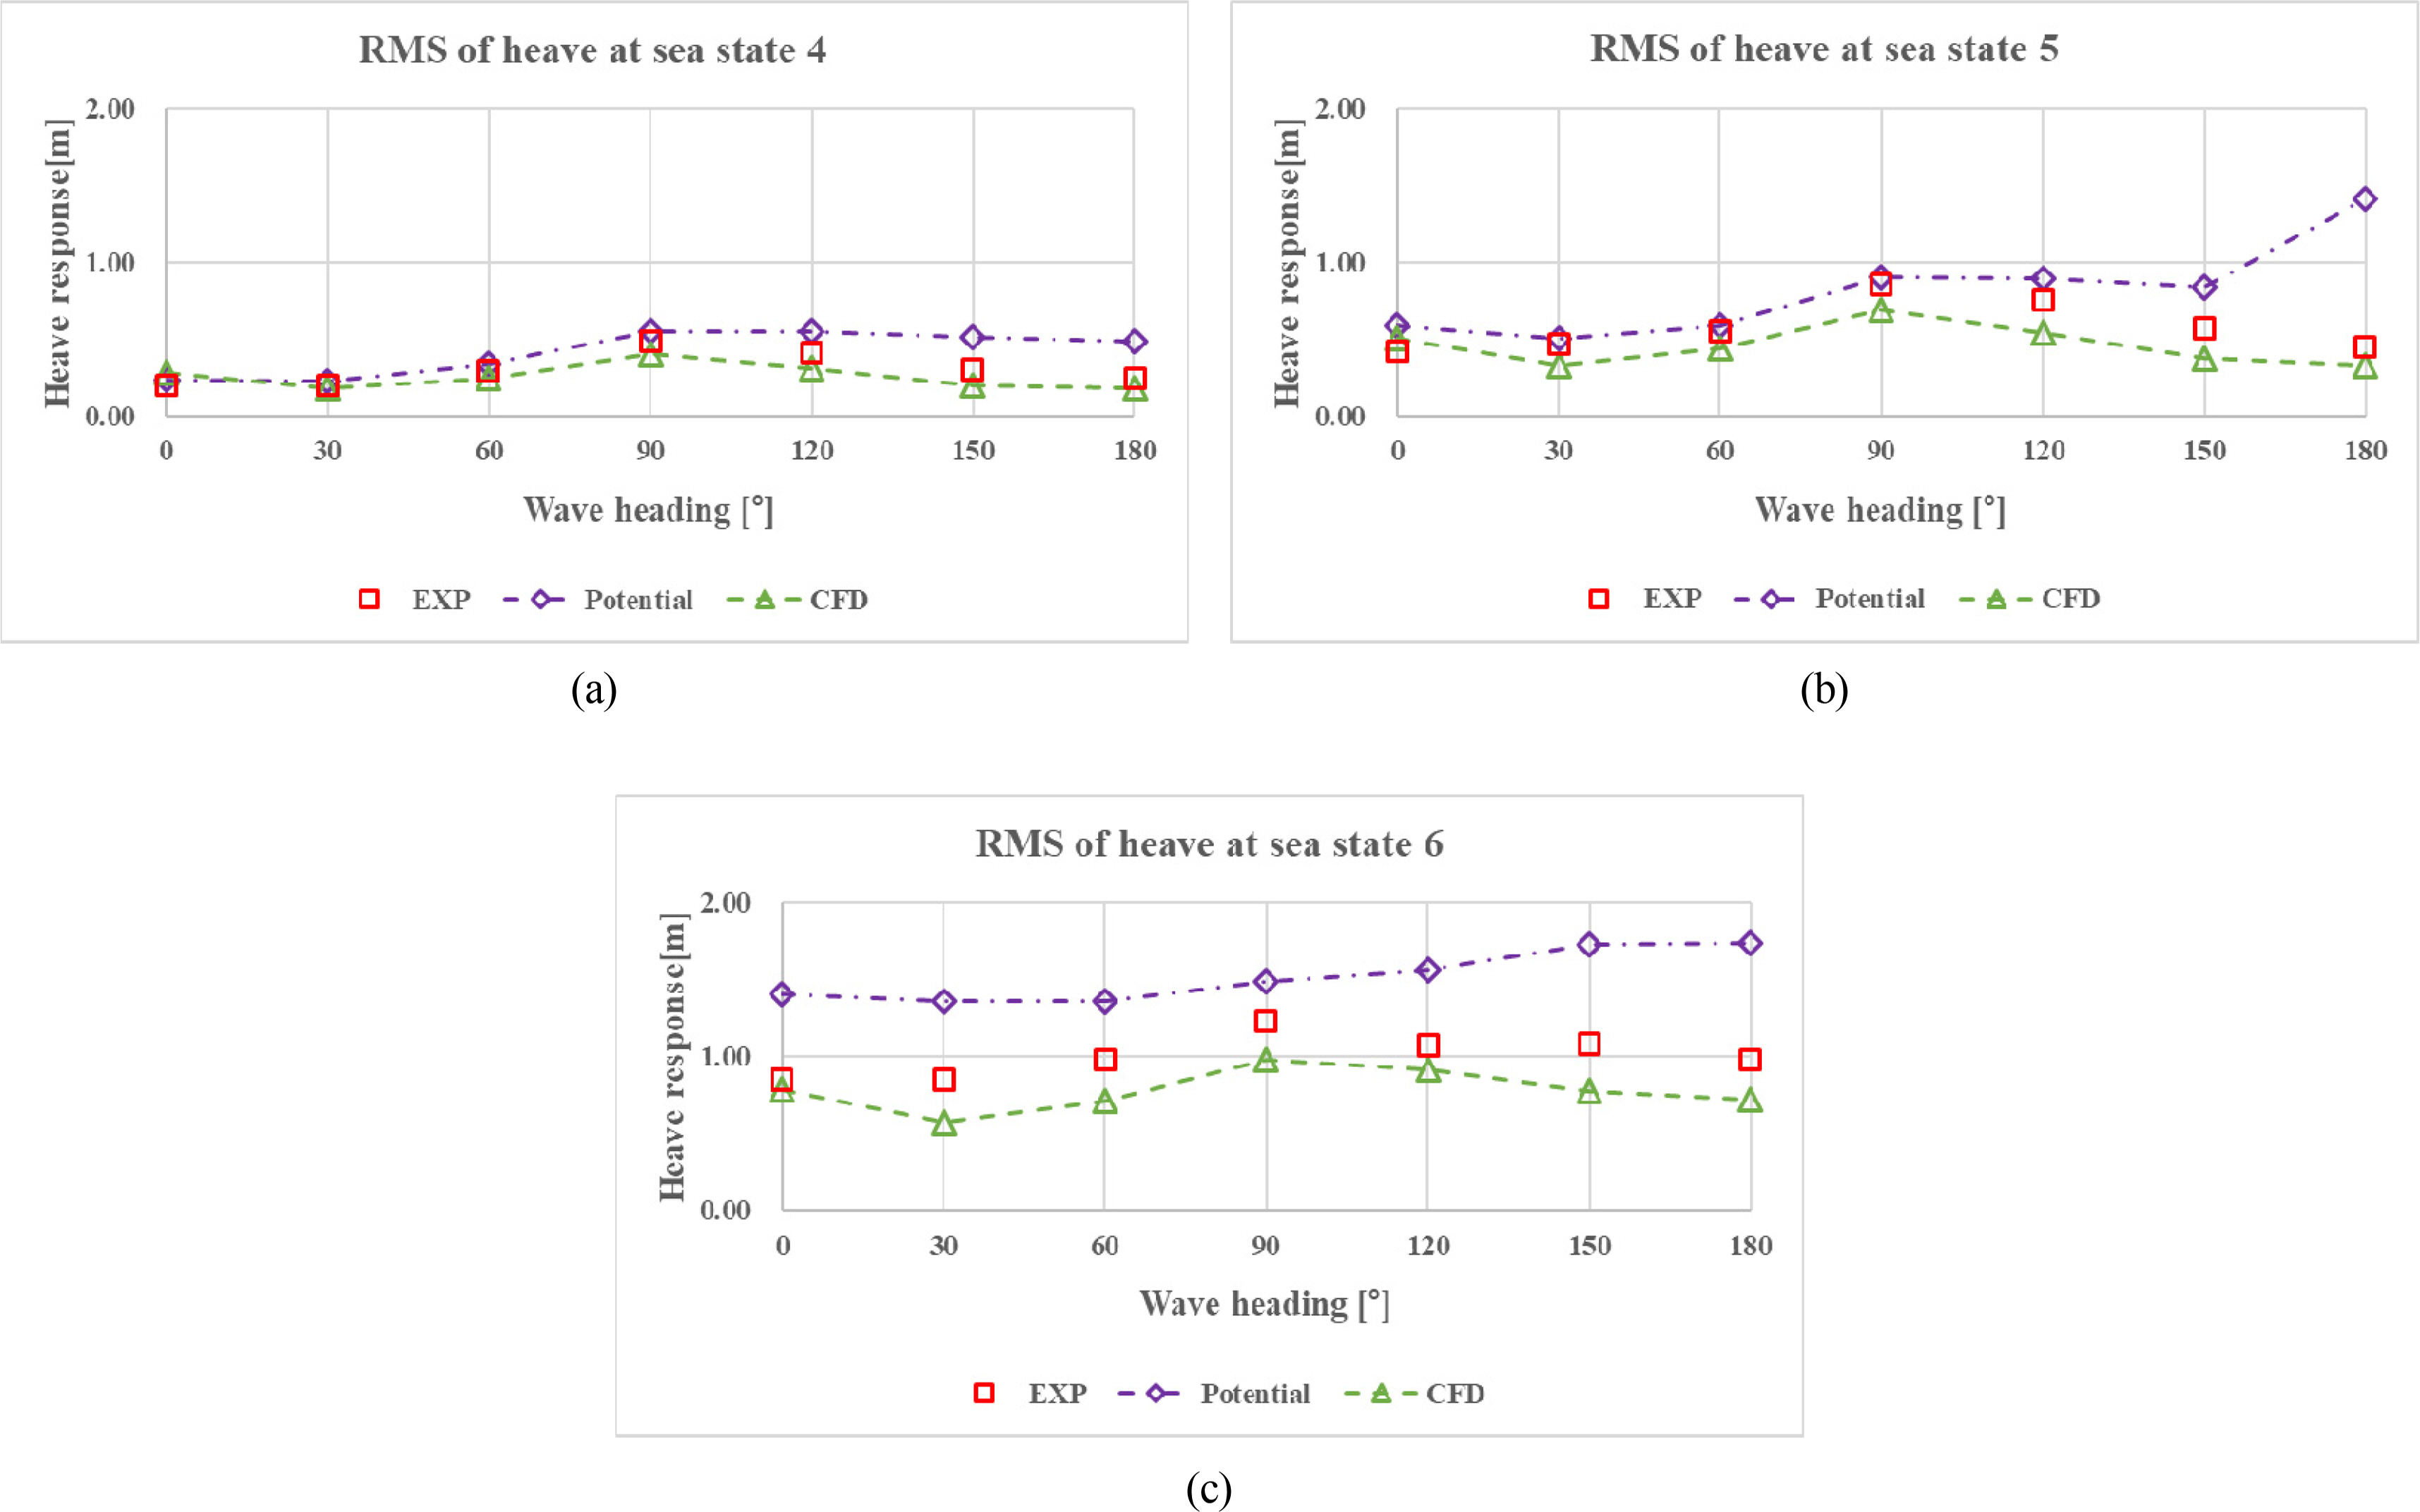
Comparison of heave motion responses: (a) Heave motions at SS4; (b) Heave motions at SS5; (c) Heave motions at SS6
The pitch motion responses are compared in Fig. 17. The pitch motion response from CFD code showed good agreement with experimental results except for the wave heading of 30º. On the other hand, pitch motion responses obtained from the potential code were significantly bigger than the experimental results for sea states 5 and 6.
Finally, the heave motion responses are compared in Fig. 18. From Fig. 18, it was found that heave motions from potential code were overestimated, and those from CFD code were underestimated compared with the experimental results. Although heave motion from CFD code was underestimated from the experimental results, the difference was small, and the heave motions showed a similar tendency to the experimental results.
From these comparison results, it was found that the seakeeping analysis using CFD code gives good results compared with those of potential code. Therefore, the seakeeping analysis based on the CFD code can be a good solution for estimating the seakeeping performance of submarines in free surface conditions. In addition, as the sea state increased, the overall difference between motion responses from CFD code and experimental results slightly increased. These differences might be due to nonlinear effects from stern area flooded by waves, as shown in Fig. 19.
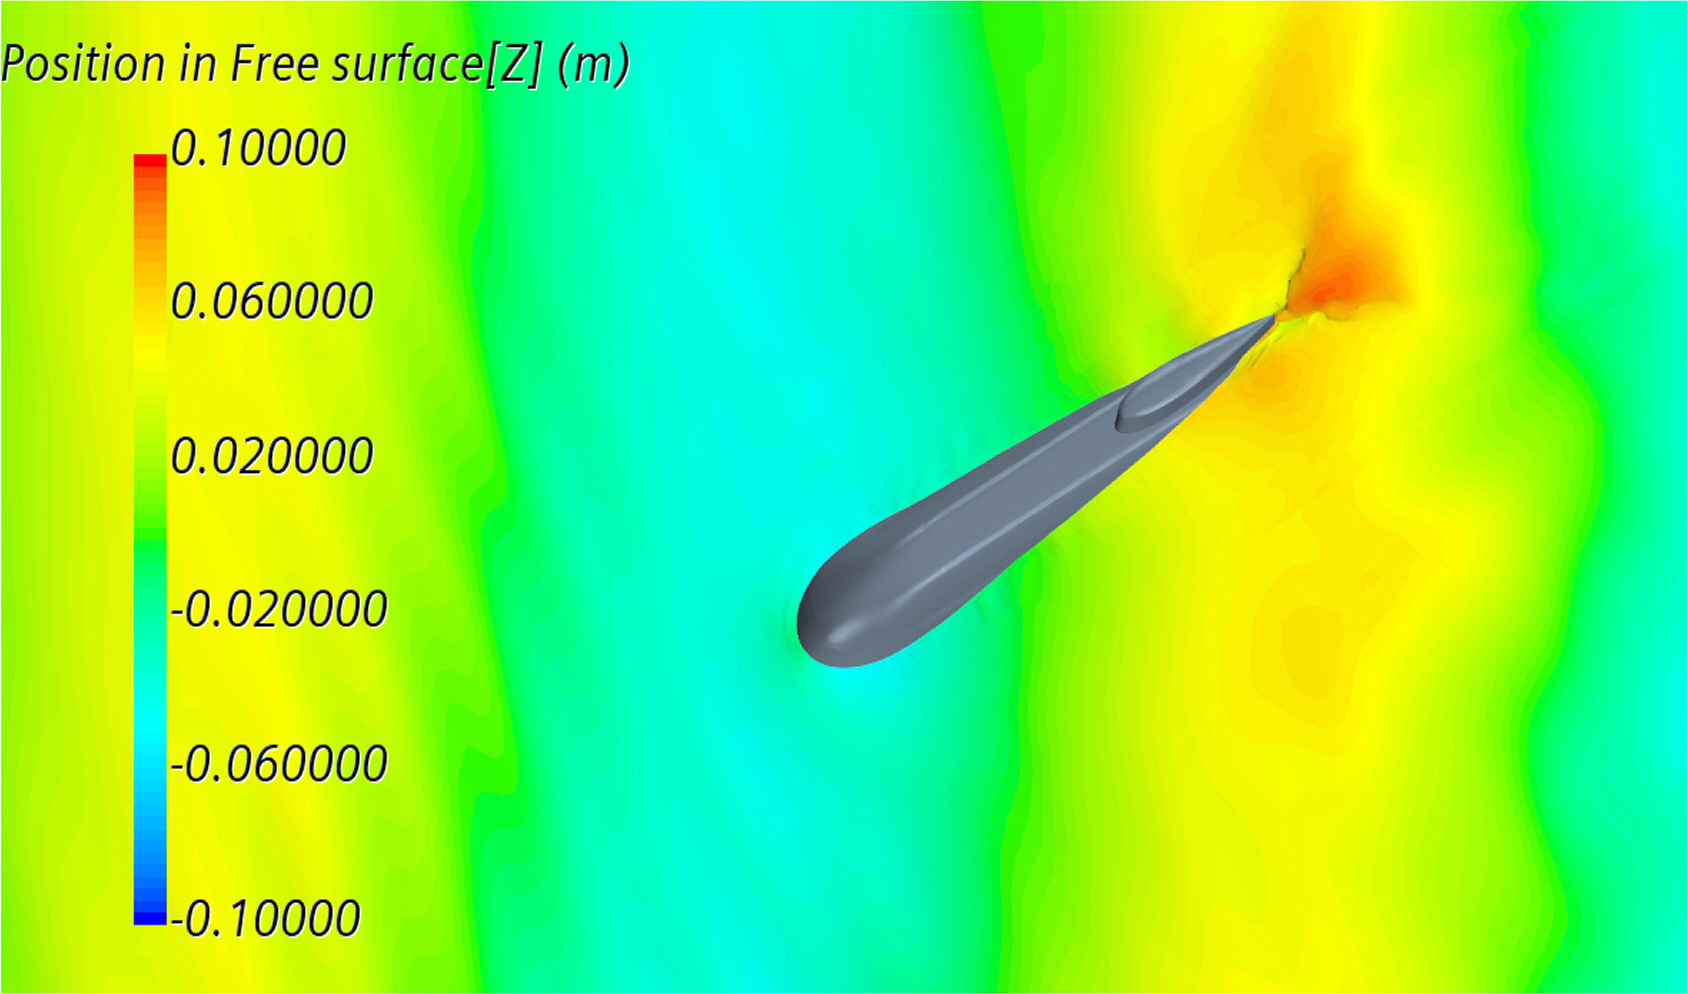
Wave contour on free surface from CFD simulation (μ = 30º)
According to DNV-RP-C103 (DNV, 2005), the flow of water on top of the pontoons with nonlinear effects for transit conditions is not taken into account in a linear calculation. The primary results of these nonlinear effects are reduced heave, pitch, and roll motions near resonance (Recommended practice DNV-RP-C103, 2005). In this study, the seakeeping analysis was carried out using a spectral method from the motion RAOs based on linear calculation. Therefore, in the future, it is necessary to apply direct estimation in irregular waves to further improve the calculation accuracy.
5. Conclusion
In this study, seakeeping performance of a submarine in free surface conditions was evaluated by CFD code and potential code. Estimated results were compared with experimental results, and the following conclusions were made.
From the results, the roll RAOs from CFD code showed good agreement with experimental results except at low wave frequency.
Motion responses from CFD code showed similar trends to experimental results, while motion responses from potential code showed significantly larger values than experimental results. These differences might be due to nonlinear effects, which quickly become important due to the particular body geometry close to the waterline.
From these comparison results, it was found that seakeeping analysis based on the CFD code can be a good solution for estimating the seakeeping performance of submarines in free surface conditions.
Nomenclature
BM
Metacentric radius
GM
Metacentric height
Hs
Significant wave height
Kxx
Roll radius of gyration
LCG
Longitudinal center of gravity
Tp
Wave peak period
USK
Under Side of Keel
VCG
Vertical center of gravity
λ
Wave length
μ
Wave direction
Notes
No potential conflict of interest relevant to this article was reported.
This research was supported by “the development and demonstration of data platform for AI-based safe fishing vessel design (20220210)” of the Ministry of Oceans and Fisheries, Republic of Korea.