Fin and Temperature Effect of Frost in Ambient Air Vaporizer
Article information

Abstract
Since liquefied natural gas (LNG) is imported in a liquid state of about −162°C to increase transportation efficiency in Korea, it must be vaporized in a gaseous state to supply it to consumers. Among them, ambient air vaporizer (AAV) has caught attention due to eco-friendly and low costs characteristics. However, there is a disadvantage that the performance of the heat exchanger is deteriorated due to frost due to mist and icing when used for a long time. In this paper, frost generation model in AAV vaporizer was investigated with numerically to examine utilizing the vaporizer performance with the frost generation behavior. The frost generation behavior of AAV vaporizers was examined with humidity, fin characteristic, and temperature effects. As for the LNG discharge temperature, the 12 fin vaporizer showed the highest discharge temperature when the atmospheric temperature was 25°C, and the 8 fin vaporizer had the lowest LNG discharge temperature when the atmospheric temperature was 0°C. In the case of frost formation, in the case of the 12 fin vaporizer, it was formed the most at the atmospheric temperature of 25°C, and the least was formed in the vaporizer at the 0°C condition of the atmospheric temperature of 8 fins.
1. Introduction
South Korea is highly dependent on energy imports because it has no domestic energy resources such as oil fields or coal mines. Typically, imported energy resources include coal, petroleum, and natural gas, but these fossil fuels generate pollutants such as SOx (sulfur oxides) and NOx (nitrogen oxides), which are harmful to the human body when burned. Nuclear energy can be an alternative. However, it has its safety risks. Because of environmental concerns, the International Maritime Organization has implemented a SOx regulation to reduce sulfur content to 0.5%, effective from January 1, 2020, as shown in Fig. 1.
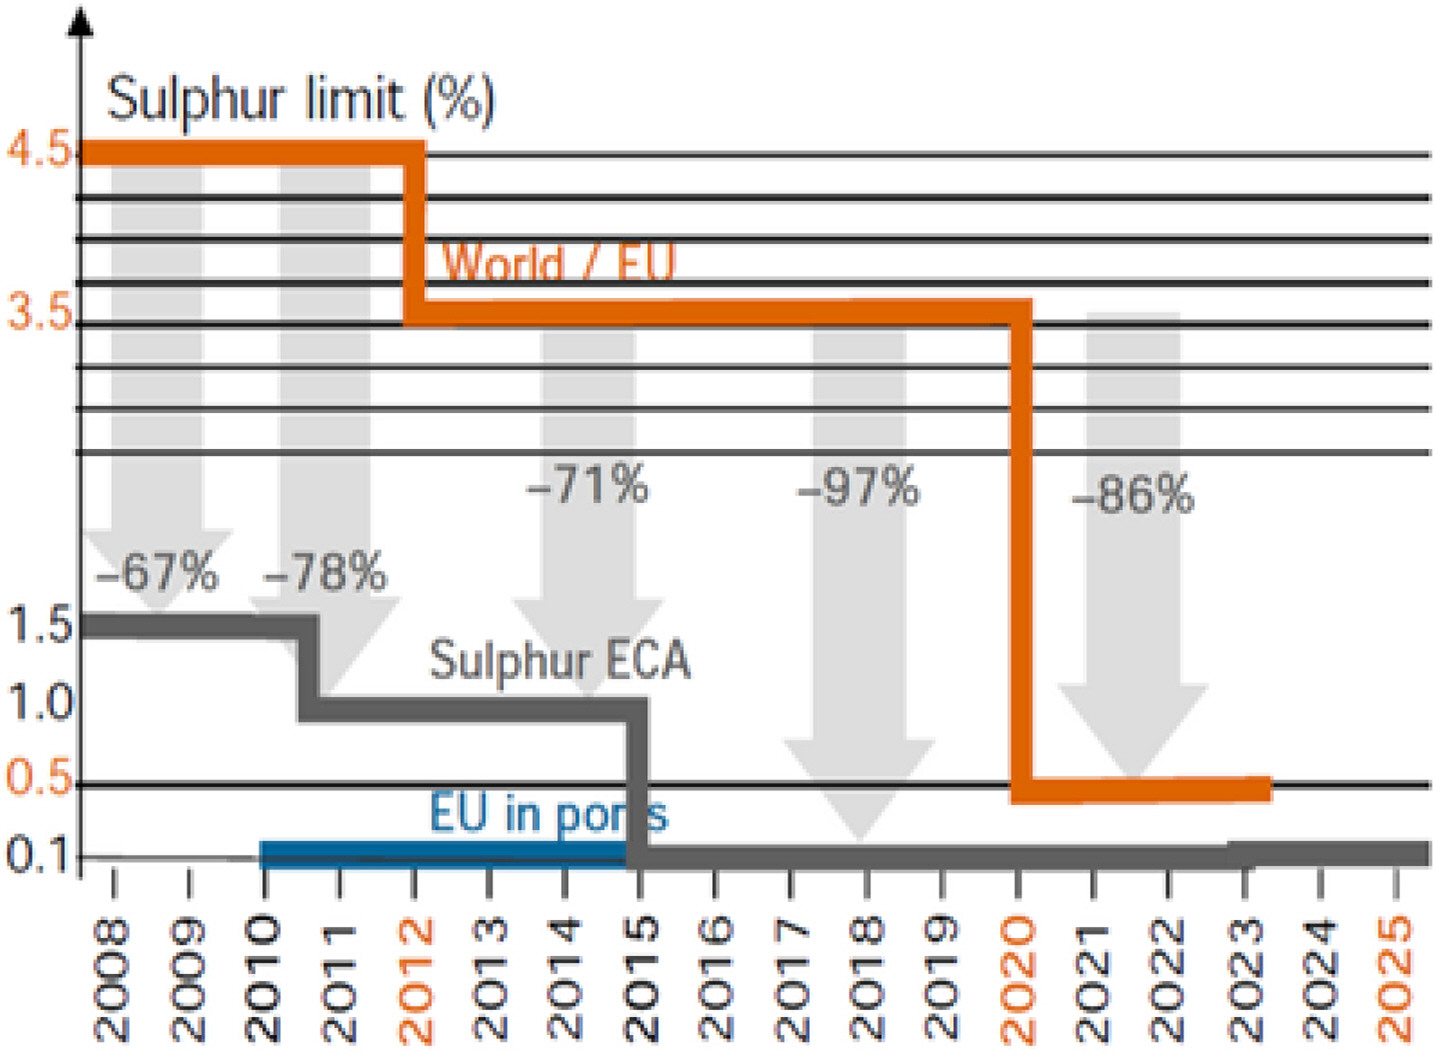
2020 sulfur oxide emission control graph
Emission regulation is a sensitive issue that has a significant impact on the health of residents in coastal areas. The willingness of major countries to participate in the regulations is so strong that emission control areas have been gradually expanding, as shown in Fig. 2.
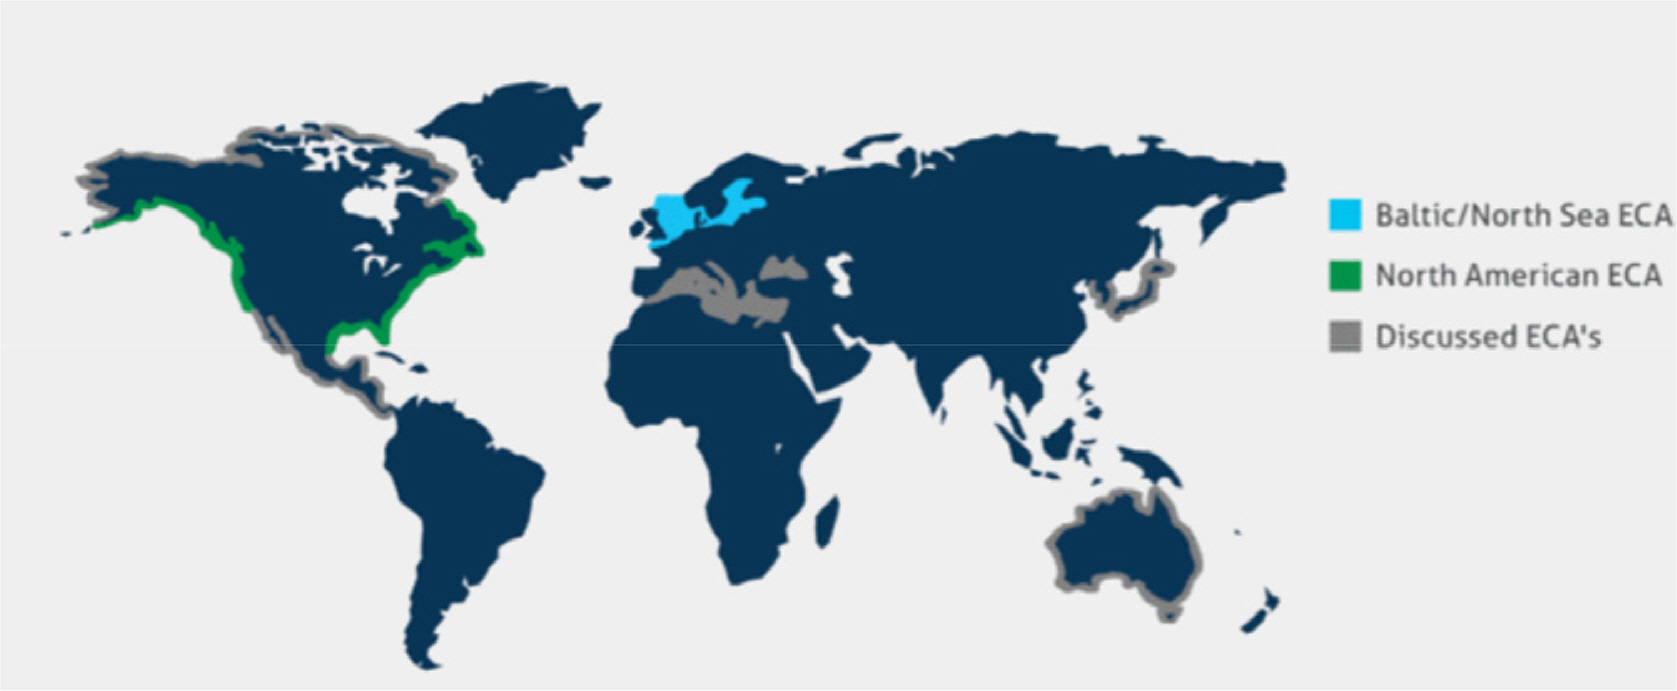
Status of emission control areas around the world
The use of natural gas has been steadily increasing because of its eco-friendliness, stability, and economic efficiency compared to current car fuels. Furthermore, sectors using natural gas are diversifying because it has ample reserves.
Natural gas is supplied to importers in a liquid state of approximately −162 °C to improve transportation efficiency, and it is vaporized when used as an energy source (Kim et al., 1994). Vaporizers are essential for this process, and typical types of vaporizers include open rack vaporizer, submerged combustion vaporizer, and ambient air vaporizer (AAV). AAV refers to a liquefied natural gas (LNG) vaporizer that exchanges heat with surrounding air as a heating medium. The AAV is environmentally friendly, has low operating costs, and its LNG vaporization can be performed during winter. However, over the long-term operation, the performance of its heat exchangers declines because of frost (Kim et al., 2008).
AAVs, which are drawing attention due to global environmental issues, have fog and frost issues in long-term operation, as shown in Fig. 3, and these issues must be resolved urgently. The large generation of fog and frost acts as thermal resistance for the vaporizer, reducing the thermal efficiency by about 80–85% (Park and Oh, 2006). Many studies have been conducted to reduce the frost generation caused by the condensation of water vapor in the AAV, but there is limited research on solutions that can prevent frost growth (Hermes, 2009; Park et al., 2018; Park and Song, 2019; Kim et al., 2018). This study examined a numerical analysis method for the frost generation process during the operation of the AAV, which is essential for cryogenic LNG. We used the LNG properties to understand the frost generation behavior numerically using atmospheric humidity and temperature conditions, which are essential variables in AAV operation. The frost generation results were compared according to the number of fins in the vaporizer.
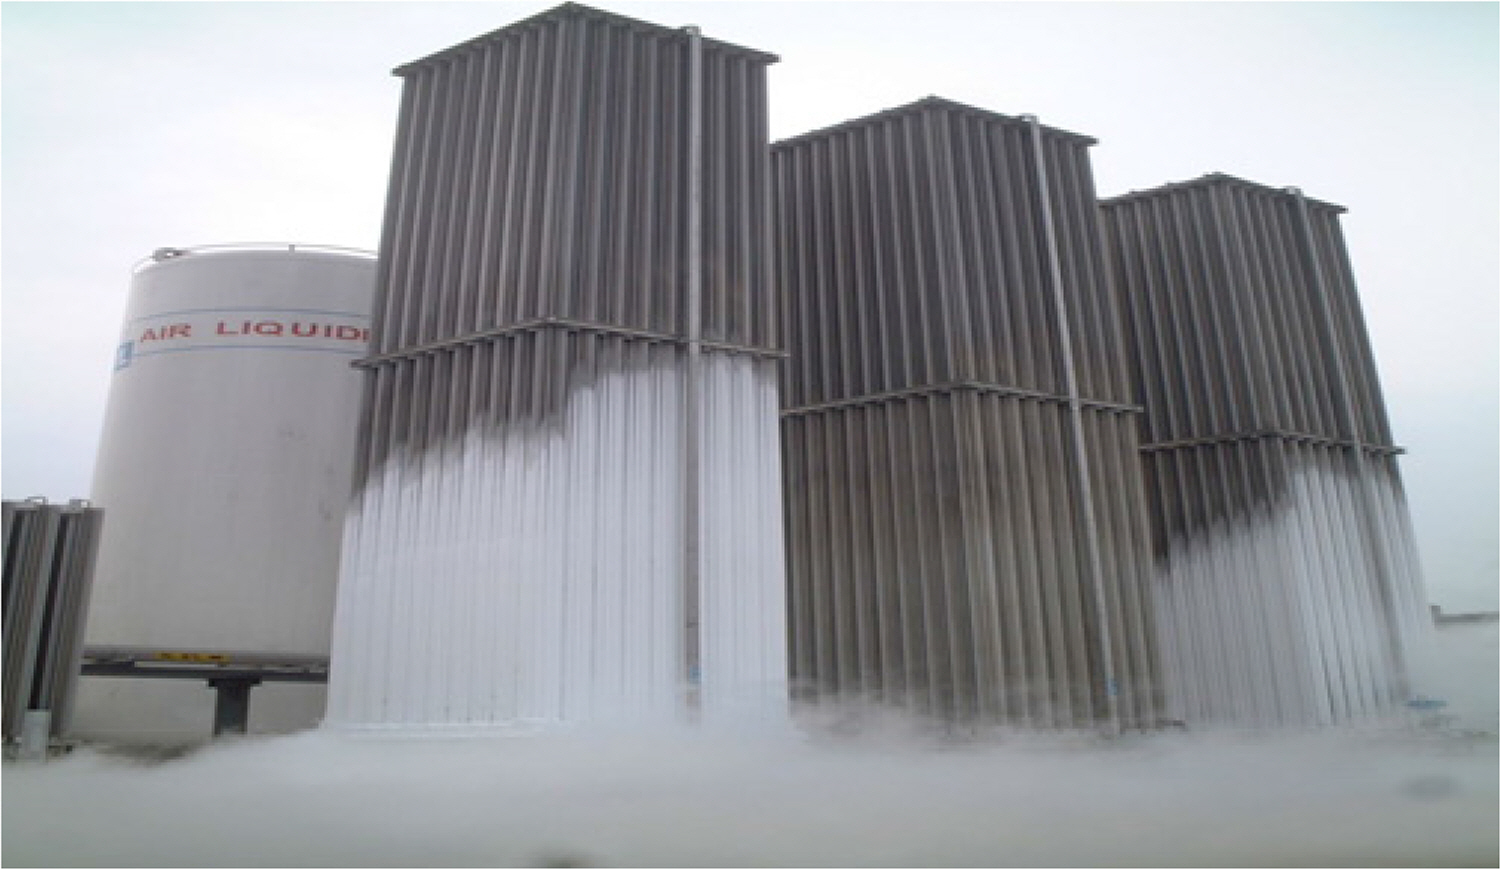
Fog and frost generated during AAV operation
2. Numerical Analysis of Frost Generation
2.1 Numerical Modeling Assumptions
(1) We assumed that the fin tube’s properties are constant regardless of temperature changes.
(2) Since methane, ethane, and propane account for 99% of the LNG, it is treated as a mixture of these components.
(3) Compulsory conditions are given for the air fan flow around the vaporizer.
(4) For the airflow region outside the tube, turbulent flow conditions are given to the region of Ra≥1010.
(5) Heat transfer by the radiation effect is ignored.
2.2 Heat Transfer, Phase Change, and Mass Exchange Model
For the frost generation around the vaporizer, we used the mixture model of Eqs. (1) and (2) with the properties of air and frost. To simulate the mass exchange between the air and frost, we used a multi-phase mass exchange model using Eqs. (7) and (8). For the simulation of multi-phase mass exchange, we created subroutines by applying user-defined functions. Based on these functions, we used mass (Eq. (1)) and momentum conservation equations (Eq. (3)) as source terms. We determined the enthalpy using the energy generated with the source term, forming Eqs. (4)‒(6) as the energy equations.
To apply the LNG properties, we created a mixture with the three main components of CH4, C2H6, and C3H8 using the LNG components of Table 1 (QuerolE et al., 2010; Fernández et al., 2017; Rao et al., 2016). Subroutines were created for the LNG material properties by applying user-defined functions, thereby modularizing every component.
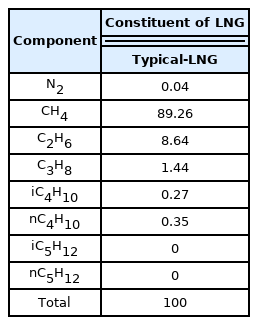
LNG Properties
2.3 Calculation Conditions
For the calculation of frost generation, we created a non-adaptive grid (hexahedral grid) with 200,000 nodes. To examine the convergence of the calculation, we checked whether the conditions of less than or equal to 10–4 and 10–6 were appropriate for the mass and energy residual balance, respectively. They were maintained to proceed with the numerical analysis.
3. Results
3.1 Numerical Analysis and Validation
The frost generation and heat transfer model were validated through a comparison with experimental results for validation (Afrasiabian et al., 2018). The validation experiment had the following conditions: a duct below the plate having a size of 99.5 mm × 80.2 mm × 3.4 mm, with low-temperature fluid (liquid nitrogen and low-temperature fluid) flowing inside the duct. Air flowed at a constant flow rate above the plate, and the bottom of the plate had a wall temperature of −4 to −16°C. The results of the frost generation were summarized based on these conditions. To validate the numerical analysis, it was conducted under the experiment’s conditions (the humidity was set to 85%, and the wind speed was set to 7 m/s), and its results were compared with the experimental results. Fig. 4 shows the frost generation results based on the wall temperature for the flow of low-temperature fluid. We found that the lower the wall temperature, the greater the frost generation, and Fig. 5 compares the obtained values. In Fig. 5, the error rate is large in the low-temperature region. The error is somewhat large in the low-temperature region because actual frost generation, condensation, and densification occurred, and the numerical analysis showed the frost generation through heat transfer based on the temperature change. A comparison of the numerical analysis and experimental results showed that the error rate between the results was approximately 5 to 10%.
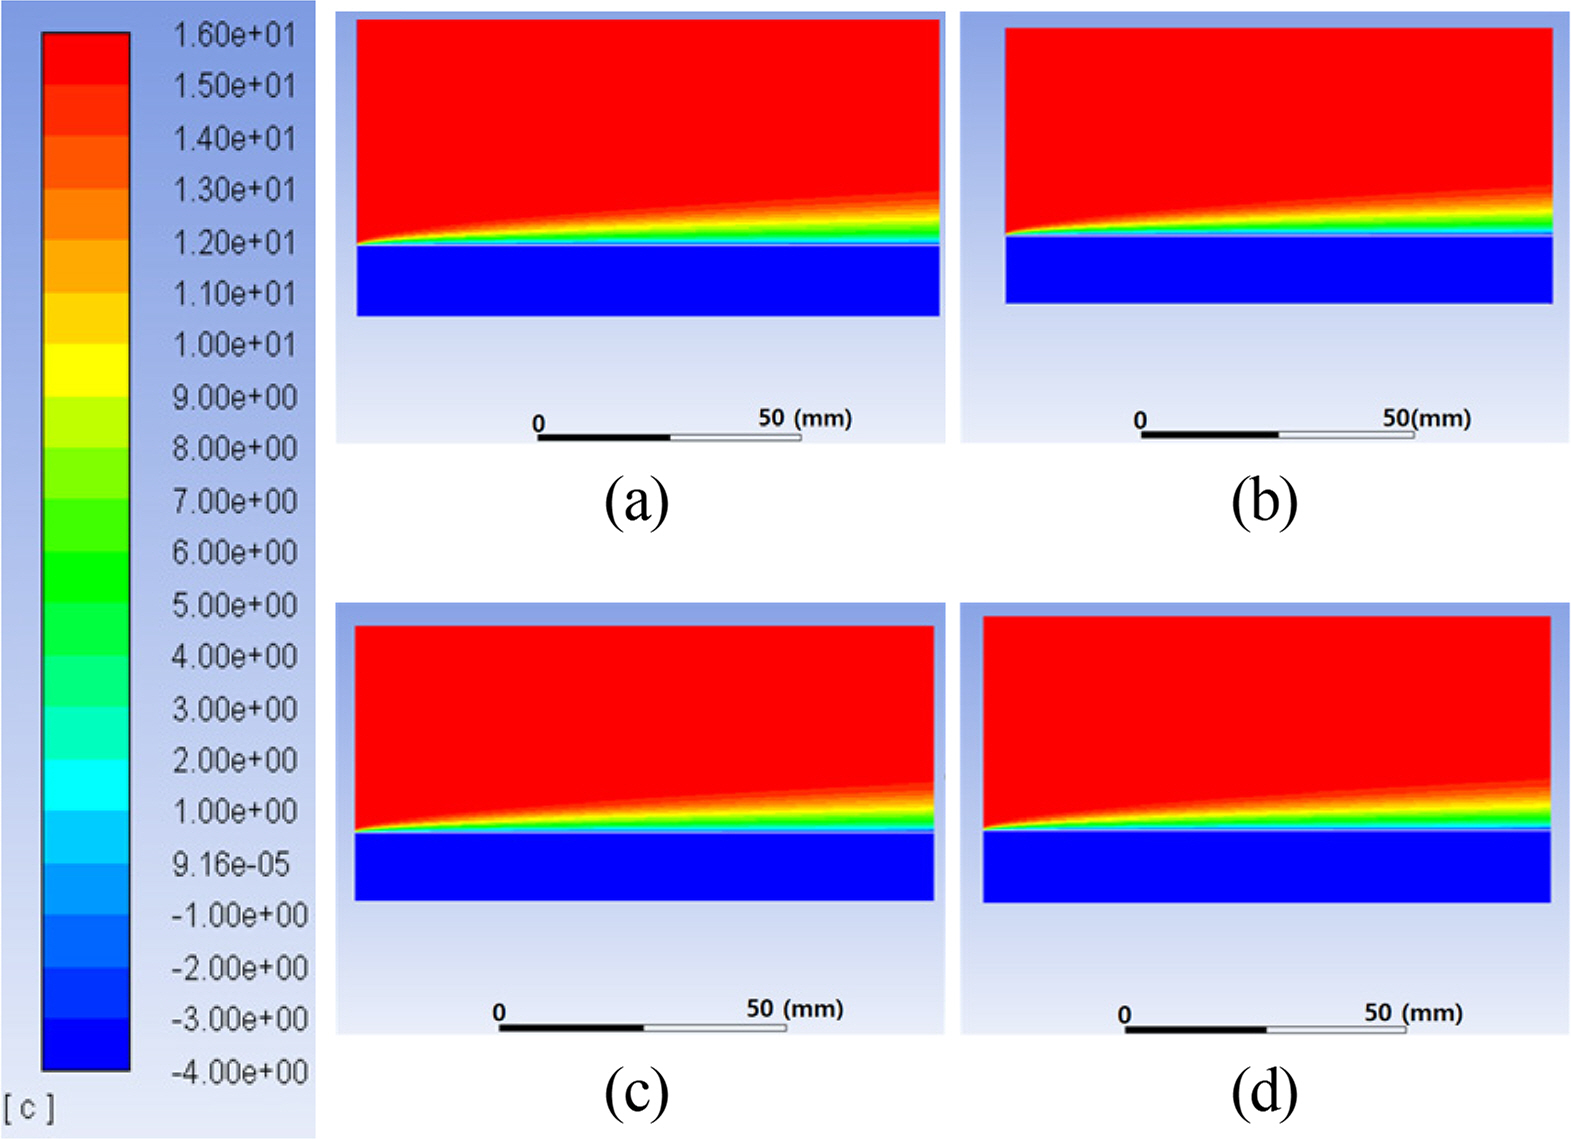
Frost generation value according to temperature: (a) −4°C wall temperature; (b) −8°C wall temperature; (c) −12°C wall temperature; (d) −16°C wall temperature

Comparison between the experimental data and validation data
3.2 Numerical Analysis Conditions of AAV
For the numerical analysis of the AAV, we modeled the vaporizer at the Incheon Production Base of Korea Gas Corporation and set the operating time to 180 min (Lee et al., 2018a; Lee et al., 2018b). Furthermore, based on the Korea Meteorological Administration’s data for the Incheon Production Base, we set the external temperature conditions to 0 and 25°C.
Similarly, humidity conditions of 60% were given based on the Korea Meteorological Administration’s data. Fig. 6 and Table 2 show the conditions and geometry of the fin applied to the numerical analysis. The number of fins used in the vaporizer was set to 8 and 12 to compare the frost generation process, which has heat transfer. For the AAV’s capacity, we set the LNG flow rate to 10 t/h based on the reference capacity of the Incheon Production Base and assigned a condition of 10 m/s for the fan based on the fan capacity of approximately 4,200 N·m3/min. A temperature condition of −163°C was given for the injected LNG temperature, and the LNG injection pressure in the flow was set to 7.55 MPa.
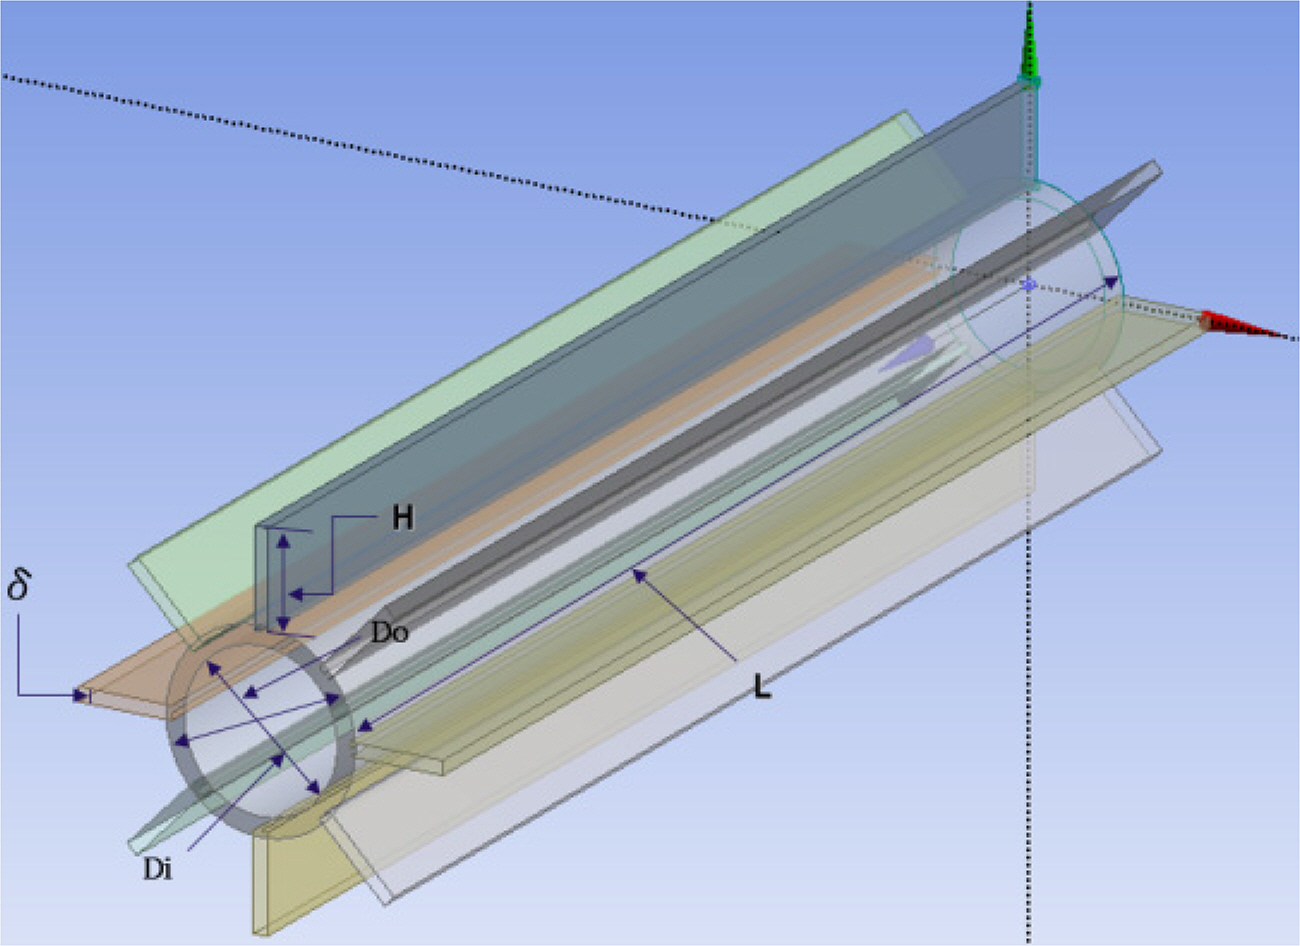
Geometry model of the fin tube: Specification of vaporizer

Summary of fin characteristics
3.3 Numerical Analysis Results of AAV
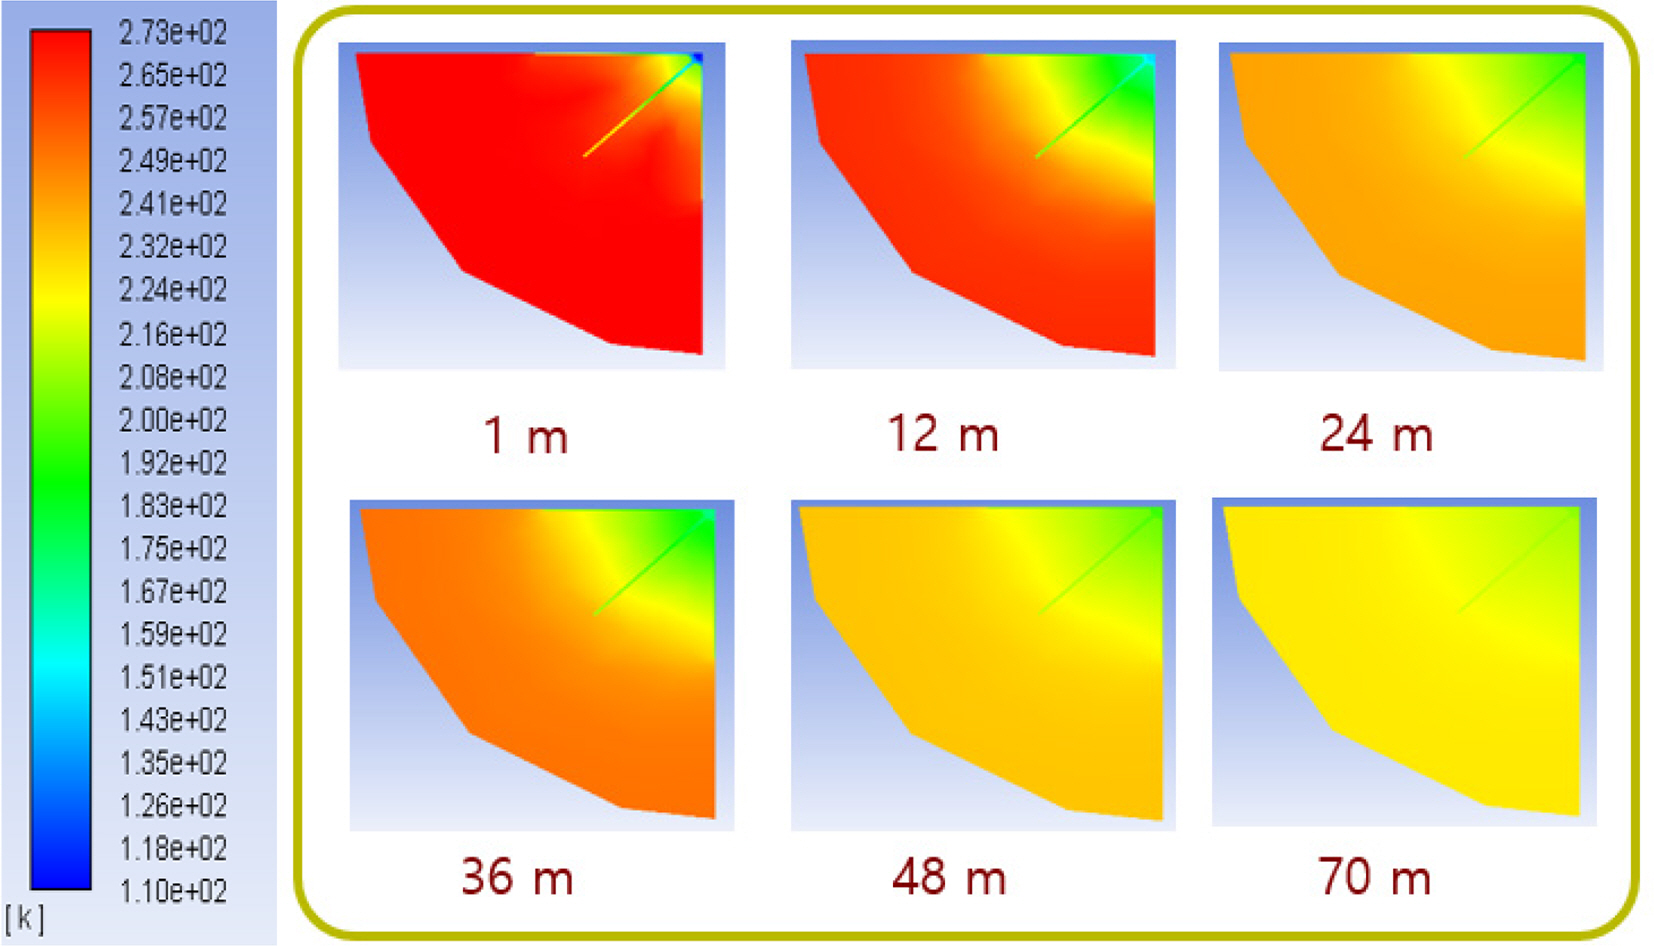
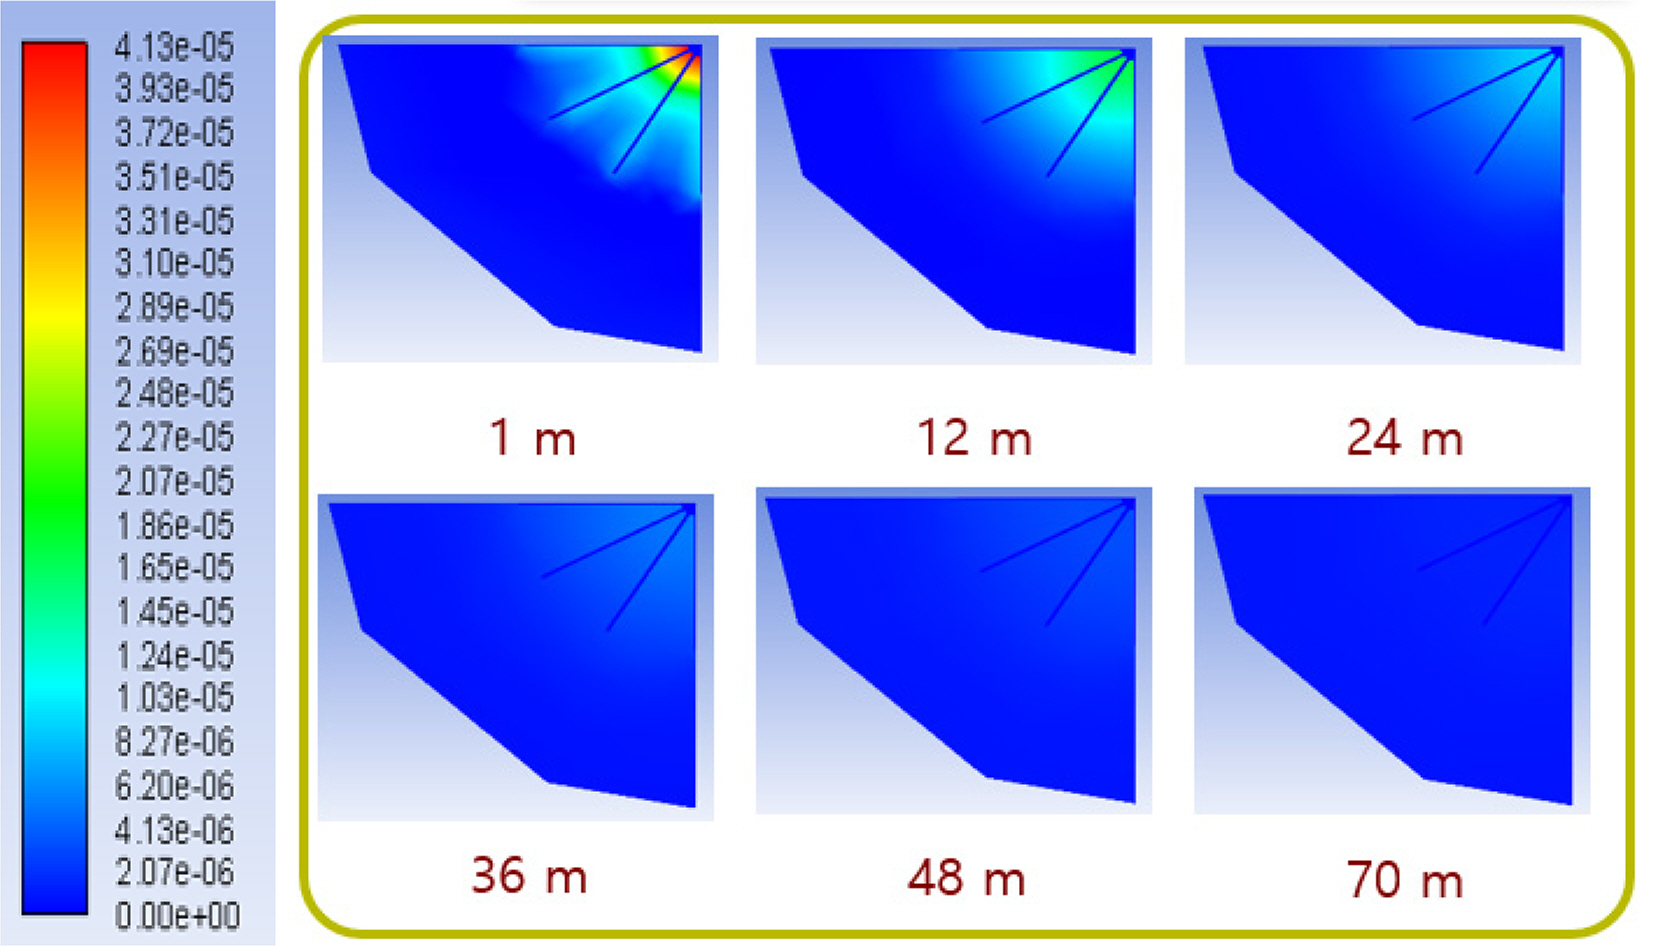
Figs. 7–14 show the frost generation process for 8 and 12 fins. They show contours to summarize the temperature and frost thickness results obtained through the numerical analysis when the atmospheric temperature is 25 and 0°C, and the fan speed was 10 m/s. We summarized the temperature and frost thickness results at 1, 12, 24, 36, 48, and 70 m for the 72 m AAV.
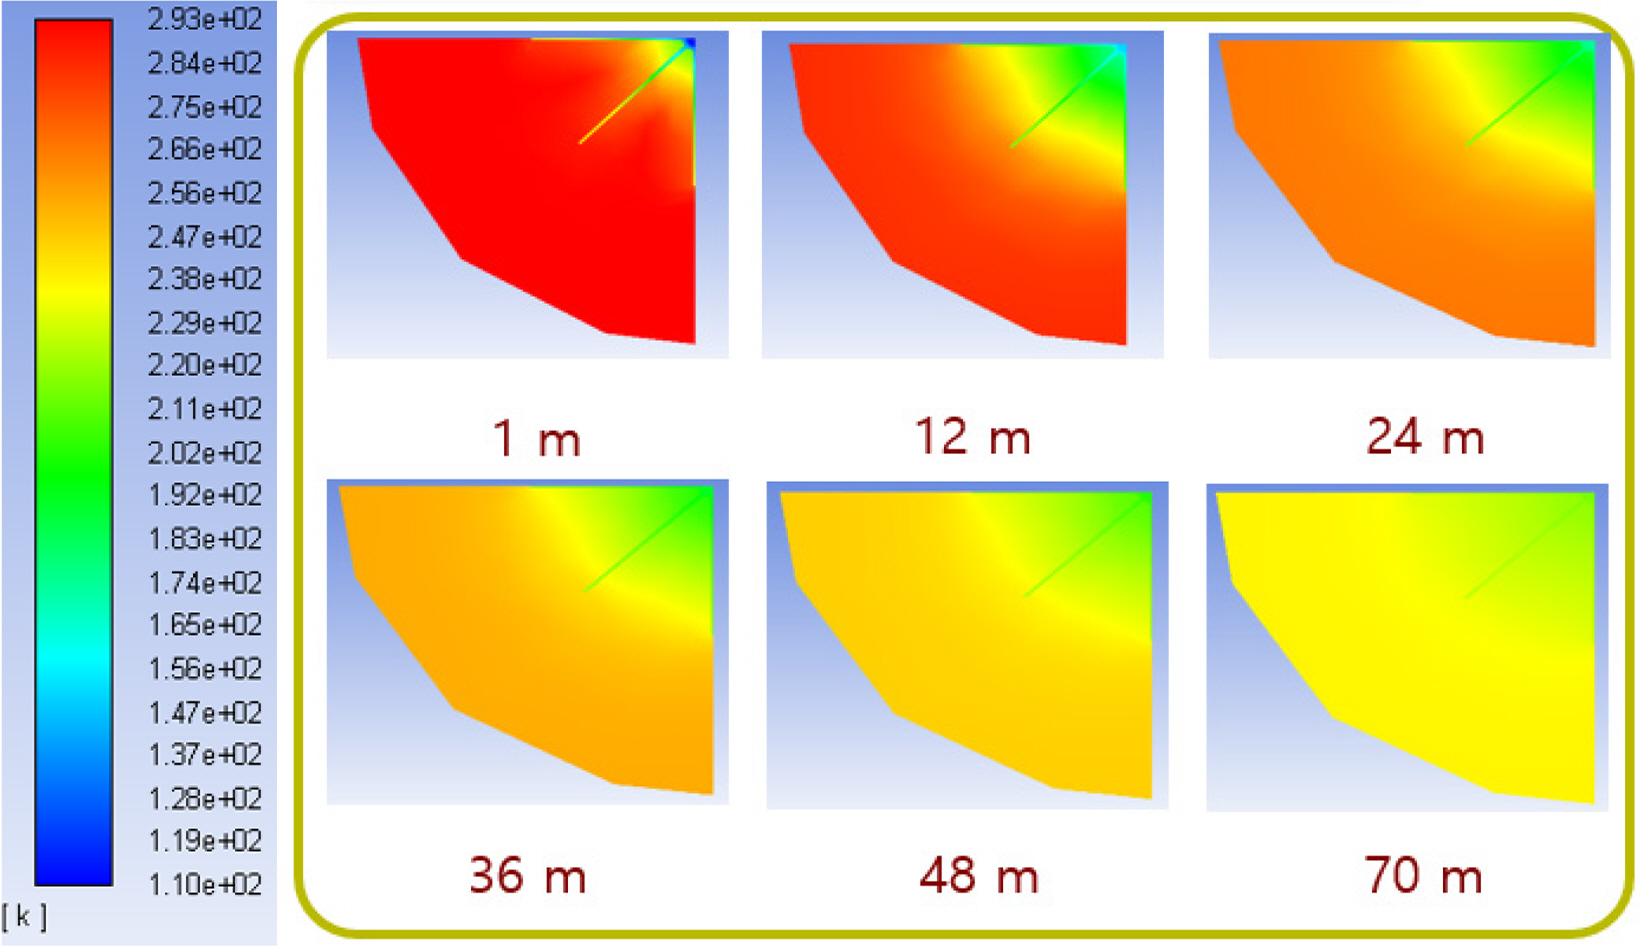
Temperature contour of 8 fin with outer temperature of 25°C at 300 s
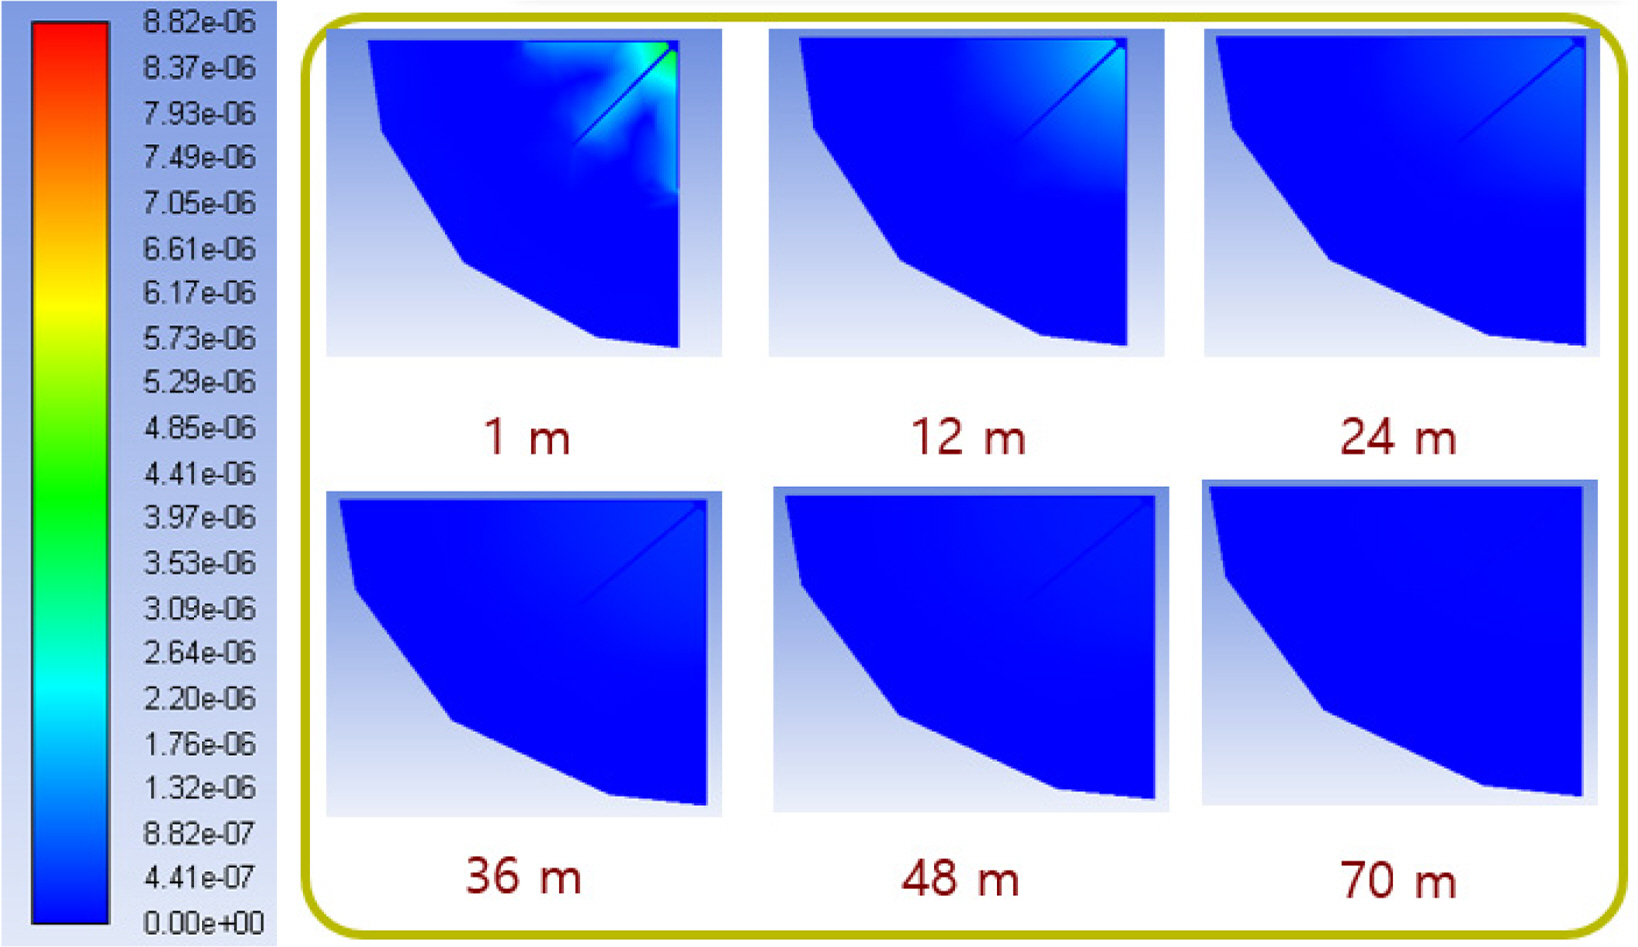
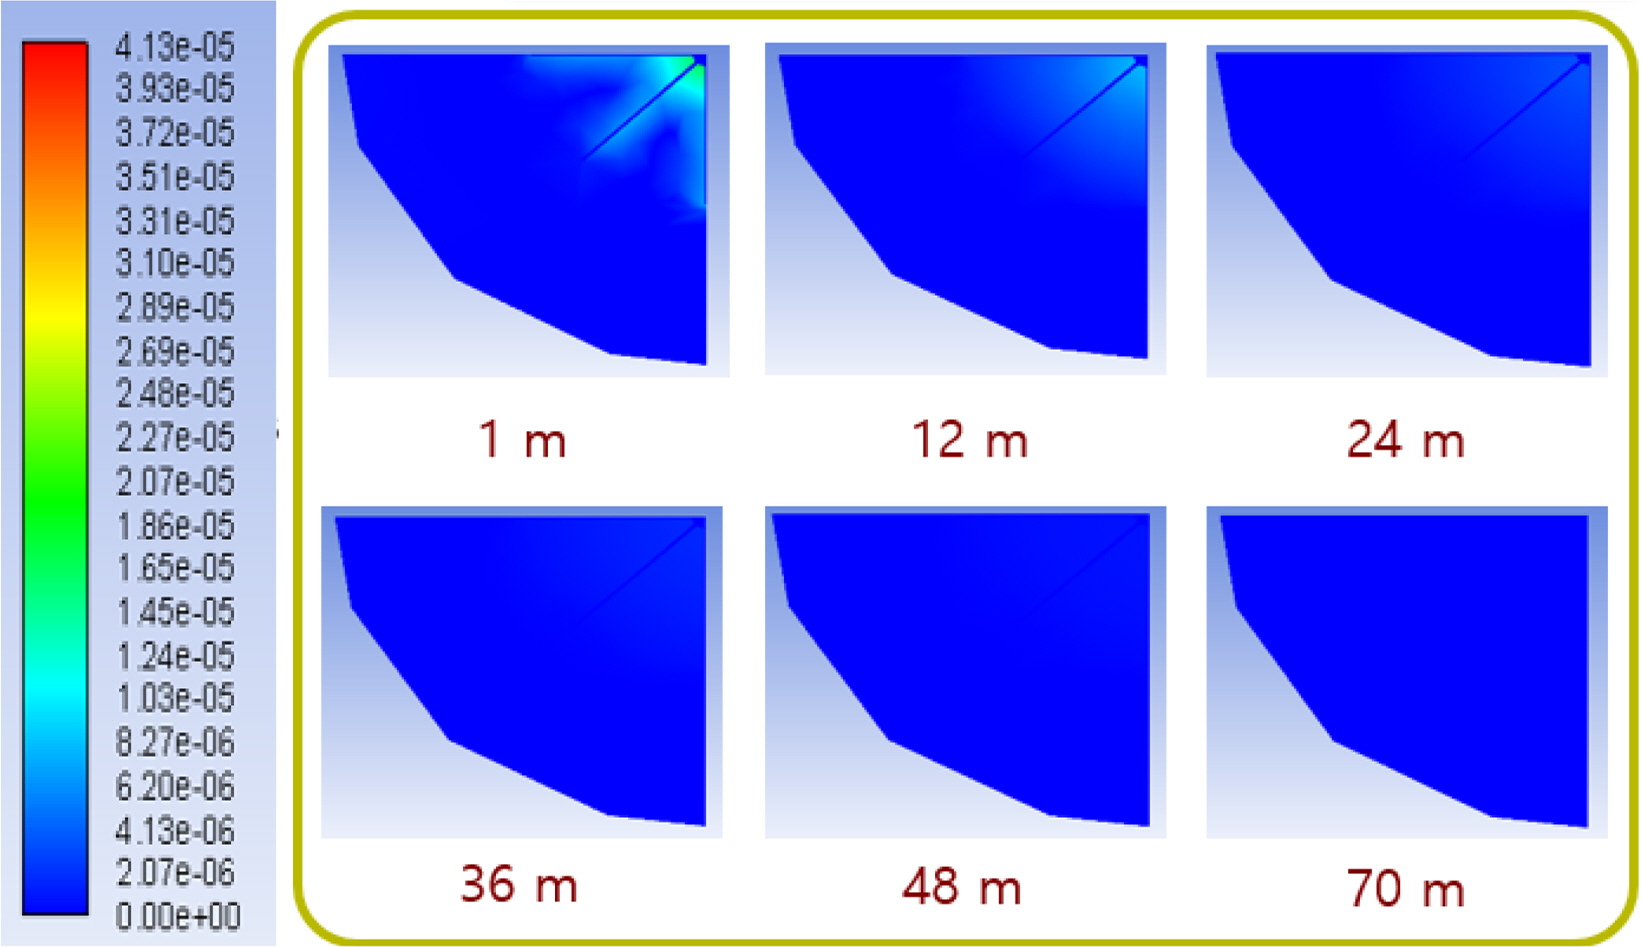
Frost thickness contour of 8 fin with outer temperature of 25°C at 300 s
Temperature contour of 8 fin with outer temperature of 0°C at 300 s
Frost thickness contour of 8 fin with outer temperature of 0°C at 300 s

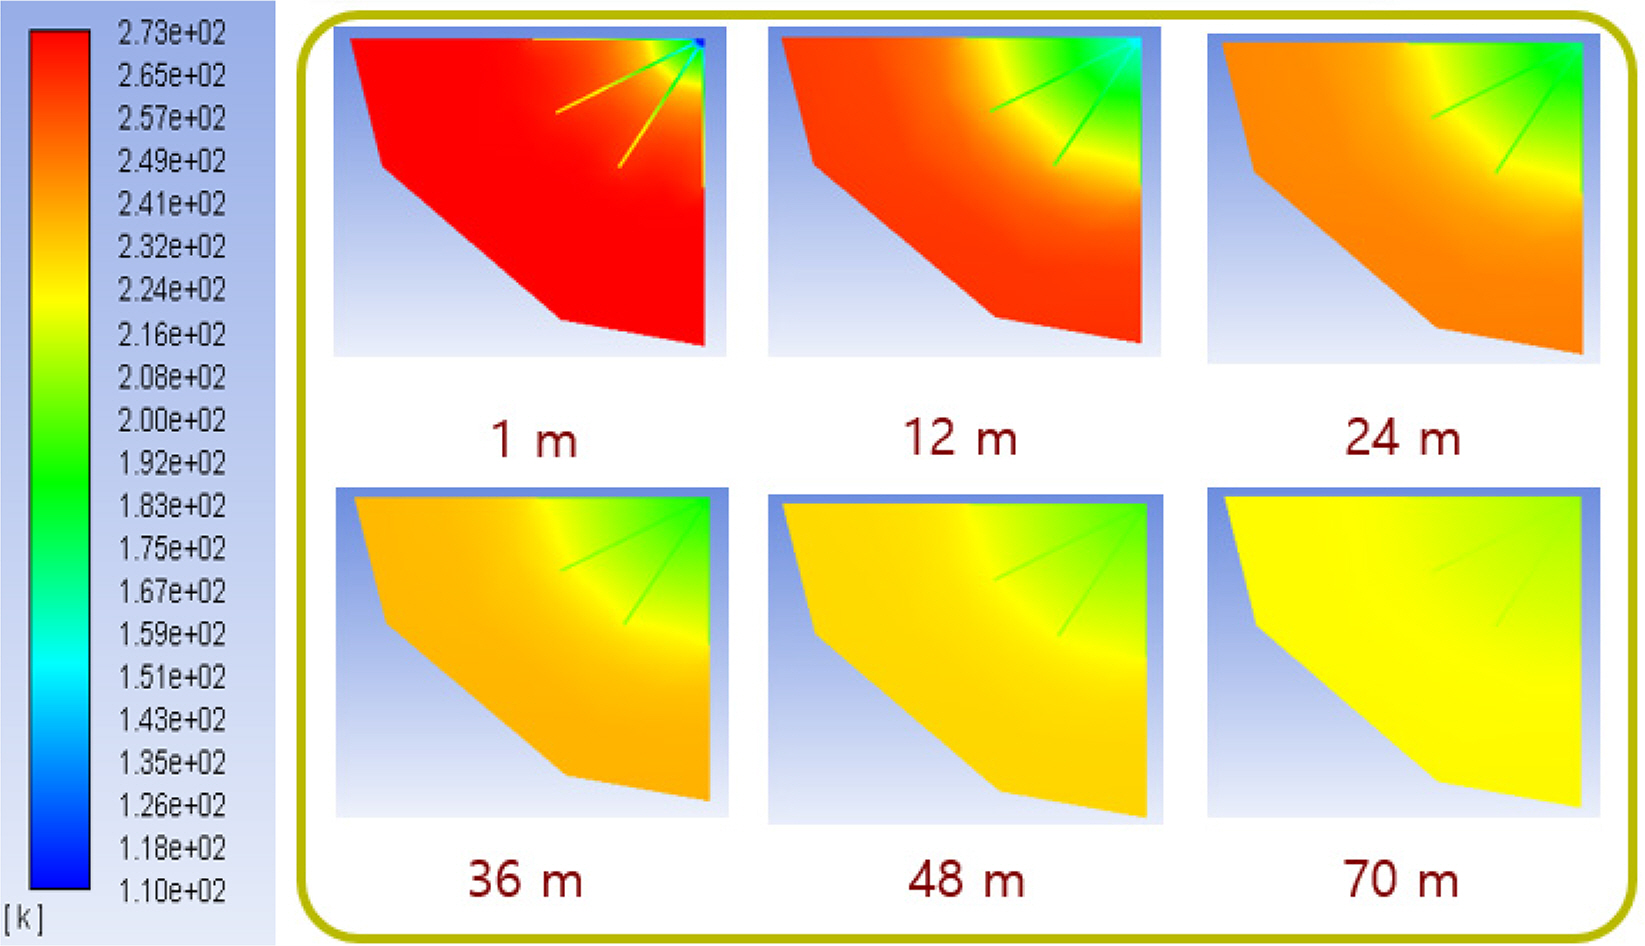
Temperature contour of 12 fin with outer temperature of 25°C at 300 s
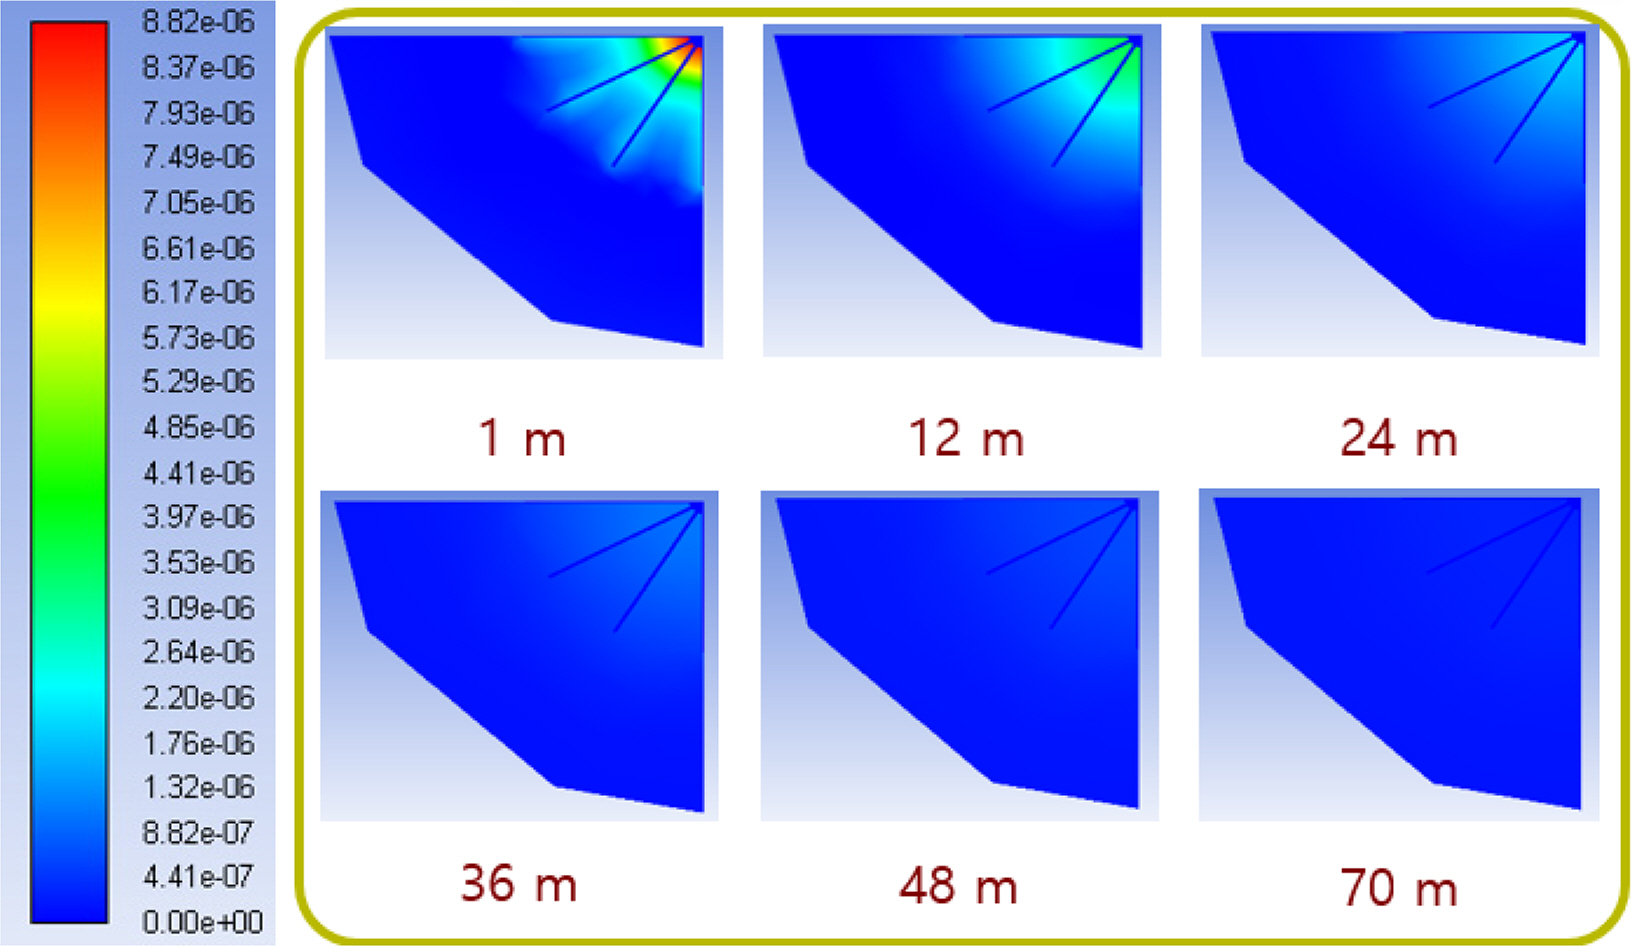
Frost thickness contour of 12 fin with outer temperature of 25°C at 300 s
Temperature contour of 12 fin with outer temperature of 0°C at 300 s
Frost thickness contour of 12 fin with outer temperature of 0°C at 300 s
Figs. 7–10 show contours to summarize the temperature and frost thickness results obtained from the numerical analysis for 300 s when the 8-fin fan speed is 10 m/s with an atmospheric temperature of 25 or 0°C. We summarized the temperature and frost thickness contours by setting the length of AAV to 1, 12, 24, 36, 48, and 70 m. When the fan speed was 10 m/s in the 8-fin, the LNG discharge temperature was higher when the atmospheric temperature was 25 °C than when it was 0°C. Furthermore, more frost was formed when the atmospheric temperature was 25°C.
Figs. 11–14 show contours to summarize the temperature and frost thickness results obtained through the numerical analysis for 300 s when the 12-fin fan speed was 10 m/s with an atmospheric temperature of 25 or 0°C. We summarized the temperature and frost thickness contours by setting the length of the AAV to 1, 12, 24, 36, 48, and 70 m. When the 12-fin fan speed was 10 m/s, the LNG discharge temperature was higher when the atmospheric temperature was 25°C than when it was 0°C. Furthermore, more frost was formed when the atmospheric temperature was 25°C.
Fig. 15 shows the LNG discharge temperature results based on a fan speed of 10 m/s for the 8-fin and 12-fin vaporizers. For the 8-fin vaporizer, the discharge temperature was about 8°C higher when the atmospheric temperature was 25°C compared to when it was 0°C. For the 12-fin vaporizer, the discharge temperature was about 15°C higher when the atmospheric temperature was 25°C compared to when it was 0°C. The 12-fin vaporizer showed the highest LNG discharge temperature at an atmospheric temperature of 25°C. On the other hand, the 8-fin vaporizer showed the lowest LNG discharge temperature at an atmospheric temperature of 0°C. According to the frost thickness results, both the 8-fin and 12-fin vaporizers generate more frost when the atmospheric temperature is 25°C, because when the atmospheric temperature rises, so does the convective heat transfer coefficient, resulting in a higher LNG discharge temperature, increasing frost formation.
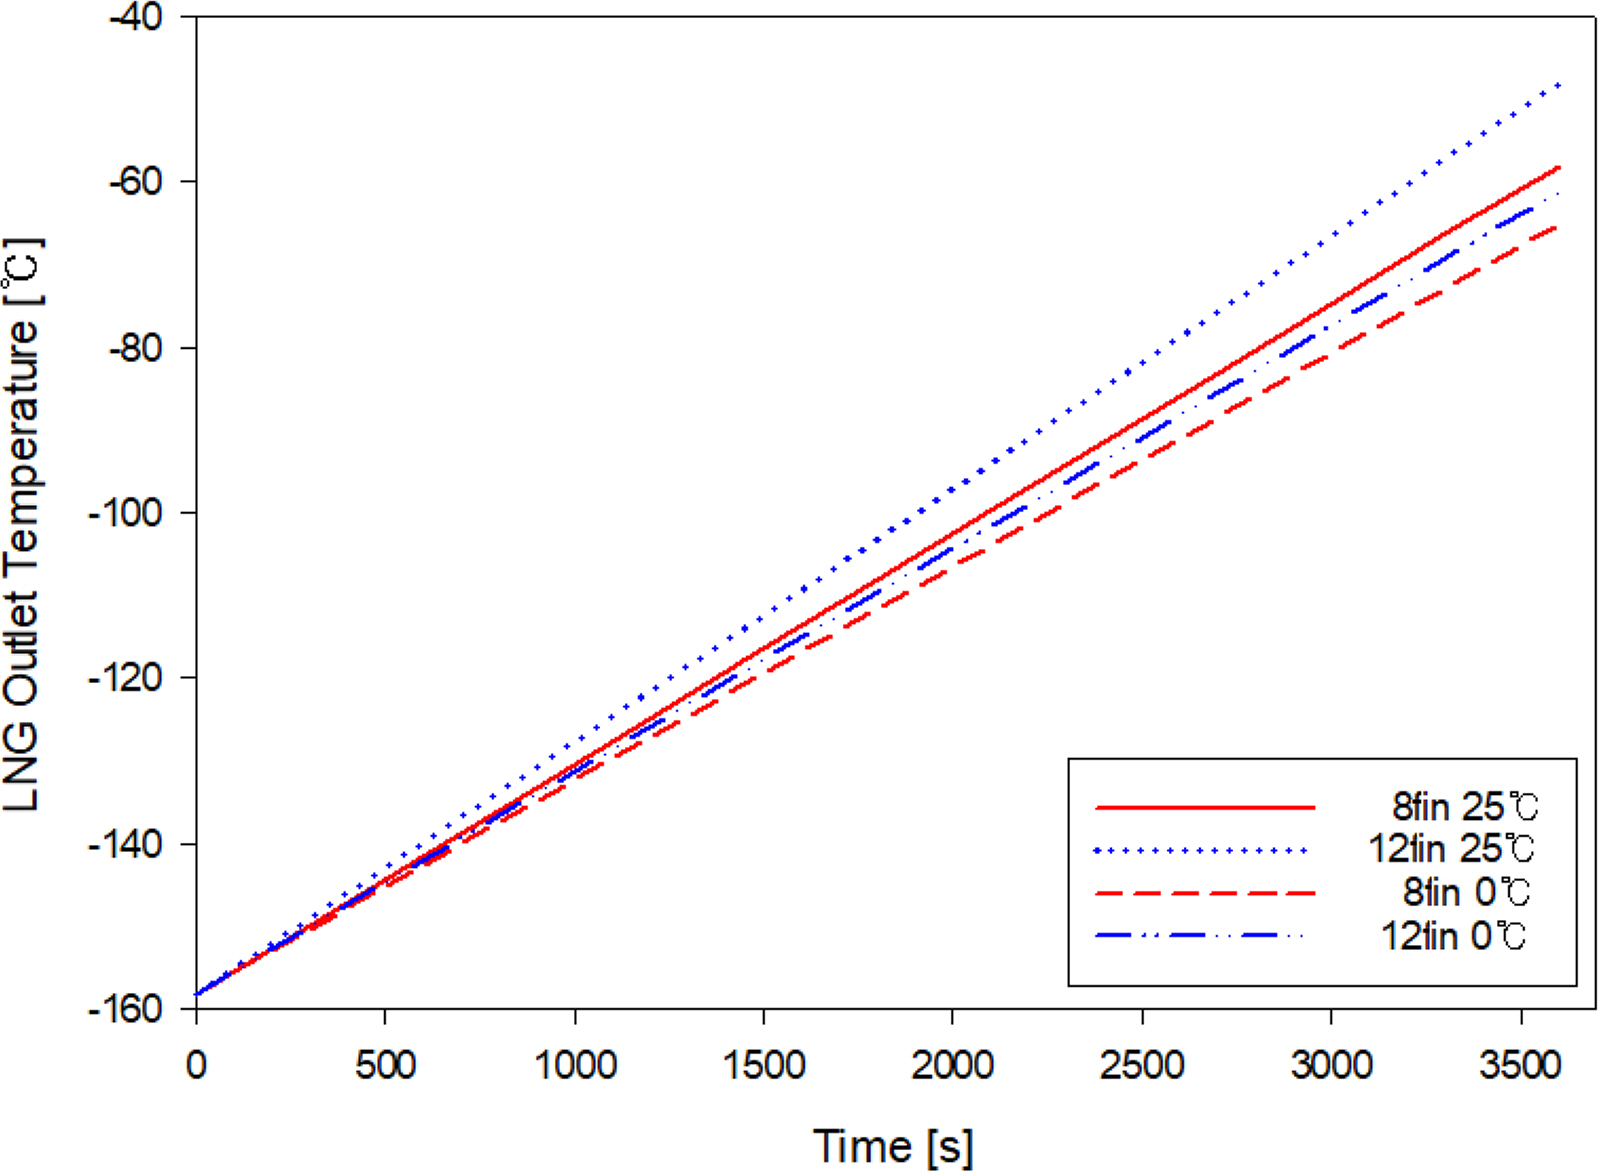
Outlet temperature of LNG for the 8, 12 fin vaporizer
Fig. 16 shows the thickness results of the generated frost according to the AAV length after one hour for the 8-fin and 12-fin vaporizers. The frost generation was concentrated on the 0–1 m part of the inlet, and frost generation decreased as the distance from the inlet increased. Based on the frost thickness derived according to the AAV length, the 12-fin vaporizer generated approximately 92 and 95% more frost on the inlet part compared to the 8-fin vaporizer when the atmospheric temperature was 25 and 0°C, respectively.
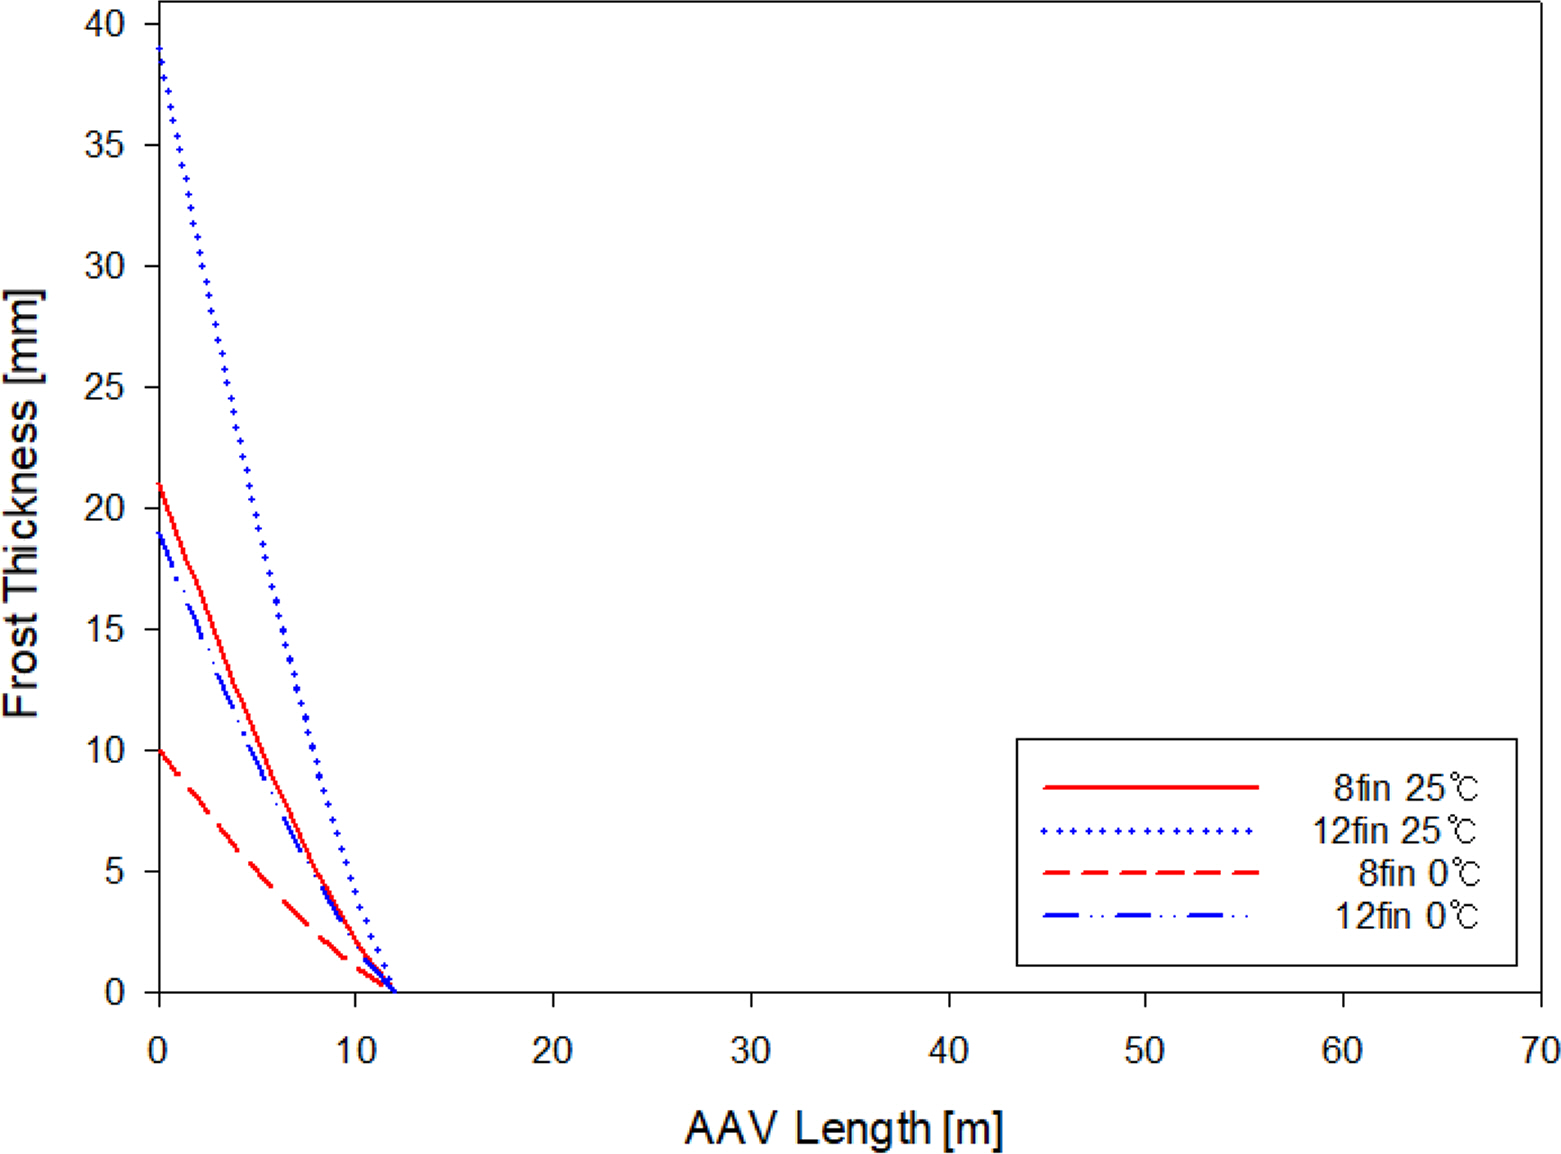
8, 12 fin Frost thickness
These results indicate that the vaporizer inlet requires a device that can remove frost. Furthermore, the operating conditions must be reflected according to the atmospheric temperature, and a method that can configure as many fins as possible under conditions that guarantee vaporizer robustness is required.
4. Conclusion
This study examined a numerical analysis method for the frost generation process in the operation of an AAV, which is essential for cryogenic LNG. Using LNG properties, we numerically investigated frost generation under atmospheric humidity and temperature conditions, which are essential variables in AAV operation.
For the LNG discharge temperature, the 12-fin vaporizer showed the highest discharge temperature at an atmospheric temperature condition of 25°C, while the 8-fin vaporizer showed the lowest LNG discharge temperate at an atmospheric temperature of 0°C. Based on the generated frost thickness obtained according to the AAV length, after one hour, for the 8-fin and 12-fin vaporizers, the frost generation was concentrated on the 0–1 m part of the inlet, and as the distance from the inlet increased, the frost generation decreased. We also found that the 12-fin vaporizer generated approximately 92 and 95% more frost on the inlet than the 8-fin vaporizer when the atmospheric temperature was 25 and 0°C, respectively. In the future, we will conduct research on heat transfer and frost generation for each LNG component based on the results of this study.
Nomenclature
Gr
Grashof number (-)
Re
Reynolds number (-)
Ra
Rayleigh number (-)
A
Area (m2)
D
Diameter (m)
ṁ
Mass flow (kg/s)
t
Time (s)
L
Tube length (m)
H
Enthalpy (kJ/kg)
xi
Mole fraction of liquid (-)
yi
Mole fraction of gas (-)
T
Celsius (°C)
r
Radius (m)
S
Mass transfer coefficient (-)
P
Pressure (N/m3)
ρ
Density (kg/m3)
δ
Fin thickness (m)
Notes
Sung-Woong Chio serves as an editor of the Journal of Ocean Engineering and Technology but has no role in the decision to publish this article. No potential conflict of interest relevant to this article was reported.
This work was supported by the Materials/Parts Technology Development Program (20017575, Development of Applicability Evaluation Technology for Cryogenic Insulation Material and Storage Vessel considering Operating Condition of Hydrogen Commercial Vehicle) funded By the Ministry of Trade, Industry & Energy (MOTIE, Korea)