Performance Analysis of Multiple Wave Energy Converters due to Rotor Spacing
Article information

Abstract
A numerical hydrodynamic performance analysis of the pitch-type multibody wave energy converter (WEC) is carried out based on both linear potential flow theory and computational fluid dynamics (CFD) in the unidirectional wave condition. In the present study, Salter’s duck (rotor) is chosen for the analysis. The basic concept of the WEC rotor, which nods when the pressure-induced motions are in phase, is that it converts the kinetic and potential energies of the wave into rotational mechanical energy with the proper power-take-off system. This energy is converted to useful electric energy. The analysis is carried out using three WEC rotors. A multibody analysis using linear potential flow theory is performed using WAMIT (three-dimensional diffraction/radiation potential analysis program), and a CFD analysis is performed by placing three WEC rotors in a numerical wave tank. In particular, the spacing between the three rotors is set to 0.8, 1, and 1.2 times the rotor width, and the hydrodynamic interaction between adjacent rotors is checked. Finally, it is confirmed that the dynamic performance of the rotors slightly changes, but the difference due to the spacing is not noticeable. In addition, the CFD analysis shows a lateral flow phenomenon that cannot be confirmed by linear potential theory, and it is confirmed that the CFD analysis is necessary for the motion analysis of the rotor.
1. Introduction
A wave energy converter (WEC) that generates electrical energy from wave energy is a subject of high research interest in academia. Salter’s duck, which is a pitch-type WEC positioned on the water surface to primarily convert wave energy into rotational kinetic energy of a floating body (rotor), is one of the oldest WECs and has been researched since the 1970s (Salter et al., 1975). Salter’s duck maximizes wave energy absorption by designing the front and rear shapes differently and thus is theoretically known to have nearly 90% energy absorption efficiency (Swift-Hook et al., 1975). Several recent studies in South Korea have designed Salter’s duck-type WECs suitable for the western waters of Jeju Island. The design parameters and performance of a rotor have been verified through a parametric study of optimal motion performance using the wave data of the western waters of Jeju Island (Poguluri and Bae, 2018), a study on estimating viscous coefficients of a rotor using computational fluid dynamics (CFD) (Poguluri et al., 2019a), and a numerical and experimental study on the linear behavior of a rotor (Kim et al., 2019a). These previous studies, however, focused on only one WEC rotor, so the effects of hydrodynamic interactions between adjacent modules must be analyzed considering how multiple WECs are simultaneously installed in the seas in general (Kim et al., 2020). Previous studies on analyzing dynamic behavior by arranging multiple WECs include an analysis of multiple cylindrical WECs in a heaving motion in the frequency domain (Lee et al., 2018) and in the time domain (Bae and Lee, 2017) as well as a study on optimal arrangement for improving the overall performance of multiple cylindrical WECs (Kim and Bae, 2019b). In these studies, a multibody analysis was performed for cylindrical WECs in the frequency domain to which a linear potential theory was applied, based on which the motion performance of individual WECs was evaluated by solving the coupled equations of motion in the time domain. An approach for computing performance changes and interactions may be effective for multiple cylindrical WECs with a fairly weak nonlinearity of motions; however, there are limitations in examining performance changes and interactions of arrayed WEC rotors based only on linear potential theory, because asymmetrical WEC rotors applied in this study have a greater nonlinearity of motions than cylindrical WECs. Therefore, this study conducted a frequency domain analysis based on linear potential theory in addition to a CFD analysis for simulating nonlinearity of motion in order to examine the performance of multiple WEC rotors with an asymmetrical shape.
First, WAMIT, a three-dimensional diffraction/radiation potential analysis program based on linear potential theory, was used to calculate motion characteristics of three arrayed rotors in the frequency domain, and the response characteristics were analyzed by adjusting the spacing between arrayed rotors. Motion response characteristics were analyzed when three rotors were arranged using a commercial CFD code that adequately reflects nonlinear characteristics of rotor motions. The spacing between three rotors was adjusted during a CFD analysis to observe the changes in motion characteristics, and the effects of hydrodynamic interactions of adjacent WEC rotors were quantitatively computed.
2. Numerical Analysis Conditions
To conduct a numerical analysis in the frequency domain based on linear potential theory, the coupled equations of motion of three arrayed WEC rotors were established first, and then the hydrodynamic coefficients of the coupled equations of motion were computed using WAMIT. A response amplitude operator (RAO) of three rotors in the frequency domain was calculated, and the results were compared. For a CFD analysis, wave generation and wave absorption were performed using a three-dimensional numerical wave tank in which three rotors were arranged in the center to perform a regular wave simulation for 60 s. The performance was compared using the average amplitude of motions after obtaining the motion response of each rotor through this process.
2.1 Linear Motion Equation of Multiple Arrayed Rotors
When three WEC rotors are arranged on a still water surface, each rotor is not mechanically coupled with another rotor but still moves in the same fluid domain; thus, the equation of motion must be established considering the effects of hydrodynamic interactions. The coupled equations of motion of three rotors with three degrees of freedom (DOF) can be expressed as shown in Eq. (1), where the subscripts 1, 2, and 3 indicate rotors no. 1, 2, and 3, respectively.
As shown in Fig. 1, the analysis was conducted by designating two rotors on each side as rotor 1 and rotor 3 and the rotor in the center as rotor 2.
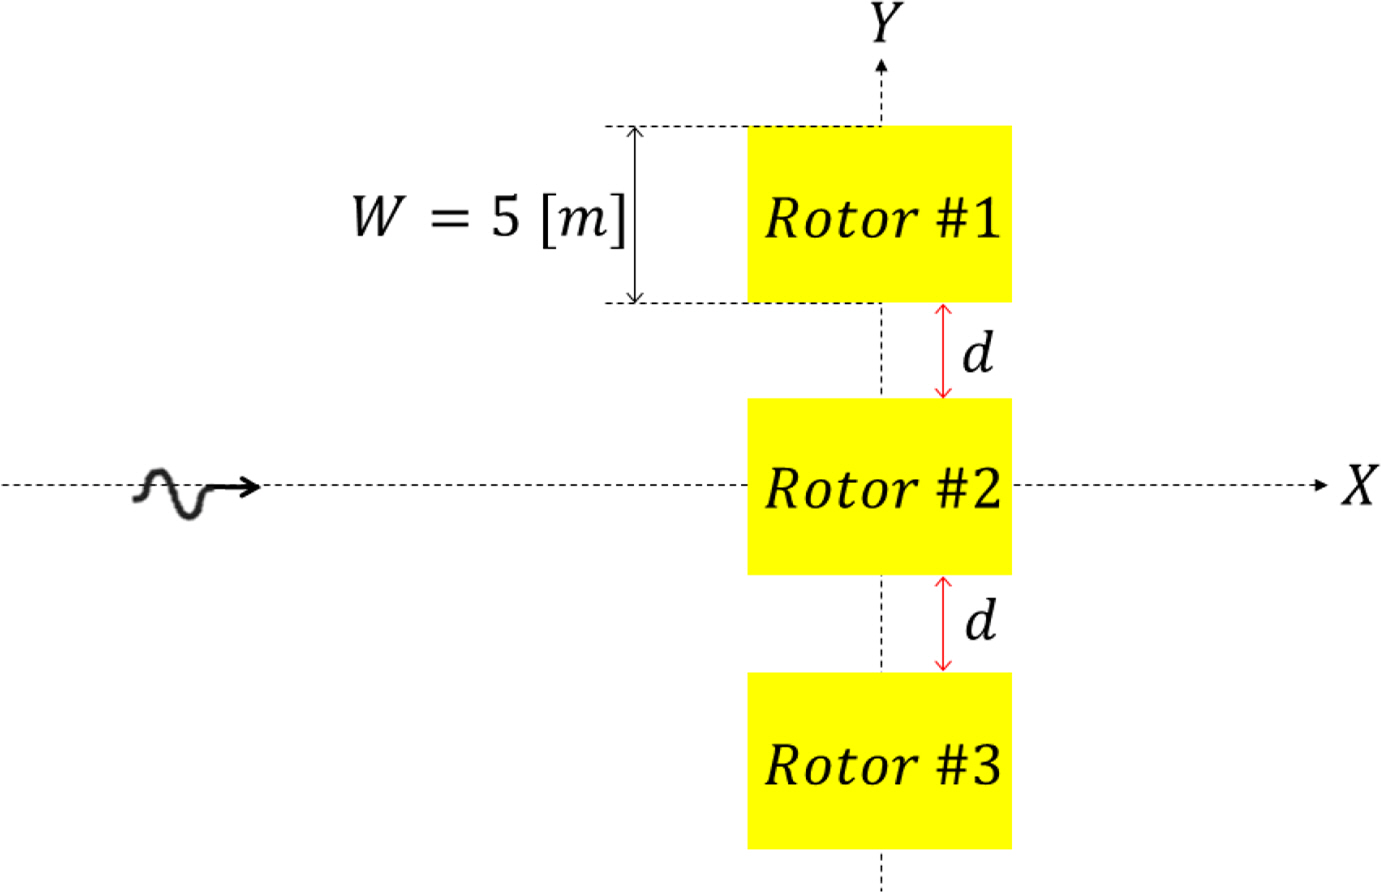
Schematic representation of arrayed rotors (top view)
In Eq. (1), ξ¨n, ξ̈n, and ξn, represent the rotational acceleration, velocity, and displacement, respectively, of rotor n (n =1, 2, 3). Moreover, Inn, ann, bnn, and knn represent the mass moment of inertia, added mass moment of inertia, radiation damping coefficient, and restoring moment coefficient, respectively, of rotor n. bvis represents the viscous damping coefficient, which was experimentally computed by performing a free decay test in a two-dimensional wave tank. fn (t) represents the wave exciting moment in the direction of rotational motion of rotor n. From Eq. (1), the added mass moment of inertia a and radiation damping coefficient b have coupled terms among three rotors, which are expressed as anm and bnm (n≠m ) using different subscripts. These refer to the added mass moment of inertia and radiation damping coefficient of rotor n due to rotational motions of rotor m. The added mass moment of inertia, radiation damping coefficient, and wave exciting moment including coupled terms were computed using a multibody analysis of WAMIT. The wave exciting moment was computed using diffraction potential while having the behavior of three rotors confined; hydrodynamic forces acting on the structure being moved and hydrodynamic forces (coupled added mass moment of inertia and coupled radiation damping coefficient) acting on adjacent rotor without being moved were computed by having three rotors move sequentially one at a time using radiation potential.
To construct the same environment as the 3D CFD analysis when performing a multibody analysis using WAMIT, walls were built 5 m from both ends of the arrayed rotors. The motion performance of the arrayed rotors may partially change owing to the wall effects of both sides, but this is an inevitable arrangement for comparison in the same simulation environment as the 3D CFD analysis. Fig. 2 illustrates three rotors and a mesh model of the wall for a WAMIT multibody analysis where the number of meshes used for one rotor is 2,800.

Mesh model for multibody analysis
2.2 Experimental Calculation of Viscous Damping Coefficient
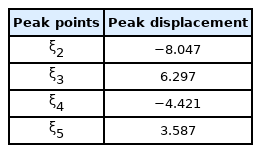
Viscous damping coefficient bvis was calculated by performing a free decay test in a 2D wave tank. When a rotor in still water is forced to rotate at a certain angle upward or downward from equilibrium position and confinement is removed, the rotor moves in two-way rotational motions where rotational displacement gradually decreases during which a pitch displacement with respect to time is obtained using an image tracking technique as shown in Fig. 3. Subsequently, the damping ratio ζ= 0.0928 was calculated using the logarithmic decrement ratio relation expressed in Eq. (2). Here, ξi is a positive or a negative i-th peak value; as shown in Table 1, the damping ratio was calculated using only ξ2 ‒ξ5 values in this study, excluding the initial transient response part of the free decay test (Kim et al., 2019a). The overall damping coefficient including the radiation damping coefficient and viscous damping coefficient was computed using the damping ratio obtained previously; an approximate viscous damping coefficient was computed by subtracting the numerical radiation damping coefficient obtained through WAMIT from the overall damping coefficient.

Time-history data obtained through free decay test
Specification of experimental model
However, the effects of the reflected wave from the sides are present when conducting a free decay test in a 2D wave tank, in contrast to a 3D environment; thus, it is inappropriate to directly apply the calculated viscous damping coefficient in WAMIT analysis, which is based on 3D potential theory. Most radiated waves of the WEC rotors used in this study spread toward a beak during free decay motions owing to the characteristics of a shape, and radiated waves due to rotational motions were not generated on the sides of the rotors, which were vertical planes. Therefore, the radiated waves due to the internal walls of a 2D wave tank were considered not to have a significant effect on the damping motions of the rotors. The approximate viscous damping coefficient computed through the experiment conducted in a 2D wave tank was applied in a 3D CFD analysis in this study.
2.3 CFD Analysis Conditions
A CFD analysis was conducted using commercial software STAR-CCM+, where a continuity equation (a governing equation of a turbulent flow) and the Reynolds-averaged Navier Stokes (RANS) equations (including momentum equations) were applied to single or multiple rotors. The computation domain is shown in Fig. 4, where three rotors are arranged in the center. Waves are advanced from the − x to the + x direction where the free surface is set to z = 0. Velocity inlet is located at the upstream side of the model, while the pressure outlet boundary is found in the downstream side. Top as pressure outlet and all other boundaries as wall boundaries except y = 0 as symmetry. Wave forcing was applied at inlet and outlet boundaries with 0.5 × λ, where λ is the wave length. The forcing is performed using fifth-order Stokes wave theory. The middle portion in the vicinity of the WEC rotor of the computational domain was chosen as 2 × λ. Fifth-order Stokes waves were generated to represent realistic regular waves. Water depth is fixed at 40 m. The distance between the rotors on the sides and walls was set to 5 m. Considering the large rotational displacement of a rotor, overset meshes were used as shown in Fig. 5, where a variable grid method was applied in which small meshes were arranged around the rotors and larger meshes were arranged in the outer region for computational efficiency.

Computation domain of the numerical wave tank
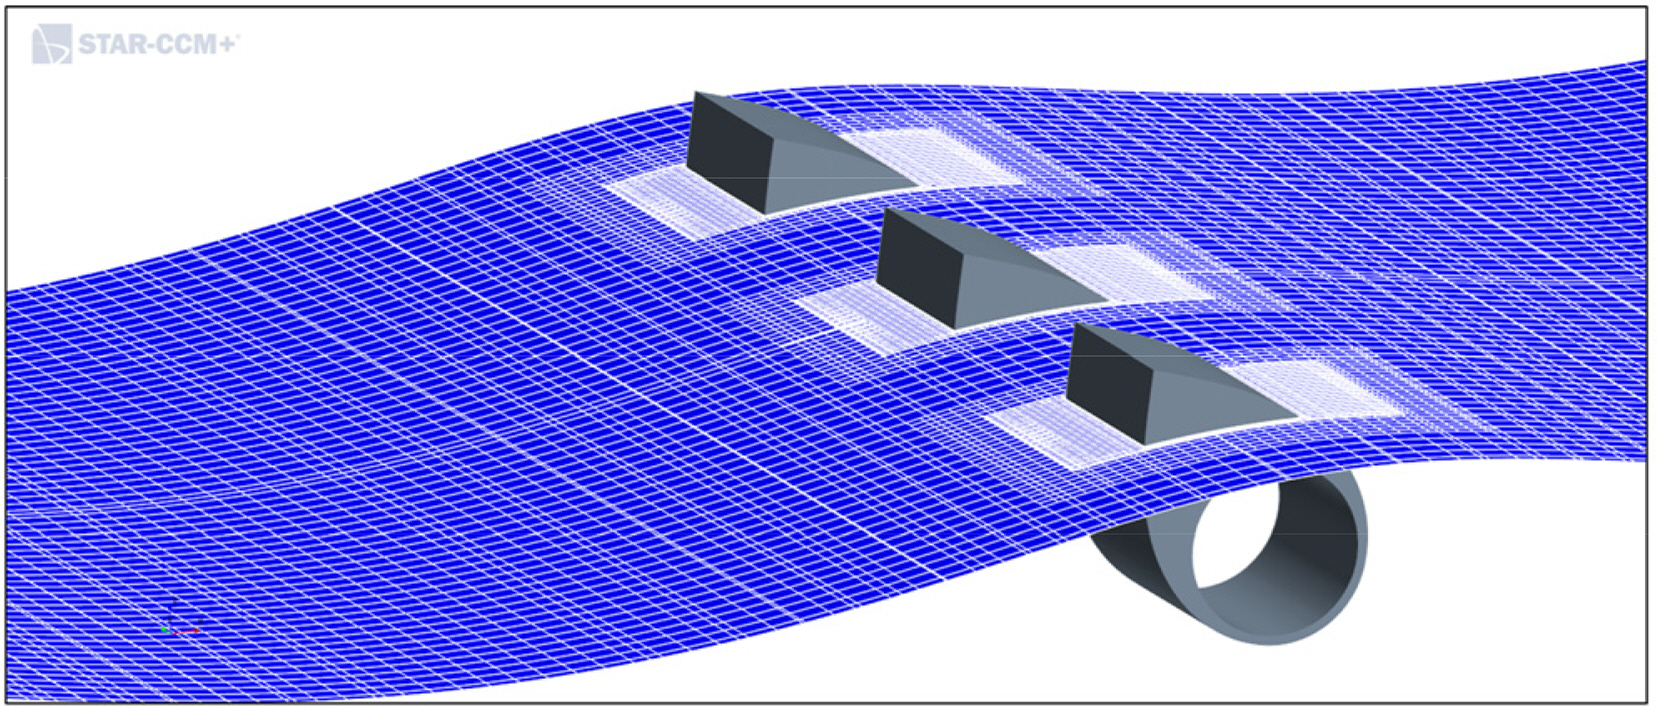
Overset mesh around the rotors
CFD analysis can simulate the nonlinearity of a rotor's motion because it can accommodate the effects of viscosity according to the application of a turbulence model. However, the motion response of an RAO form for which the motion amplitude is normalized to the incident wave height, such as a potential flow, cannot be computed, and motion responses vary depending on the wave height used for the analysis. Therefore, rotor behavior was simulated for the wave height of 1.5 m, which corresponds to the wave height used in the downscaled experiment, and the wave height of 2 m, which was set as the operation conditions of the rotors. The changes in the normalized motion amplitude of a rotor with respect to the changes in the height of regular waves during a CFD analysis can be confirmed in the results of a previous study (Ko et al., 2020).
3. Results and Discussion
3.1 Numerical Analysis Based on Linear Potential Theory
First, the RAO of the arrayed rotors computed by performing a WAMIT multibody analysis was verified. The spacing between the rotors was varied by 0.8, 1, and 1.2 times the rotor width (W = 5 m), and motion response was computed for each case for comparison. The analysis in this study was performed only for head waves whose incident wave angle was 0°, so the response of rotors 1 and 3 was the same because they were symmetrically positioned with respect to the x -axis of incident waves. Therefore, the RAO was illustrated by distinguishing between side and center rotors. The RAO of a single rotor is also illustrated with a solid line to compare the performance when only one rotor is arranged.
The RAO of multiple rotors was compared with respect to the changes in spacing, as shown in Fig. 6. The motion response near the resonance frequency of rotor 2 (center), marked with a red dotted line, decreased far more than the motion response of rotors 1 and 3 (side) regardless of rotor spacing. Rotors 1 and 3, located on the sides, were mostly affected by hydrodynamic interactions through only one surface facing rotor 2 in the center, whereas the surfaces facing outward were less affected by the interactions with a neighboring rotor. Contrarily, rotor 2, located in the center, had neighboring rotors on both sides and thus was greatly affected by interactions; these hydrodynamic interactions had negative effects around the resonance frequency, which resulted in a decrease in motion response. The motion response of all three rotors outside the resonance frequency domain was almost identical under long period incident wave conditions of 0.8 rad/s or below, whereas the response of rotor 2 in the center was almost identical to or slightly smaller than that of the rotors on the sides.
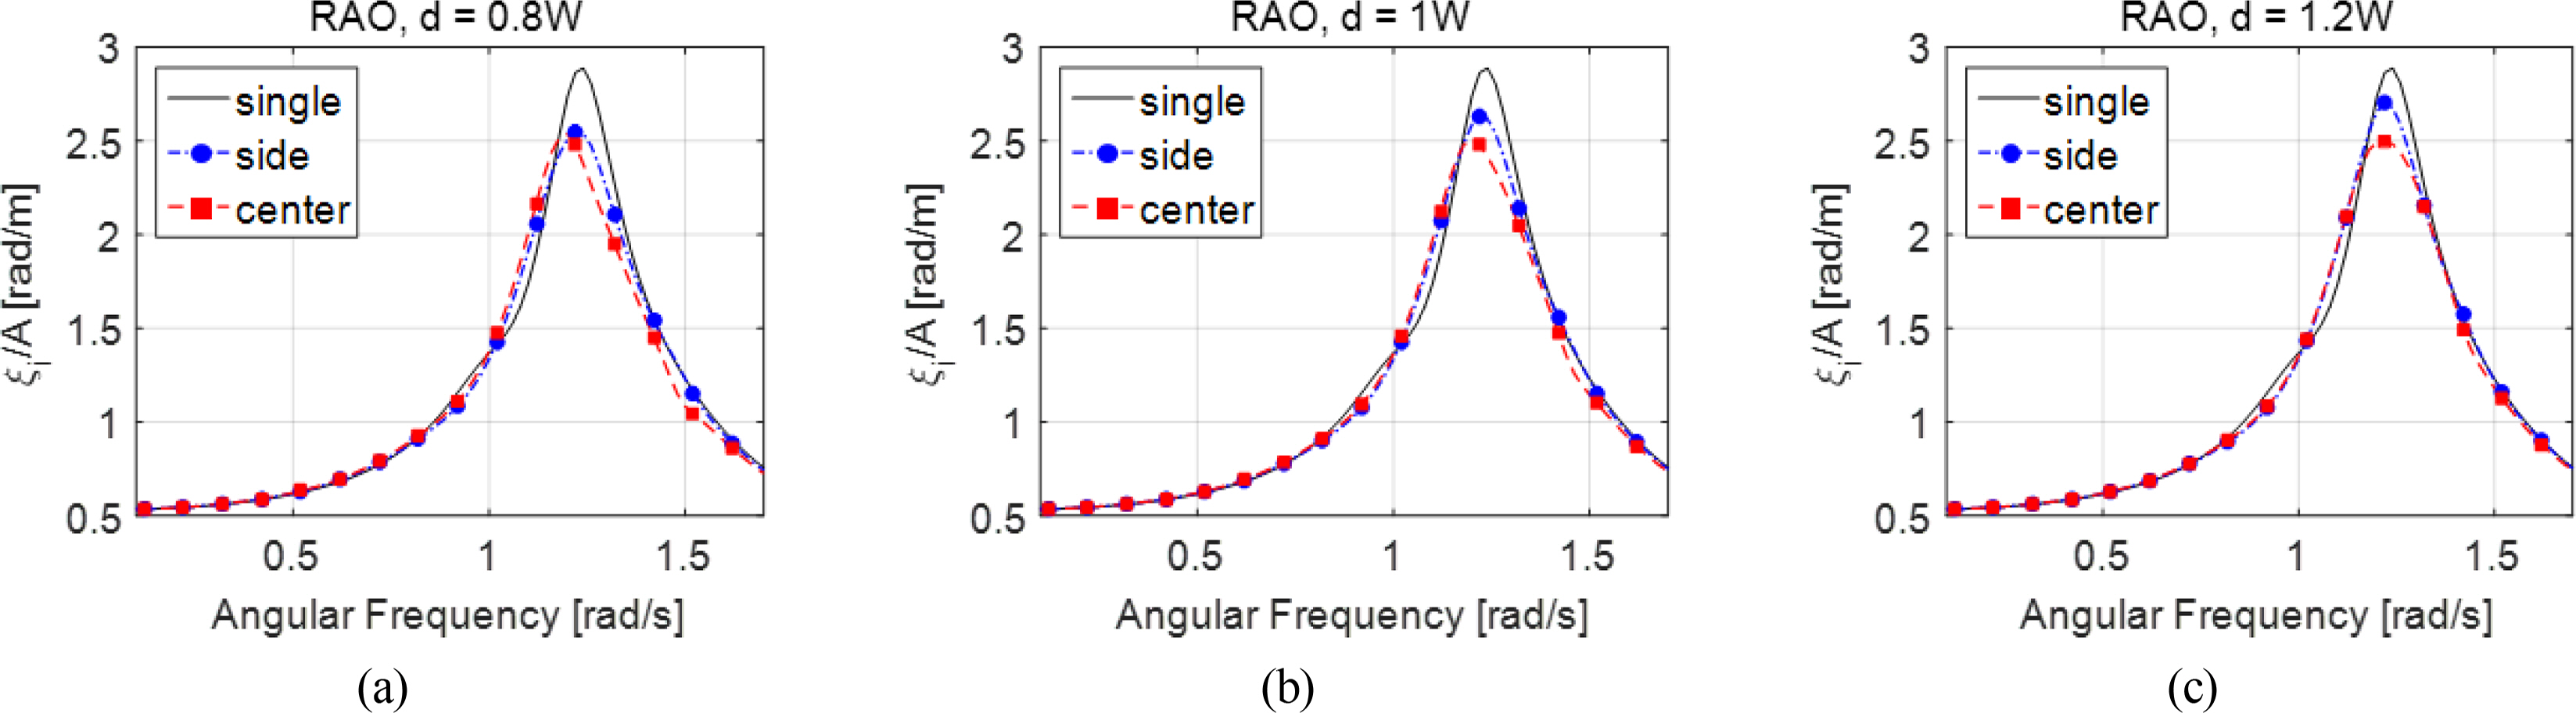
Rotor RAO with respect to spacing
Moreover, as rotor spacing increased from 0.8W to 1.0W to 1.2W, the motion amplitude of the rotors on the sides gradually increased near the resonance frequency, whereas the motion amplitude of the rotor in the center barely improved near the resonance frequency. Fig. 7 shows the radiation damping coefficients according to the changes in rotor spacing. The radiation damping coefficient of the rotors on the sides decreased near the resonance frequency as spacing increases (Fig. 7(a)), whereas the changes in the radiation damping coefficient of the rotor in the center were minimal near the resonance frequency (Fig. 7(b)). Based on the trend of changes in radiation damping coefficients, it can be inferred that the maximum motion amplitude gradually increased as rotor spacing increased only for the rotors on the sides.
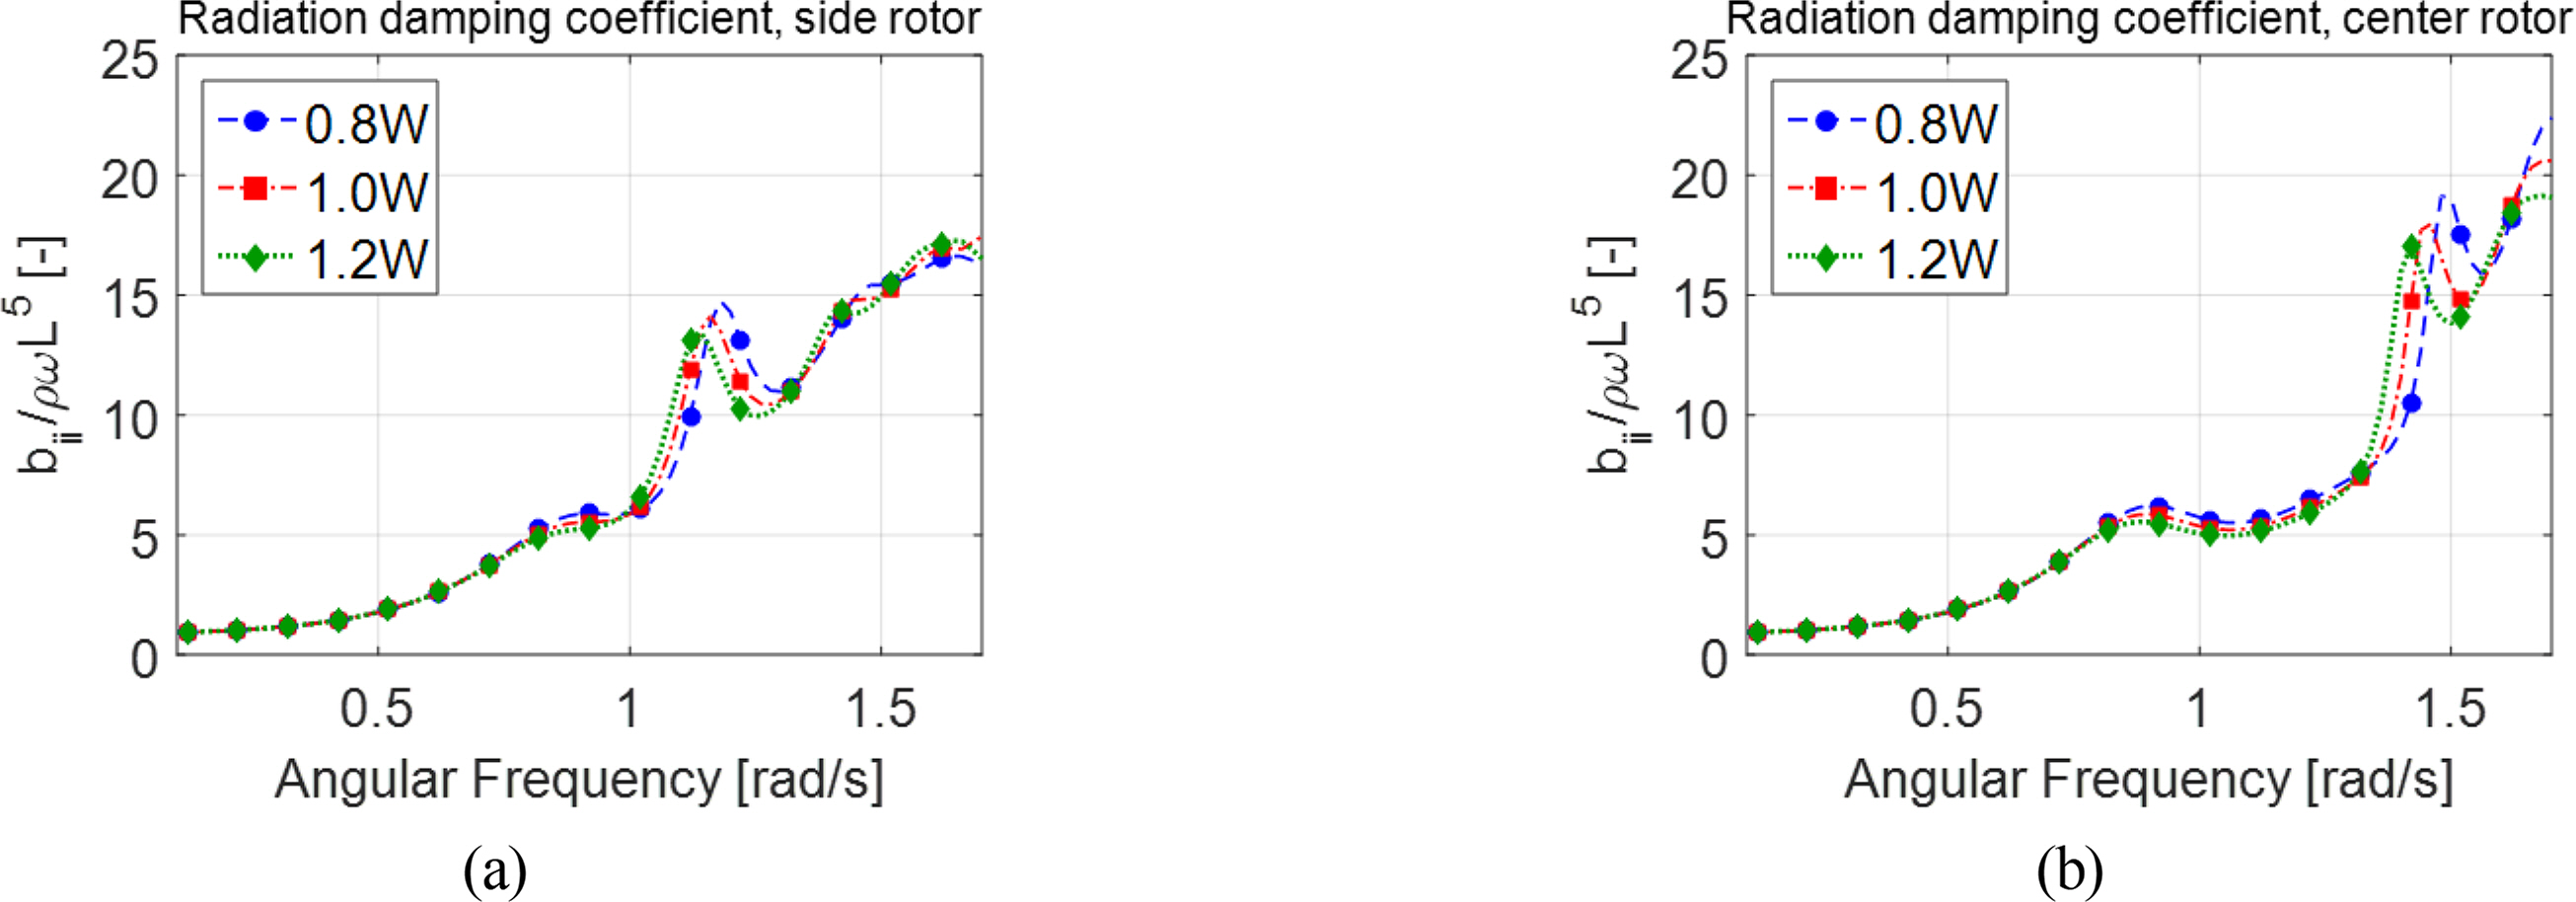
Radiation damping coefficients of the rotors
The RAO of a single rotor as illustrated by a solid line also was compared, as shown in Fig. 6. The RAO of the rotors on the sides approached the RAO of a single rotor near the resonance frequency as the spacing between arrayed rotors increased, whereas no significant changes in the RAO of a single rotor were observed. In this study, the RAO of WEC rotors was compared at zero crossing period TZ = 4.75 s, which is the most frequent wave period occurring in the installation sea area, based on the design strategy of WEC rotors for maximizing the annual power generation time. Hence, the time average of the significant power generation amount, using seasonal wave distributions and the wave spectrum of the installation area, and annual power generation prediction have been separately examined in different studies (Lee et al., 2019). Table 2 presents the RAO values at TZ = 4.75 s of single and multiple arrayed rotors.
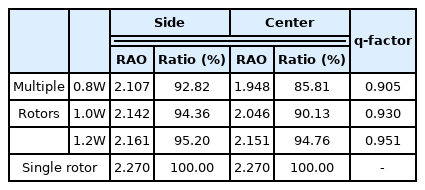
RAO values of single and multiple rotors by potential analysis (TZ = 4.75 s)
As the rotor spacing increased, the RAO values also increased for both center and side rotors. For quantitative comparisons, the ratio (%) of RAO values of multiple rotors according to rotor spacing with respect to the RAO value of a single rotor (100%) is shown in Table 2. The performance of multiple rotors was approximately 85%–95% of the performance of a single rotor in terms of RAO, in which a single rotor outperformed multiple arrayed rotors at TZ = 4.75 s. As shown in Fig. 6, however, the performance of multiple rotors may have been more outstanding than the performance of a single rotor at approximately 1.2 rad/s (T = 5.34 s); the difference in the overall performance in the irregular wave environment must be compared by computing the motion spectrum of a rotor within the wave period range of the relevant waters (Kim et al., 2020). The RAO value of the center rotor was less than that of side rotors, but the rate of increase in RAO with respect to the increase in rotor spacing was greater in the center rotor. The effects of interactions were significantly reduced for the center rotor when the rotor spacing increased because it was influenced by the hydrodynamic interactions of the side rotors. Only one side of the side rotors was affected by hydrodynamic interactions with the center rotor, so the increase in motion of the side rotors was less than that of the center rotor, even when the rotor spacing increased.
The RAO of the center and side rotors with respect to the changes in rotor spacing is shown in Fig. 8. The side rotors in Fig. 8(a) show that the motion response evidently increased near the resonance frequency as the rotor spacing increased, whereas no significant changes in motion response with respect to rotor spacing were observed in the regions other than the resonance frequency. Rotor 2, or the center rotor, in Fig. 8(b) shows that the motion response in the angular frequency range of 1.2–1.4 rad/s increased with increasing rotor spacing, similar to the response trend shown by the side rotors.
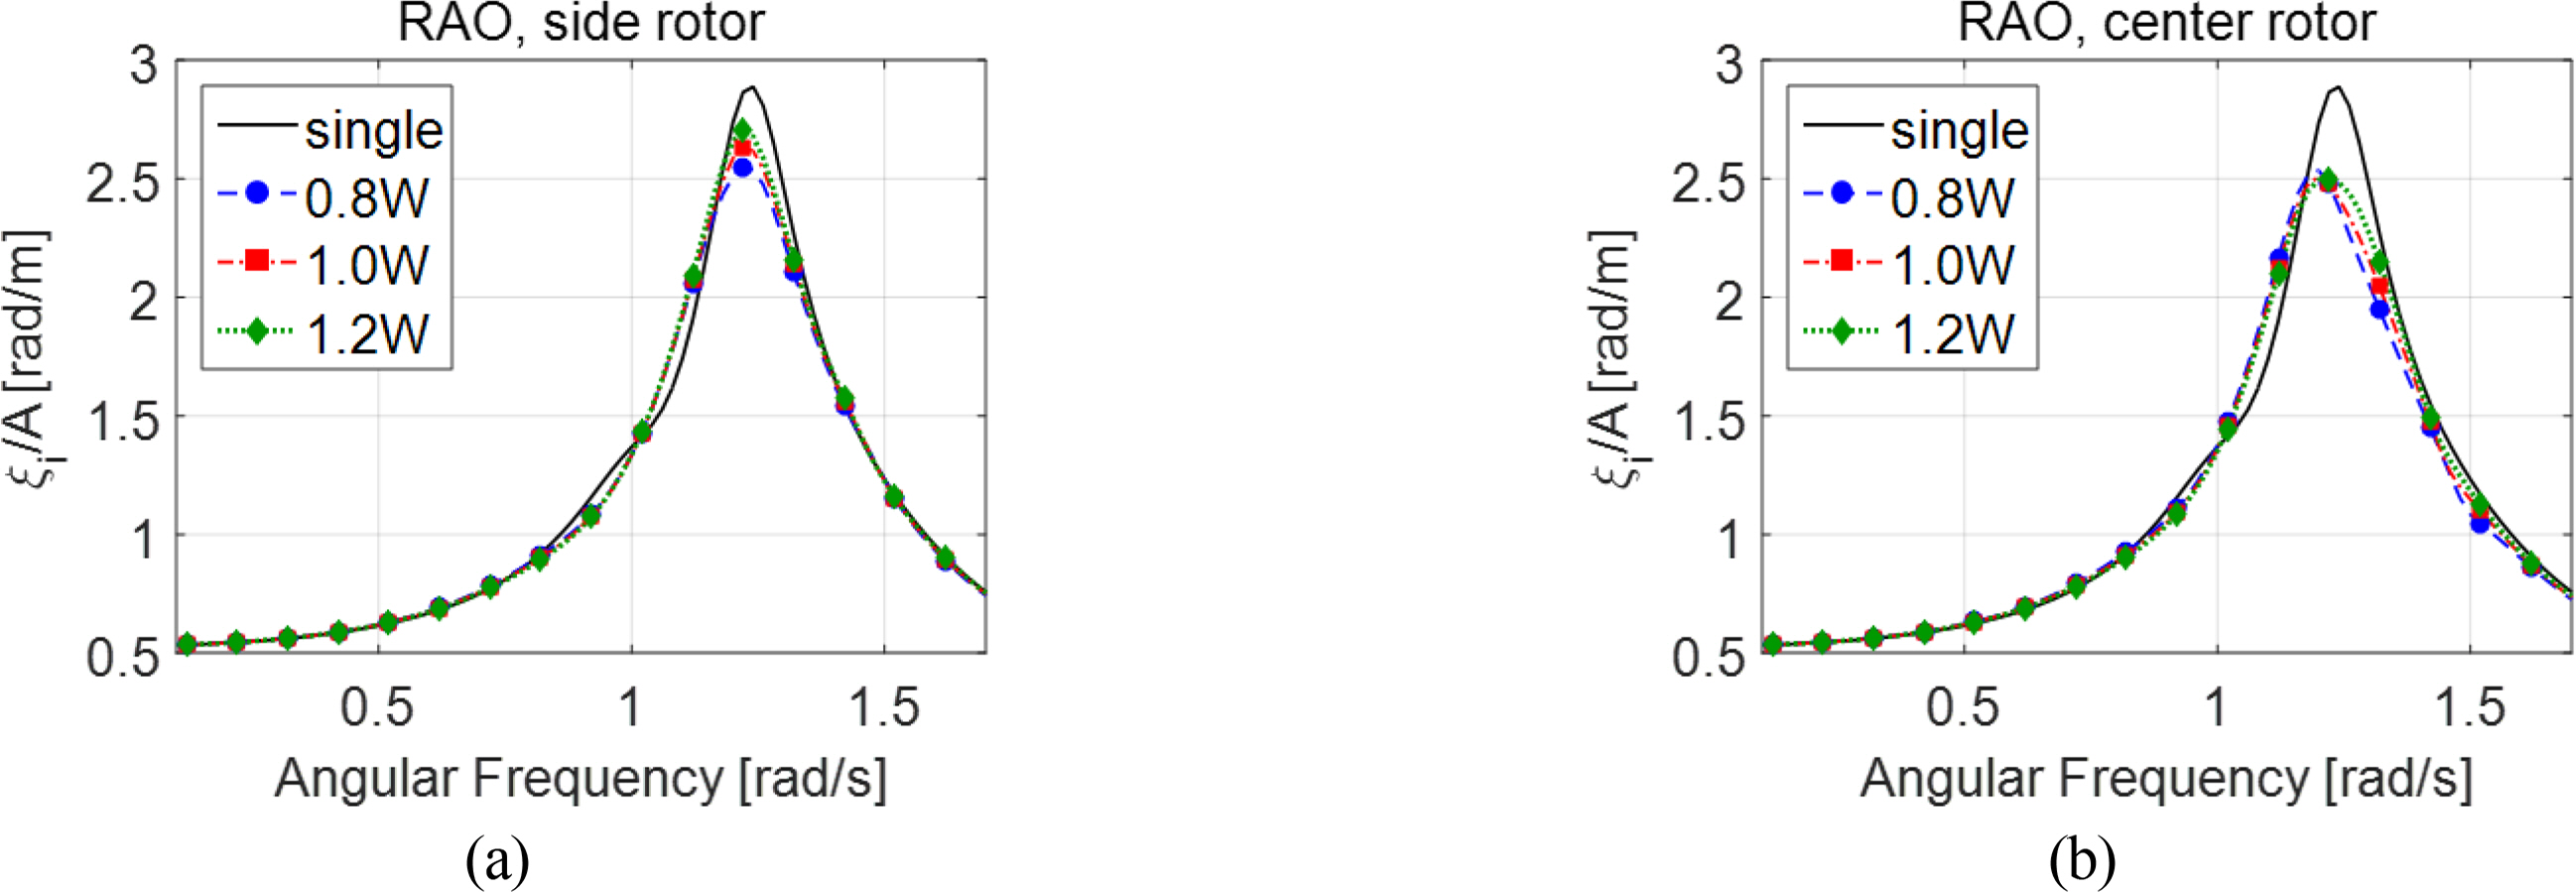
Rotor RAO with respect to location
The interaction effects of arrayed rotors can be quantitatively represented as the ratio of the RAO value of a single rotor multiplied by 3 to the sum of each RAO value of three arrayed rotors, which is referred to as the q-factor. A q-factor greater than 1 indicates that the interactions of arrayed rotors have a positive effect on the rotor motion, whereas a q-factor less than 1 indicates that the motion of arrayed rotors becomes smaller than that of a single rotor owing to hydrodynamic interactions. The q-factor is expressed as a function of the frequency of incident waves, but here it was calculated based on the RAO value at TZ = 4.75 s, as shown in Table 2. All calculated q-factors were less than 1 for three-rotor spacing conditions, which indicates that the three arrayed rotors had slightly reduced motion performance on average compared to a single rotor under the given incident wave conditions. Furthermore, the q-factor approached 1 as the spacing of rotors increased, and the performance of arrayed rotors became similar to that of a single rotor as the spacing sufficiently increased.
3.2 Numerical Analysis Results Based on CFD
According to previous studies on the behavior of WEC rotors, the motion of a rotor has a highly nonlinear nature (Ko et al., 2019; Poguluri et al., 2019a; Poguluri et al., 2019b), which is attributed to the asymmetrical shape of a underwater rotor shape, the nonlinearity of a rotor’s restoring moment, and the effects of nonlinear viscous damping moment. Motion response based on linear potential theory is very similar to the actual motion response of a rotor when the rotational displacement of a rotor is very small (Kim et al., 2019a); however, different motion responses from a linear response nature are exhibited when the rotational displacement increases owing to the increased height of the incident wave. When multiple rotors are arrayed, the rotor behavior pattern becomes more difficult to predict owing to the nonlinear nature and the hydrodynamic interactions with neighboring rotors. Therefore, the behavior of one rotor was simulated using a commercial CFD code to analyze the characteristics of motion in previous studies (Ko et al., 2019; Poguluri et al., 2019a; Poguluri et al., 2019b); a 3D CFD analysis was performed for three arrayed rotors in this study.
Fig. 9(a) and (b) show the changes in the height of 1.5-m regular waves in the simulation of a single rotor and three rotors arranged in a numerical wave tank.

Wave elevation along the numerical wave tank
Fig. 9(a) shows the pattern at 57 s of a simulation, and Fig. 9(b) shows the pattern at 57.5 s of a simulation. Irregular flows around the rotors can be observed from the pattern of wave height; in particular, the effects of radiated waves caused by the rotor motion are present at the front of the rotors, and the effects of both radiated waves and diffracted waves are present in the back of the rotors.
Fig. 10 shows the rotational displacement and angular velocity of a rotor at a wave height of 1.5 m in time series. Only the spacing of 1.0 W is indicated when the three rotors are arranged. When the incident waves are regular waves, the rotational displacement and angular velocity of a single rotor and multiple rotors do not vary considerably. To quantitatively compare the rotors’ motion, RAO values at TZ = 4.75 s were compared as shown in Tables 3 and 4 to correspond to the analysis based on linear potential theory. Table 3 shows the results of calculating the RAO at a wave height of 1.5 m, and Table 4 shows the simulation results at a wave height of 2 m.
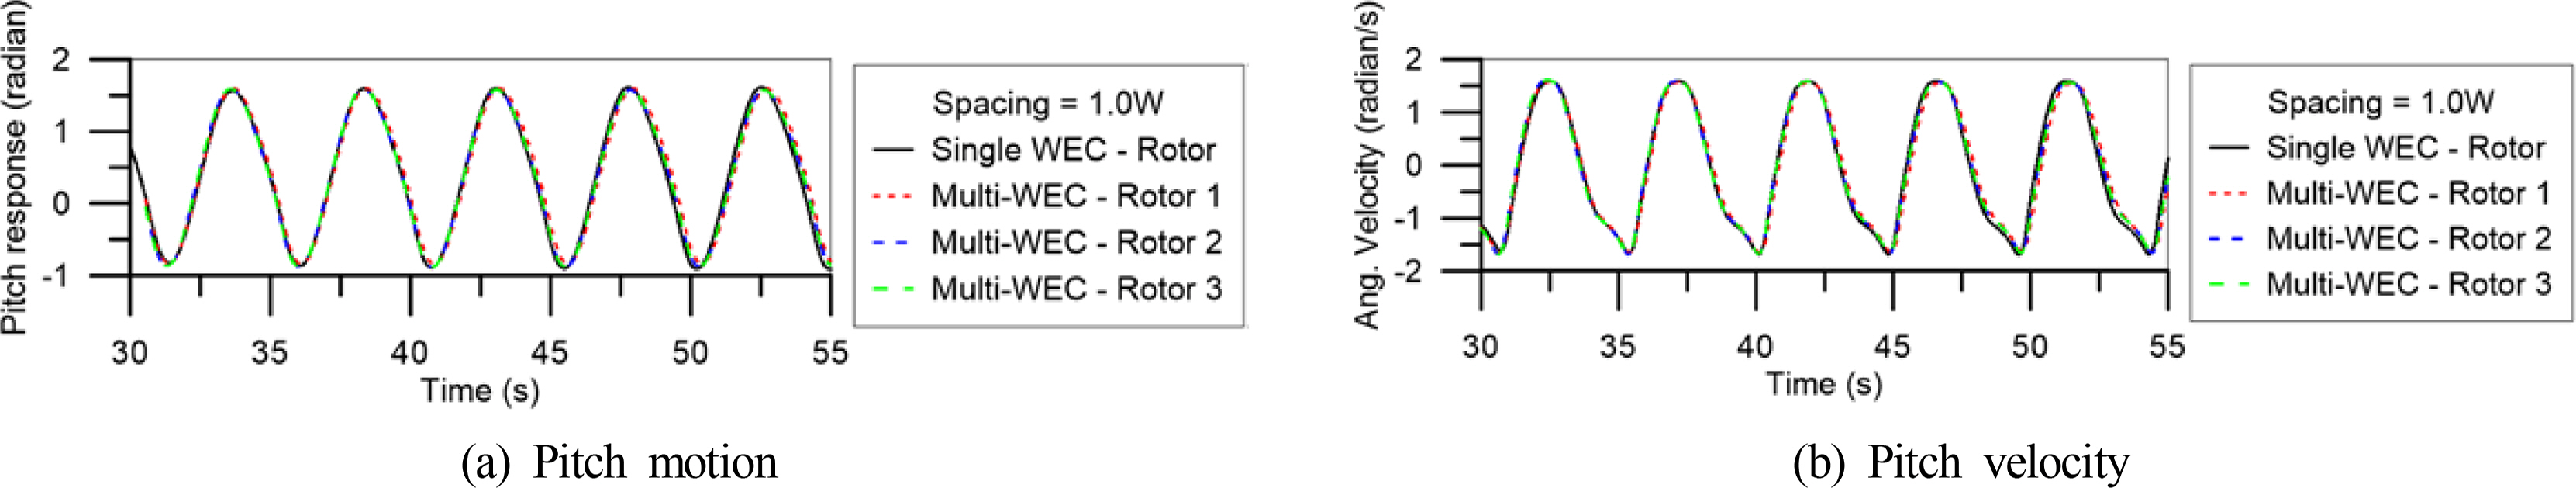
Time series of the pitch response with 1.5-m wave height
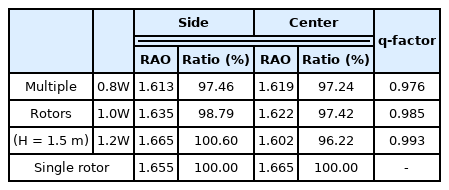
RAO values of single and multiple rotors by CFD analysis (H = 1.5 m)

RAO values of single and multiple rotors by CFD analysis (H = 2.0 m)
The RAO values of side rotors tended to increase with increasing rotor spacing, which corresponds to the linear potential analysis result in Table 2. In the case of the center rotor, however, the RAO value increased when rotor spacing increased from 0.8W to 1.0W but slightly decreased when rotor spacing further increased to 1.2W. Compared to the simulation of a single rotor at a wave height of 1.5 m, the response of the side rotors becomes similar to that of a single rotor as the rotor spacing increases, in which the RAO slightly increases farther than a single rotor at a rotor spacing of 1.2W. The RAO of the center rotor was 96%–97% of that of a single rotor. The q-factor ranged from 0.976 to 0.993 as the rotor spacing increased; the interactions of the arrayed rotors had a fairly negative effect, with q-factor values less than 1, similar to the linear potential analysis results in Table 2. However, the q-factor values were closer to 1 overall compared to those of linear potential analysis, which signifies that the difference in the performance between a single rotor and arrayed rotors based on the CFD analysis is not greater than that of the linear potential analysis.
Fig. 11 shows the rotational displacement and angular velocity of a rotor at a wave height of 2.0 m in time series. The nonlinearity of the rotors’ motion increased substantially as the height of incident waves increased to 2 m. The motion response of the rotors gradually showed the incident wave frequency component and additional harmonic frequency terms. Consequently, the response of the incident wave frequency component, which was most dominant, decreased as shown in Table 4.

Time series of the pitch response with 2.0-m wave height
The motion amplitude decreased as the wave height increased, but the increase in RAO with respect to the increase in rotor spacing was identical to the pattern shown for the wave height of 1.5 m. In addition, the RAO slightly decreased as the rotor spacing increased from 1.0W to 1.2W for the center rotor. In terms of the motion response pattern, the side rotors have approximately 95%–98% and the center rotor has 98%–100% of the motion amplitude of a single rotor. According to the results of the potential analysis and CFD analysis at the wave height of 1.5 m, the motion amplitude of a single rotor was closer to that of the side rotor than the center rotor. In the CFD analysis results at the wave height of 2 m, on the other hand, the motion amplitude of a single rotor was closer to the center rotor because of an increase in the nonlinearity of a rotor’s motion from the increased amplitude of incident waves. The q-factor ranged from 0.968 to 0.988. Excluding the spacing of 1.0 W, similar results to that of the CFD analysis at the wave height of 1.5 m were produced, in which the interaction effects of arrayed rotors had a negative influence on the motion performance of the rotor.
The RAO of the center rotor decreased slightly when the rotor spacing increased from 1.0W to 1.2W at wave heights of both 1.5 m and 2 m owing to slamming and large impact pressure forces on rotor 2 caused by a rigorous mixing of the flow resulting from violent liquid motions along the cylindrical passage of the rotor. The violent liquid motions were barely observed when the rotor spacing was 0.8W or 1.0 W, but they became observable at the rotor spacing of 1.2W because the flow was more active in the lateral direction. In order to examine this phenomenon, the velocity of the fluid particle on the free surface at the rotor spacing of 1.2W is shown in Fig. 12.
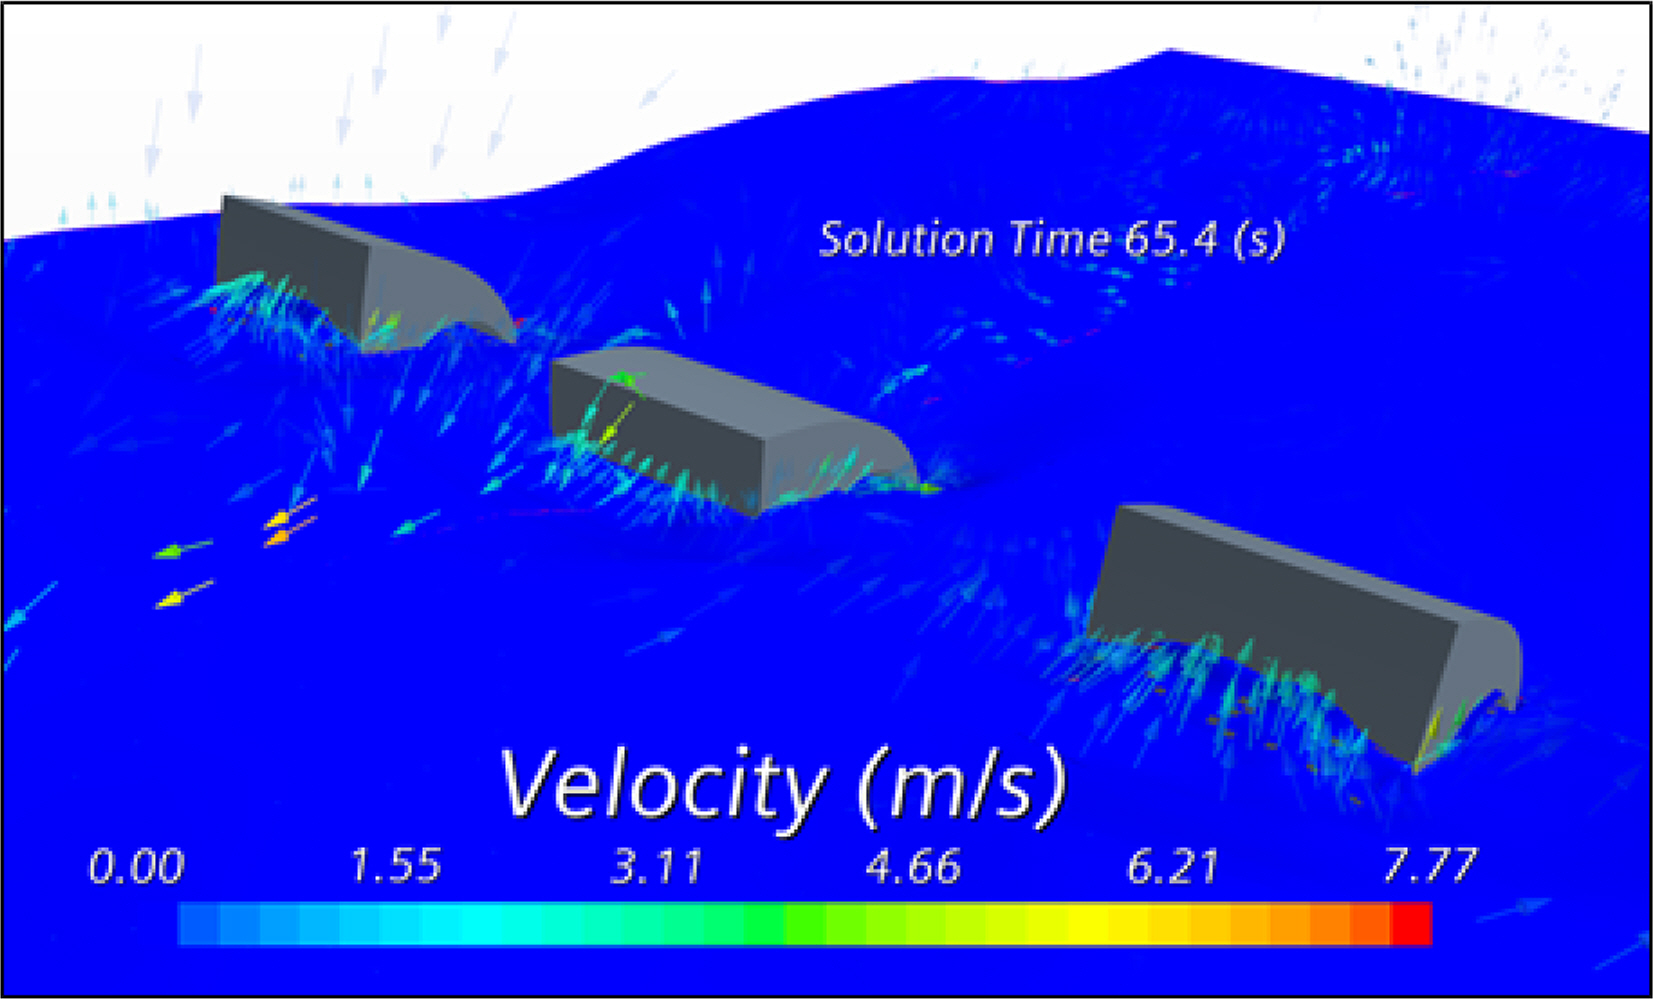
Velocity magnitude of the multiple rotors with 1.2W spacing at TZ = 4.75s
As shown Fig. 12, a great number of flow velocity vectors were generated around the cylindrical passage of the center rotor, whereas no flow was observed around the side rotors. Violent fluid flow occurring in the cylindrical hole of the center rotor is a physical phenomenon that is difficult to obtain in a potential analysis and can be observed only in a CFD analysis or a scaled model test. A lateral flow interferes with a rotor’s motion but also accelerates motion depending on the period of incident waves. The motion performance of arrayed rotors according to the effects of a flow passing through a cylindrical passage will be examined further in a separate study.
4. Conclusion
This study aimed to examine the linear potential theory and a CFD analysis to comparatively analyze the motion performance of individual rotors and thus identify the characteristics of motion performance of multiple arrayed WEC rotors. The changes in motion response of multiple arrayed rotors were observed with respect to the position by adjusting the rotor spacing to 0.8, 1, and 1.2 times the width of the rotor. The rotational motion response of the rotor positioned in the center decreased farther than that of the rotor positioned on the sides in a frequency domain analysis based on linear potential theory. Furthermore, the responses of all three rotors increased as the rotor spacing increased. However, the ratio of an increase in the motion response of a rotor with respect to an increase in rotor spacing was greater in the center rotor than in the side rotors because the center rotor was influenced more significantly by the interactions with adjacent rotors. When multiple rotors were arranged, the motion performance of individual rotor could be adjusted through the optimal arrangement of rotors, and the overall performance of the arranged rotors could be determined by considering the arrangement spacing and incident wave period.
The asymmetrical WEC rotors used in this study had large rotational displacement and nonlinearity in motion; thus, analyzing their motion response based only on linear potential theory was subject to limitations. A CFD analysis was thus conducted to examine the difference in performance based on a nonlinear nature of motions, and the analysis results showed that the trend of motion response was similar to that of linear potential theory. When the rotor spacing was increased to 1.2 times the rotor width, however, the motion of the center rotor decreased slightly, which was judged to be due to the generation of lateral flow from the increased rotor spacing, thus resulting in intense fluid flow inside a cylindrical passage of a rotor. This lateral flow phenomenon cannot be observed in linear potential analysis, which necessitates a CFD analysis. At the incident wave period of TZ = 4.75 s applied in this study, the motion of the center rotor decreased owing to a lateral flow but also may increase if the period of the incident wave changes; therefore, a further study is needed to conduct a multibody CFD analysis of the entire rotors in addition to motion analysis of various incident wave periods. The q-factor was calculated to examine the effects of hydrodynamic interactions based on rotor arrangements; at the incident wave period of TZ = 4.75 s used in this study, the q-factors deduced from the linear potential and CFD analyses were less than 1, which indicated that the interactions had a negative influence on the motion performance of the rotors. The q-factor can vary depending on the period of incident waves, so a comprehensive review in multiple frequency ranges must be conducted based on the wave spectrum of the installation site. In conclusion, the motion performance of individual rotors varied slightly depending on the spacing between rotors, but the changes were insignificant, and no major difference in the motion performance between a single rotor and arrayed rotors has been reported. Therefore, wave energy can be efficiently absorbed without a considerable loss of motion performance of rotors when a WEC system is operated in which multiple rotors are arranged or when a previously installed WEC is expanded by arranging additional rotors.
Acknowledgements
This work was performed during the author’s research year at Jeju National University in 2018.