Evaluation on Sensitivity and Approximate Modeling of Fire-Resistance Performance for A60 Class Deck Penetration Piece Using Heat-Transfer Analysis and Fire Test
Article information

Abstract
The A60 class deck penetration piece is a fire-resistance apparatus installed on the deck compartment to protect lives and to prevent flame diffusion in the case of a fire accident in a ship or offshore plant. In this study, the sensitivity of the fire-resistance performance and approximation characteristics for the A60 class penetration piece was evaluated by conducting a transient heat-transfer analysis and fire test. The transient heat-transfer analysis was conducted to evaluate the fire-resistance design of the A60 class deck penetration piece, and the analysis results were verified via the fire test. The penetration-piece length, diameter, material type, and insulation density were used as the design factors (DFs), and the output responses were the weight, temperature, cost, and productivity. The quantitative effects of each DF on the output responses were evaluated using the design-of-experiments method. Additionally, an optimum design case was identified to minimize the weight of the A60 class deck penetration piece while satisfying the allowable limits of the output responses. According to the design-of-experiments results, various approximate models, e.g., a Kriging model, the response surface method, and a radial basis function-based neural network (RBFN), were generated. The design-of-experiments results were verified by the approximation results. It was concluded that among the approximate models, the RBFN was able to explore the design space of the A60 class deck penetration piece with the highest accuracy.
1. Introduction
A fire that occurs in a ship or offshore plant can result in large-scale structural damage and loss of lives owing to the flame spread. Thus, the International Maritime Organization (IMO) is strengthening the fire-prevention regulations for the major sections of ships and offshore plants. With regard to A60 class fire-prevention equipment, the fire-prevention design regulated by Safety of Life at Sea (SOLAS) should be applied to prevent the flame spread in the section where the corresponding equipment is installed for 60 min (IMO, 2010). The A60 class deck penetration piece (A60 DPP) is fire-prevention equipment applied in the case where the cable for control or communication must penetrate the horizontal structure of the section, introducing a high risk of fire. The IMO requires the verification the fire-prevention performance of the A60 DPP according to the fire test procedure (FTP) regulations (MSC, 2010).
Research on evaluating the fire-prevention performance of ships and offshore plants has only been partially conducted. Yu et al. (2000) proposed electric arc furnace test and tank test methods for the evaluation of the fire-prevention performance of oil boom material types. Choi et al. (2013) conducted the fire-prevention performance test by adjusting the fireproof material conditions of the fire damper blade and coaming to satisfy the H-120 fire-prevention performance of the H-120 class fire damper. Choi et al. (2014) conducted a fire-prevention test considering the manufacturing conditions of various composite materials to assess the fire-prevention performance for fiberglass-reinforced plastic ship materials. Jang et al. (2014) performed thermal analysis on the fire-prevention design items of the H-120 class fire damper and conducted a fire-prevention test by changing the fire-prevention design conditions. Song and Kim (2020) verified the design items of the A0 class bulkhead penetration pipe applied to vertical structures of a ship through a heat-transfer analysis and fire prevention test.
In this study, the approximation characteristics of the design space were evaluated via a sensitivity analysis of the fire-prevention performance of the A60 DPP used for a ship and offshore plant, a fire-prevention design sensitivity analysis based on the design of experiments to minimize the weight, and various approximate models. By applying statistical methods such as design of experiments to the design process of the fire-prevention system, such as the newly developed A60 DPP, the design space was explored effectively, and the optimum design plan was easily deduced. For the evaluation of the fire-prevention performance of the A60 DPP, a transient heat-transfer analysis based on the finite-element method (FEM) was performed by reflecting the specimen specifications and temperature conditions on the FTP regulation code. A fire test was conducted for verifying the transient heat-transfer analysis results, in accordance with the FTP regulation code of the Maritime Safety Committee. The verified finite-element model and transient heat-transfer analysis results were linked with the design of experiments. For the design factors (DFs), the length of the A60 DPP, diameter, material type, and insulation density were used, and for the output responses, the weight, temperature, price, and productivity were individually applied. In the sensitivity analysis, the effect of each DF on the output response was quantitatively assessed using the design-of-experiments results, and the optimum design combinations to minimize the weight while satisfying the tolerance limit of the output response, such as the temperature, price, and productivity, were identified. On the basis of the design-of-experiments results, various approximate models, e.g., a Kriging model, the response surface method (RSM), and a radial basis function-based neural network (RBFN), were produced. The design-of-experiments results were verified by analyzing the accuracy of each approximate model to approximate the design space of the A60 DPP. The results indicated that the RBFN could approximate the A60 DPP design space with the highest accuracy. The design items and fire-prevention performance evaluation regulations of the A60 DPP, transient heat-transfer analysis results, and fire-test verification results are presented in Chapter 2, the design-of-experiments and sensitivity-analysis results are presented in Chapter 3, and the theory for the approximate models and approximation characteristics is reviewed in Chapter 4. The conclusions are presented at the end of the paper.
2. Evaluation of Fire-Prevention Performance
2.1 Fire-prevention Design and Performance Evaluation Regulations for A60 DPP
The A60 DPP applied to ships and offshore plants is fire-prevention equipment used for the maintenance of confidentiality in the case of a deck fire, along with the safe operation of cables penetrating the deck for control and communication. The objective of this study was to evaluate the fire-prevention performance of the newly developed A60 DPP by reducing the body length and applying insulating refractory materials for improving the productivity and quality. The design configuration of the A60 DPP investigated in this study is presented in Fig. 1.
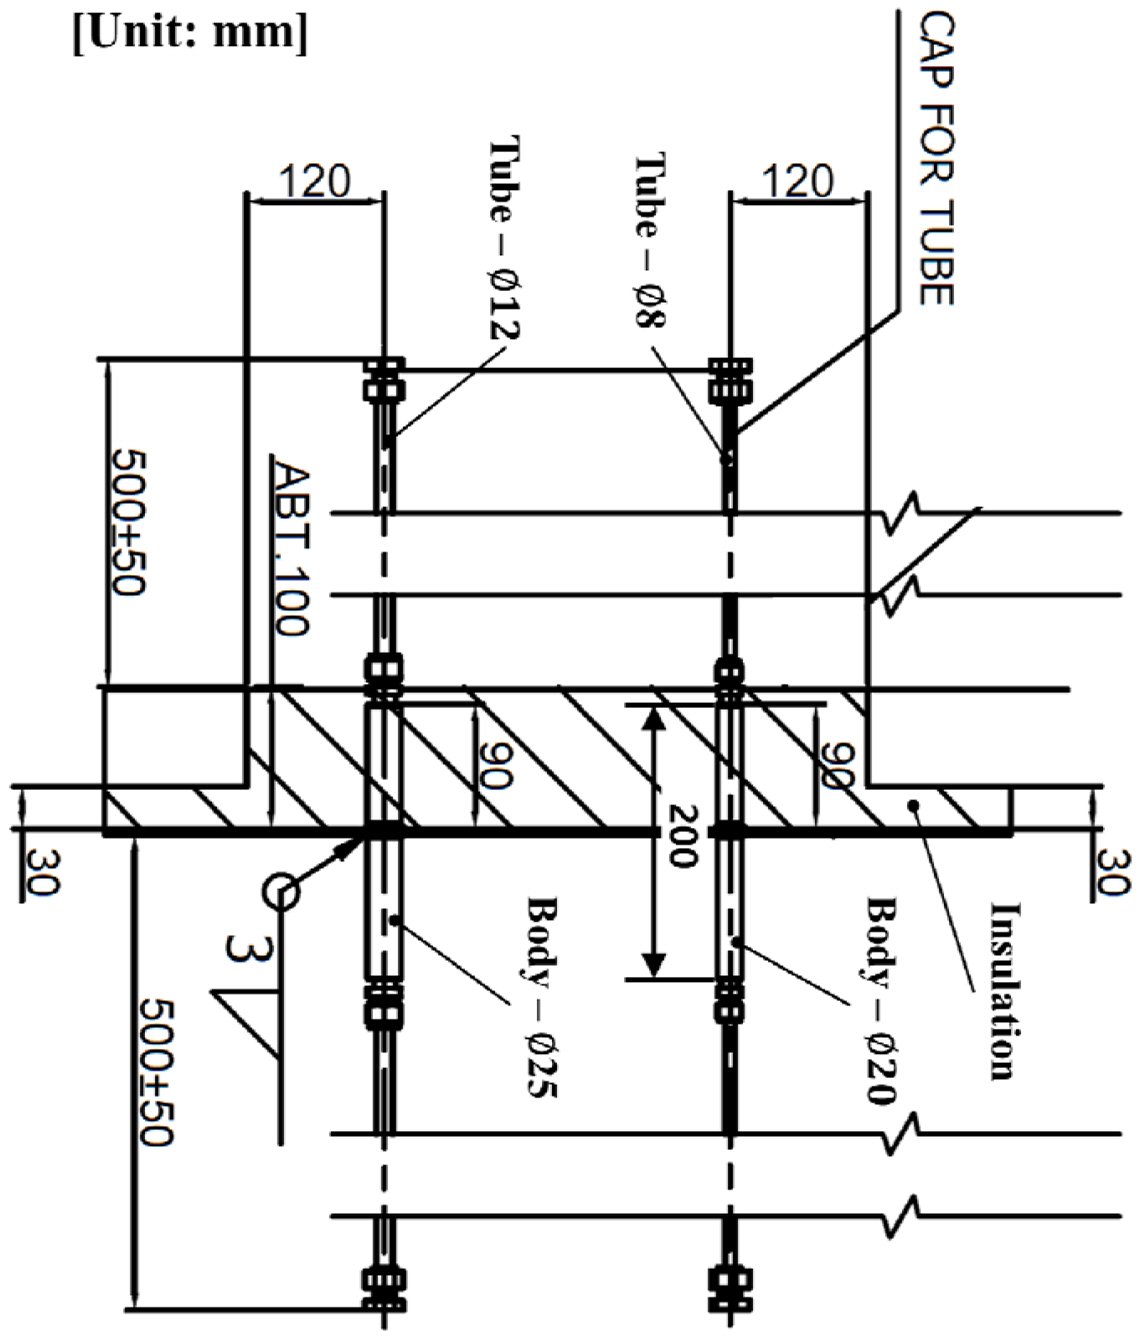
Design specifications of the A60 DPP
As shown in Fig. 1, the length of the penetration pipe body was designed to be 200 mm, the diameter of the tube was designed to be ∅8 and ∅12 mm, and the diameter of the body was designed to be ∅20 and ∅25 mm. The insulation was attached 90 mm lean to one side from the center of the penetration pipe. Regarding the materials of the penetration pipe, the specifications for the carbon steel for machine structural use (S45C) and austenitic stainless steel (SUS316L) were separately applied.
The A60 DPP should be designed to make the temperature measured at the other side of the inflamed side <180 °C under the flame heating conditions set for 60 min. Fig. 2 shows the configuration of the specimen for the fire test (structure steel core) based on the FTP code.
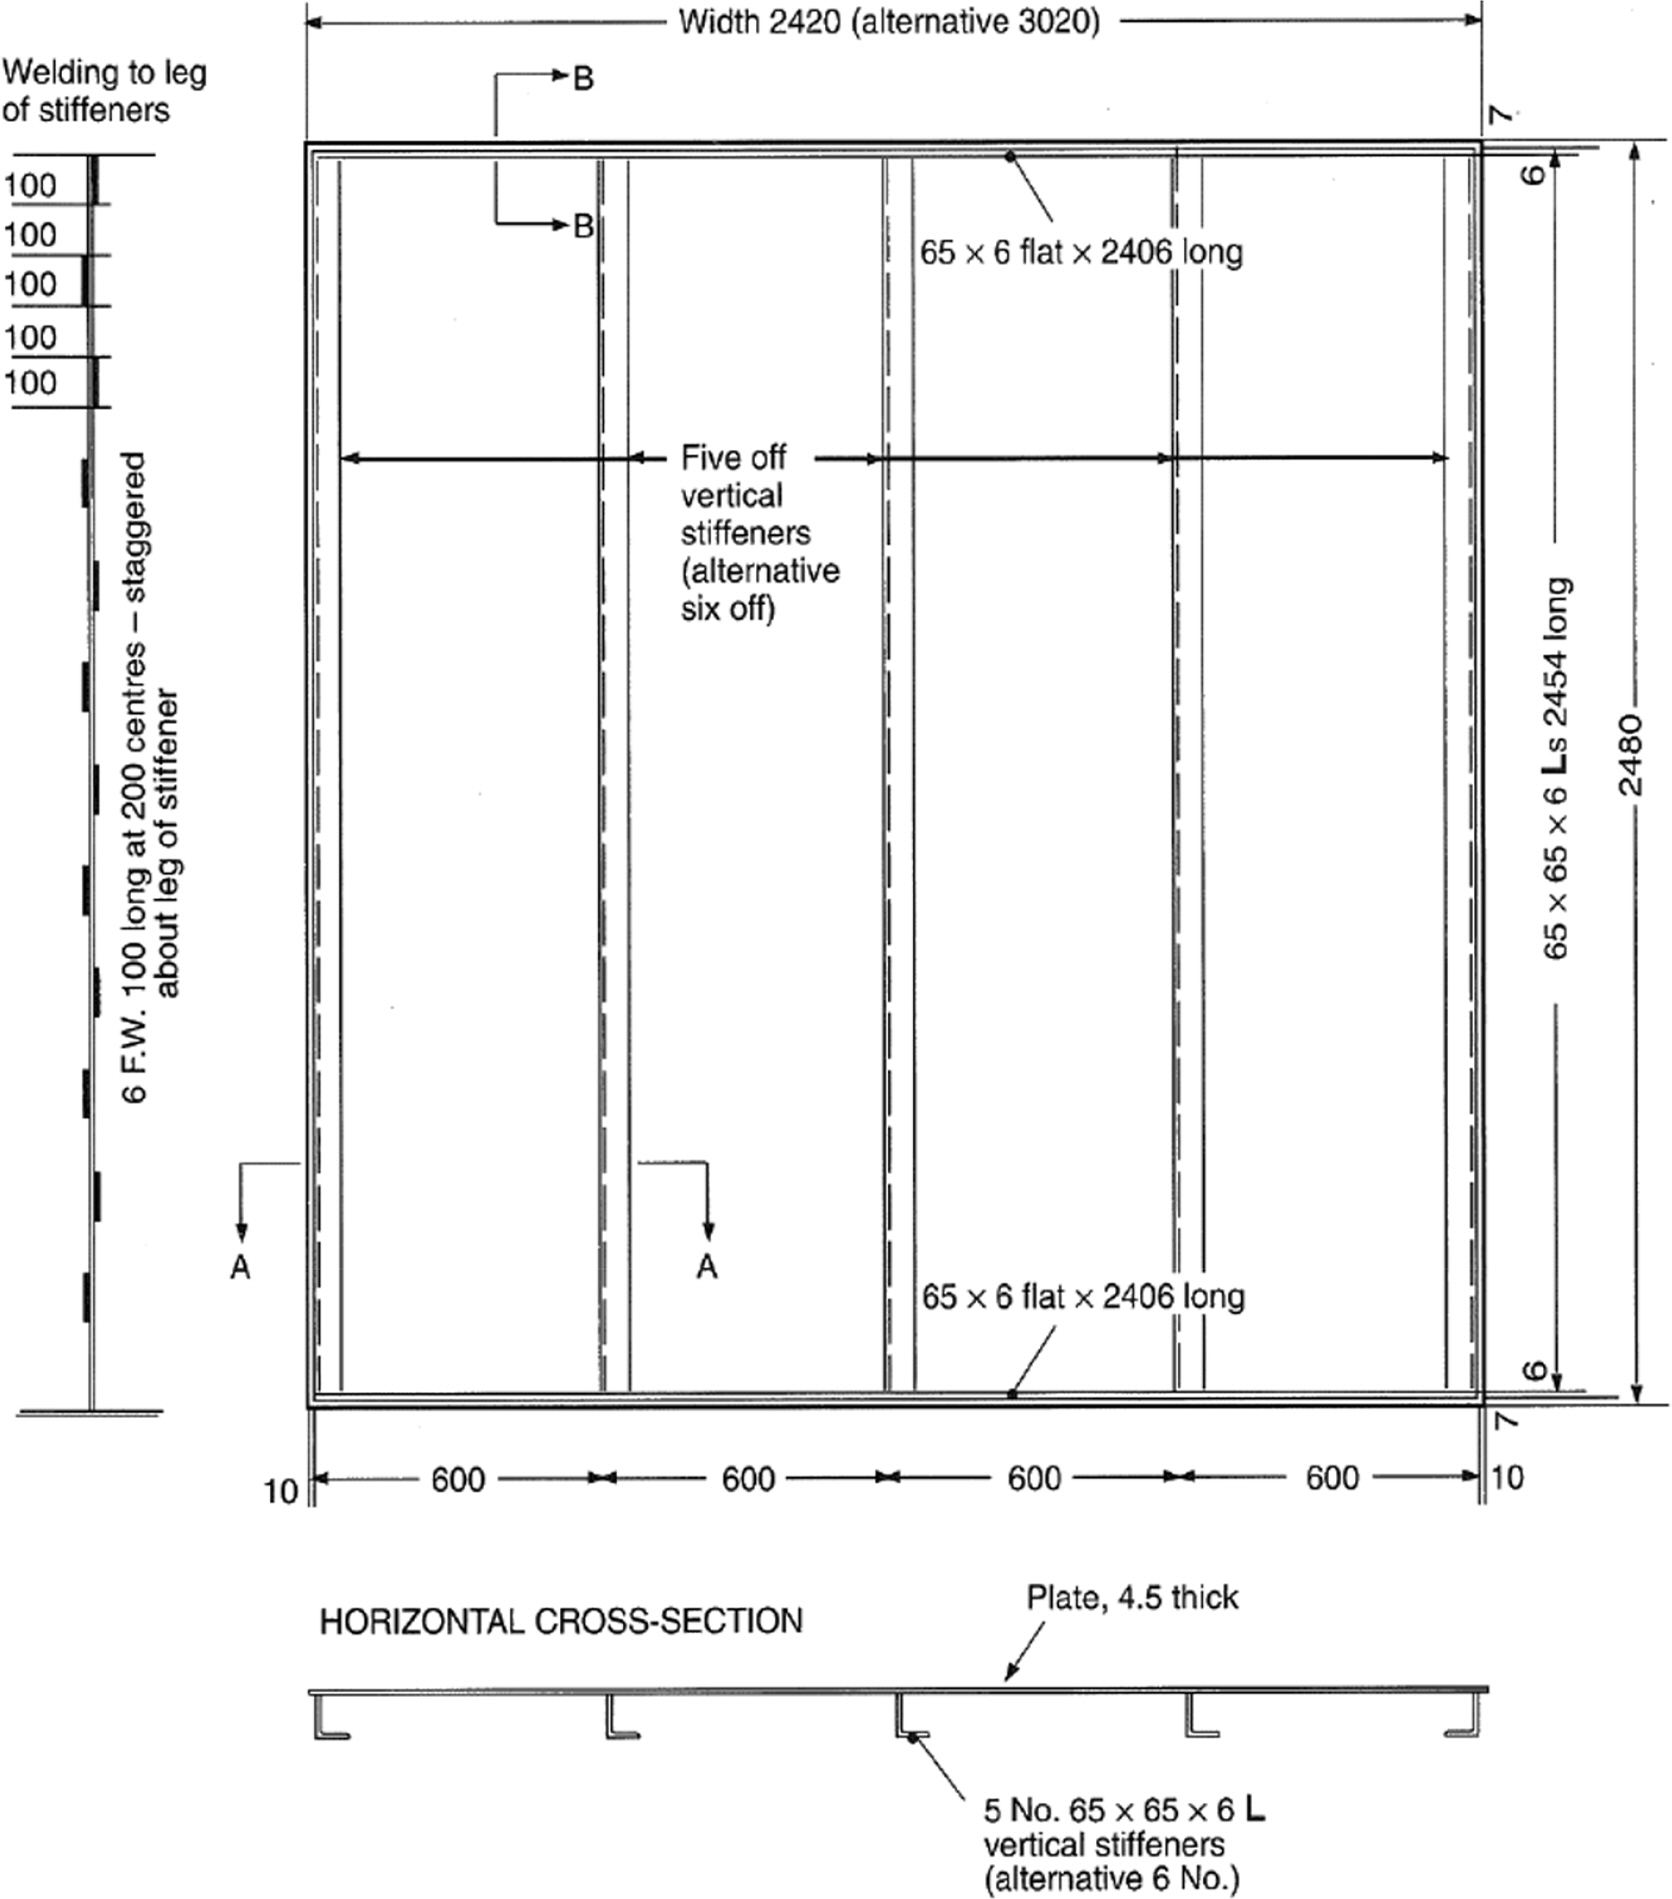
As shown in Fig. 2, the specimen for the fire test for the A60 DPP must be made of steel, and the L-type reinforcement with dimensions of (65±5)×(65±5)×(6±1) mm should be arranged with intervals of 600 mm on a slab with a width of 2,440 mm, length of 2,500 mm, and depth of 4.5 ± 0.5 mm. The fire-prevention performance of the A60 DPP should be verified through the fire test, where it is attached with insulation between L-type stiffeners of the specimen shown in Fig. 2. For the fire-test specimen with the A60 DPP and insulation attached, the insulation should be placed on the flamed side for the evaluation, identical to the installation status of an actual ship and offshore plant. It should be installed horizontally to the furnace and heated to 940 °C for 60 min.
2.2 Transient Heat-Transfer Analysis and Fire Test
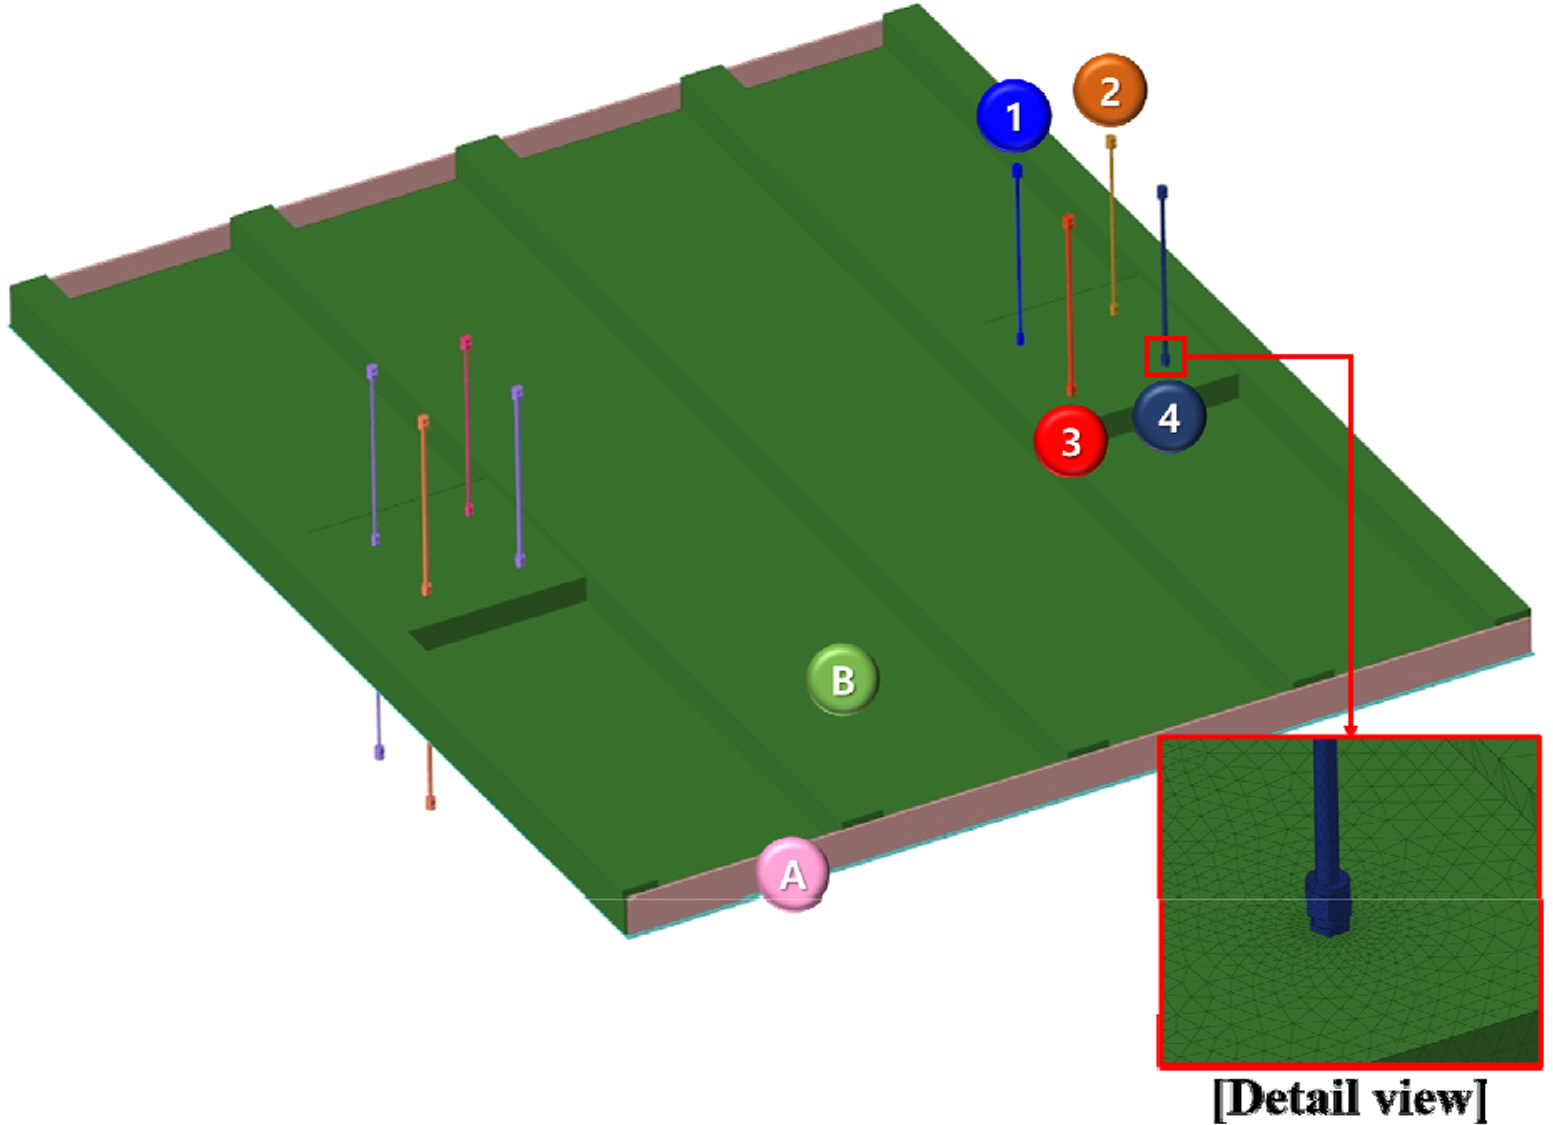
A transient heat-transfer analysis was conducted using the general-purpose FEM software ABAQUS/Implicit (Simulia, 2019). The transient heat-transfer analysis model, which was generated on the basis of the A60 DPP design configuration shown in Fig. 1 and the fire-test specimen presented in Fig. 2, is displayed in Fig. 3. The detailed specifications of this analysis model are presented in Table 1. The finite-element model applied to the transient heat-transfer analysis comprised 1,352,236 elements and 323,738 nodal points, and for the finite element, a tetrahedral heat-transfer element (DC3D4) was utilized.
Transient heat-transfer analysis model

Specifications of the analysis model
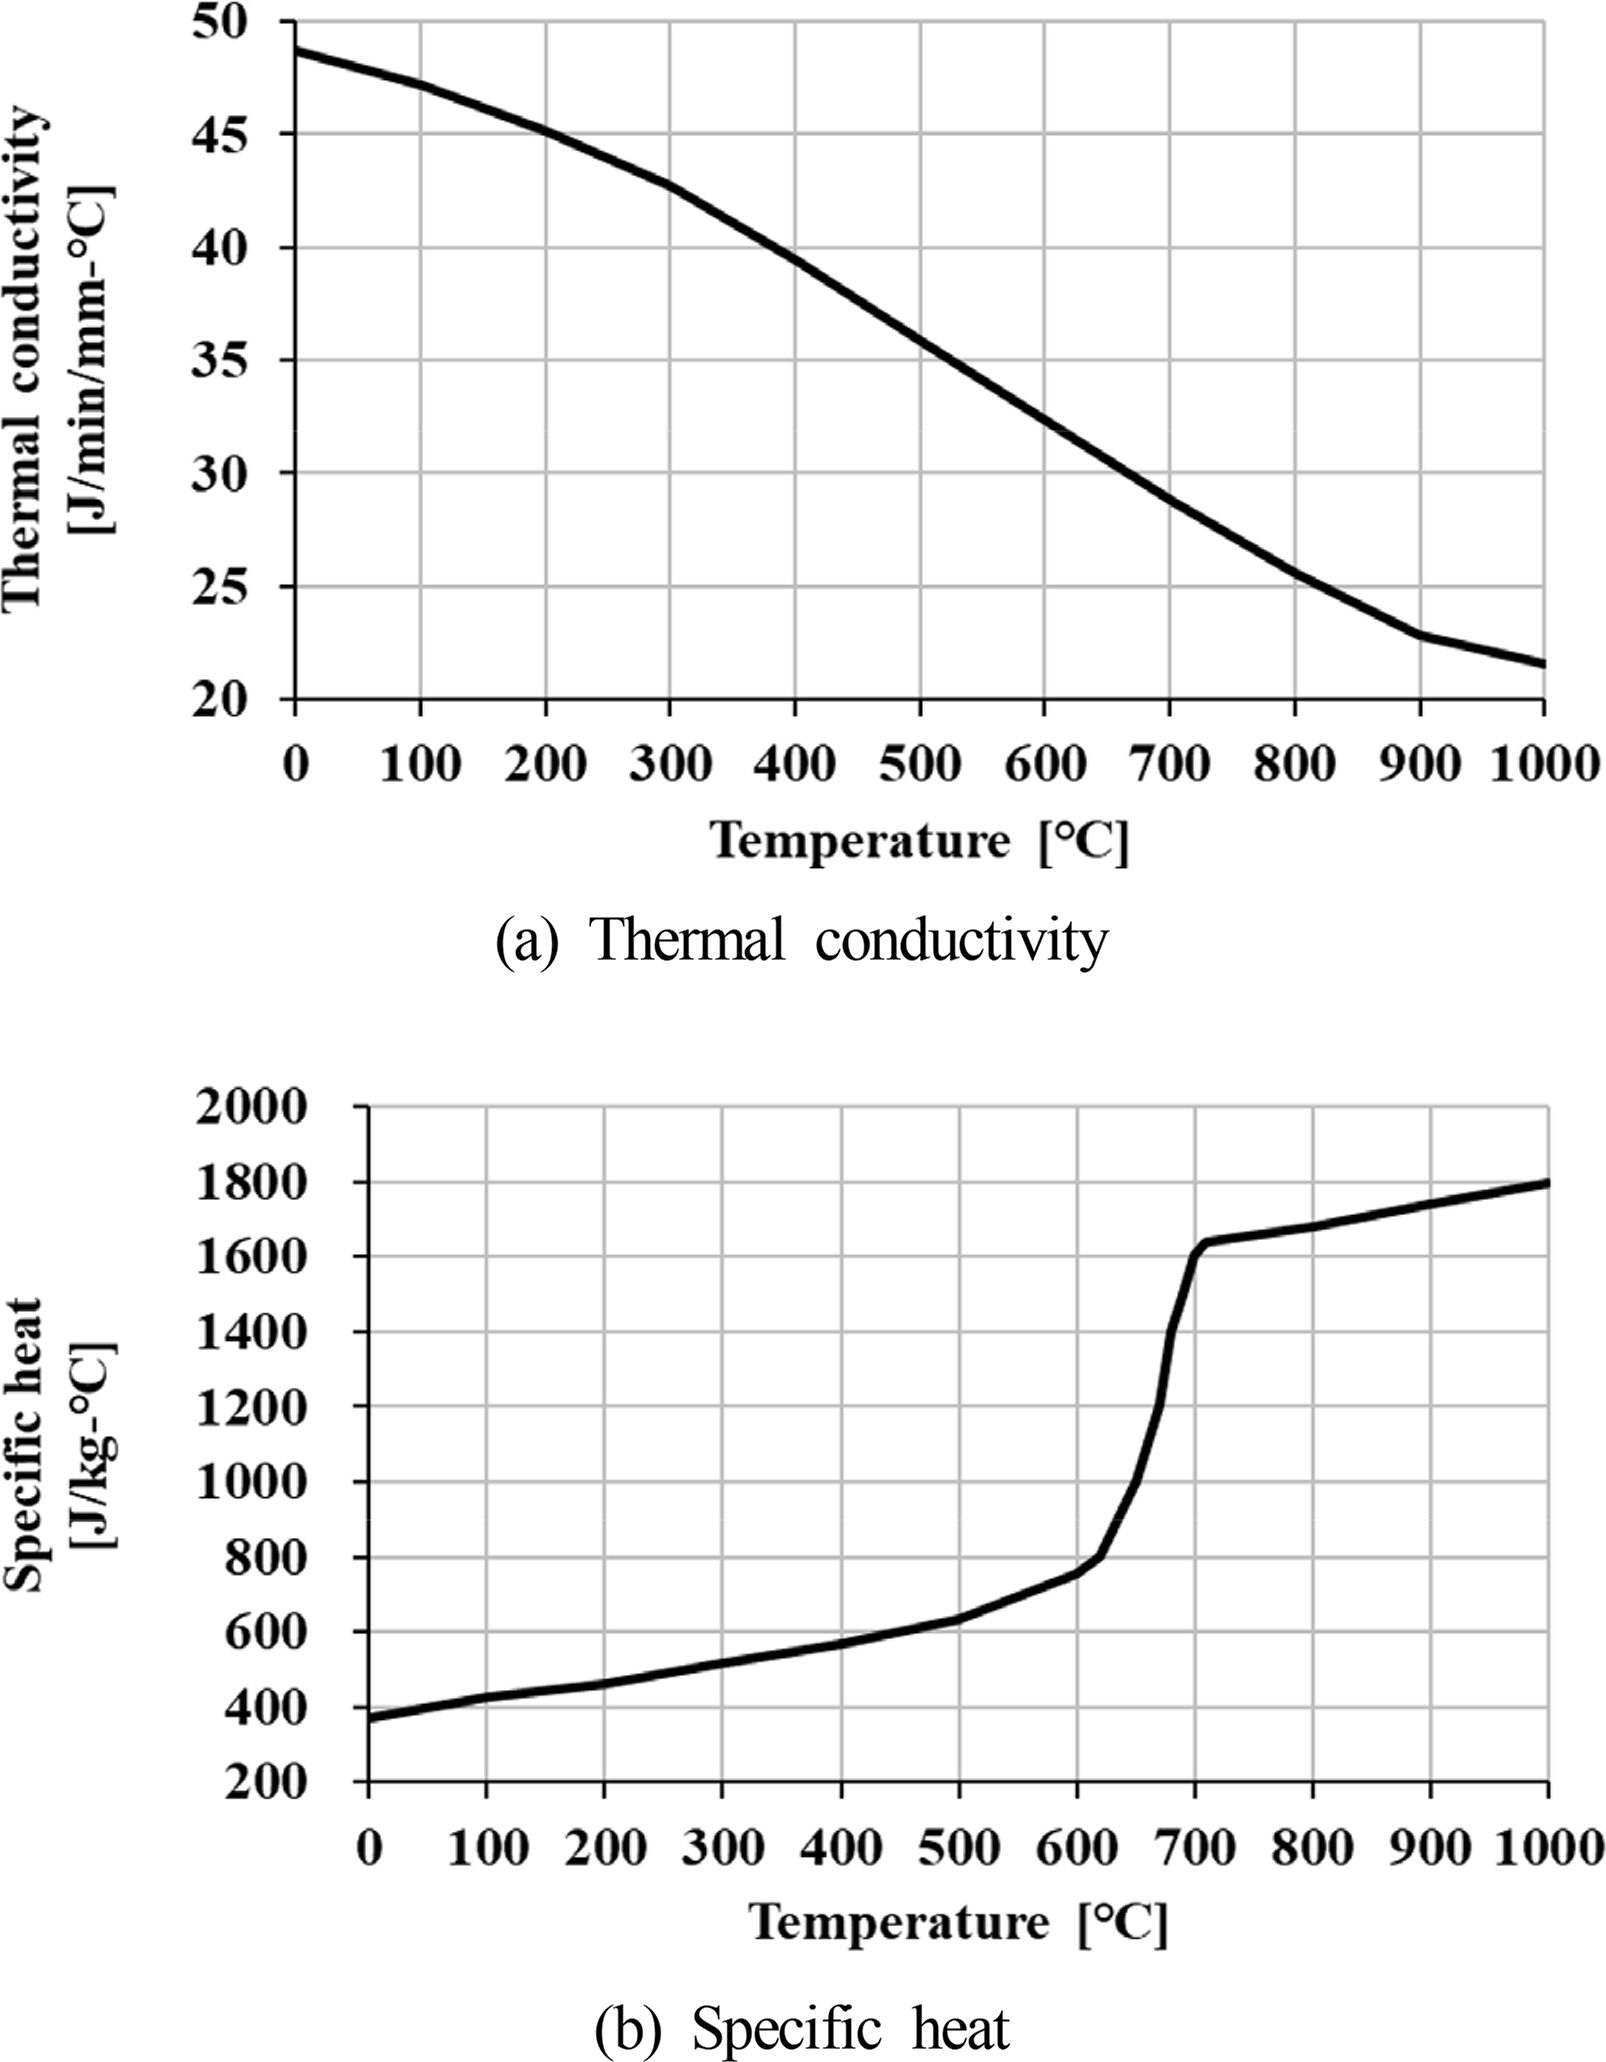
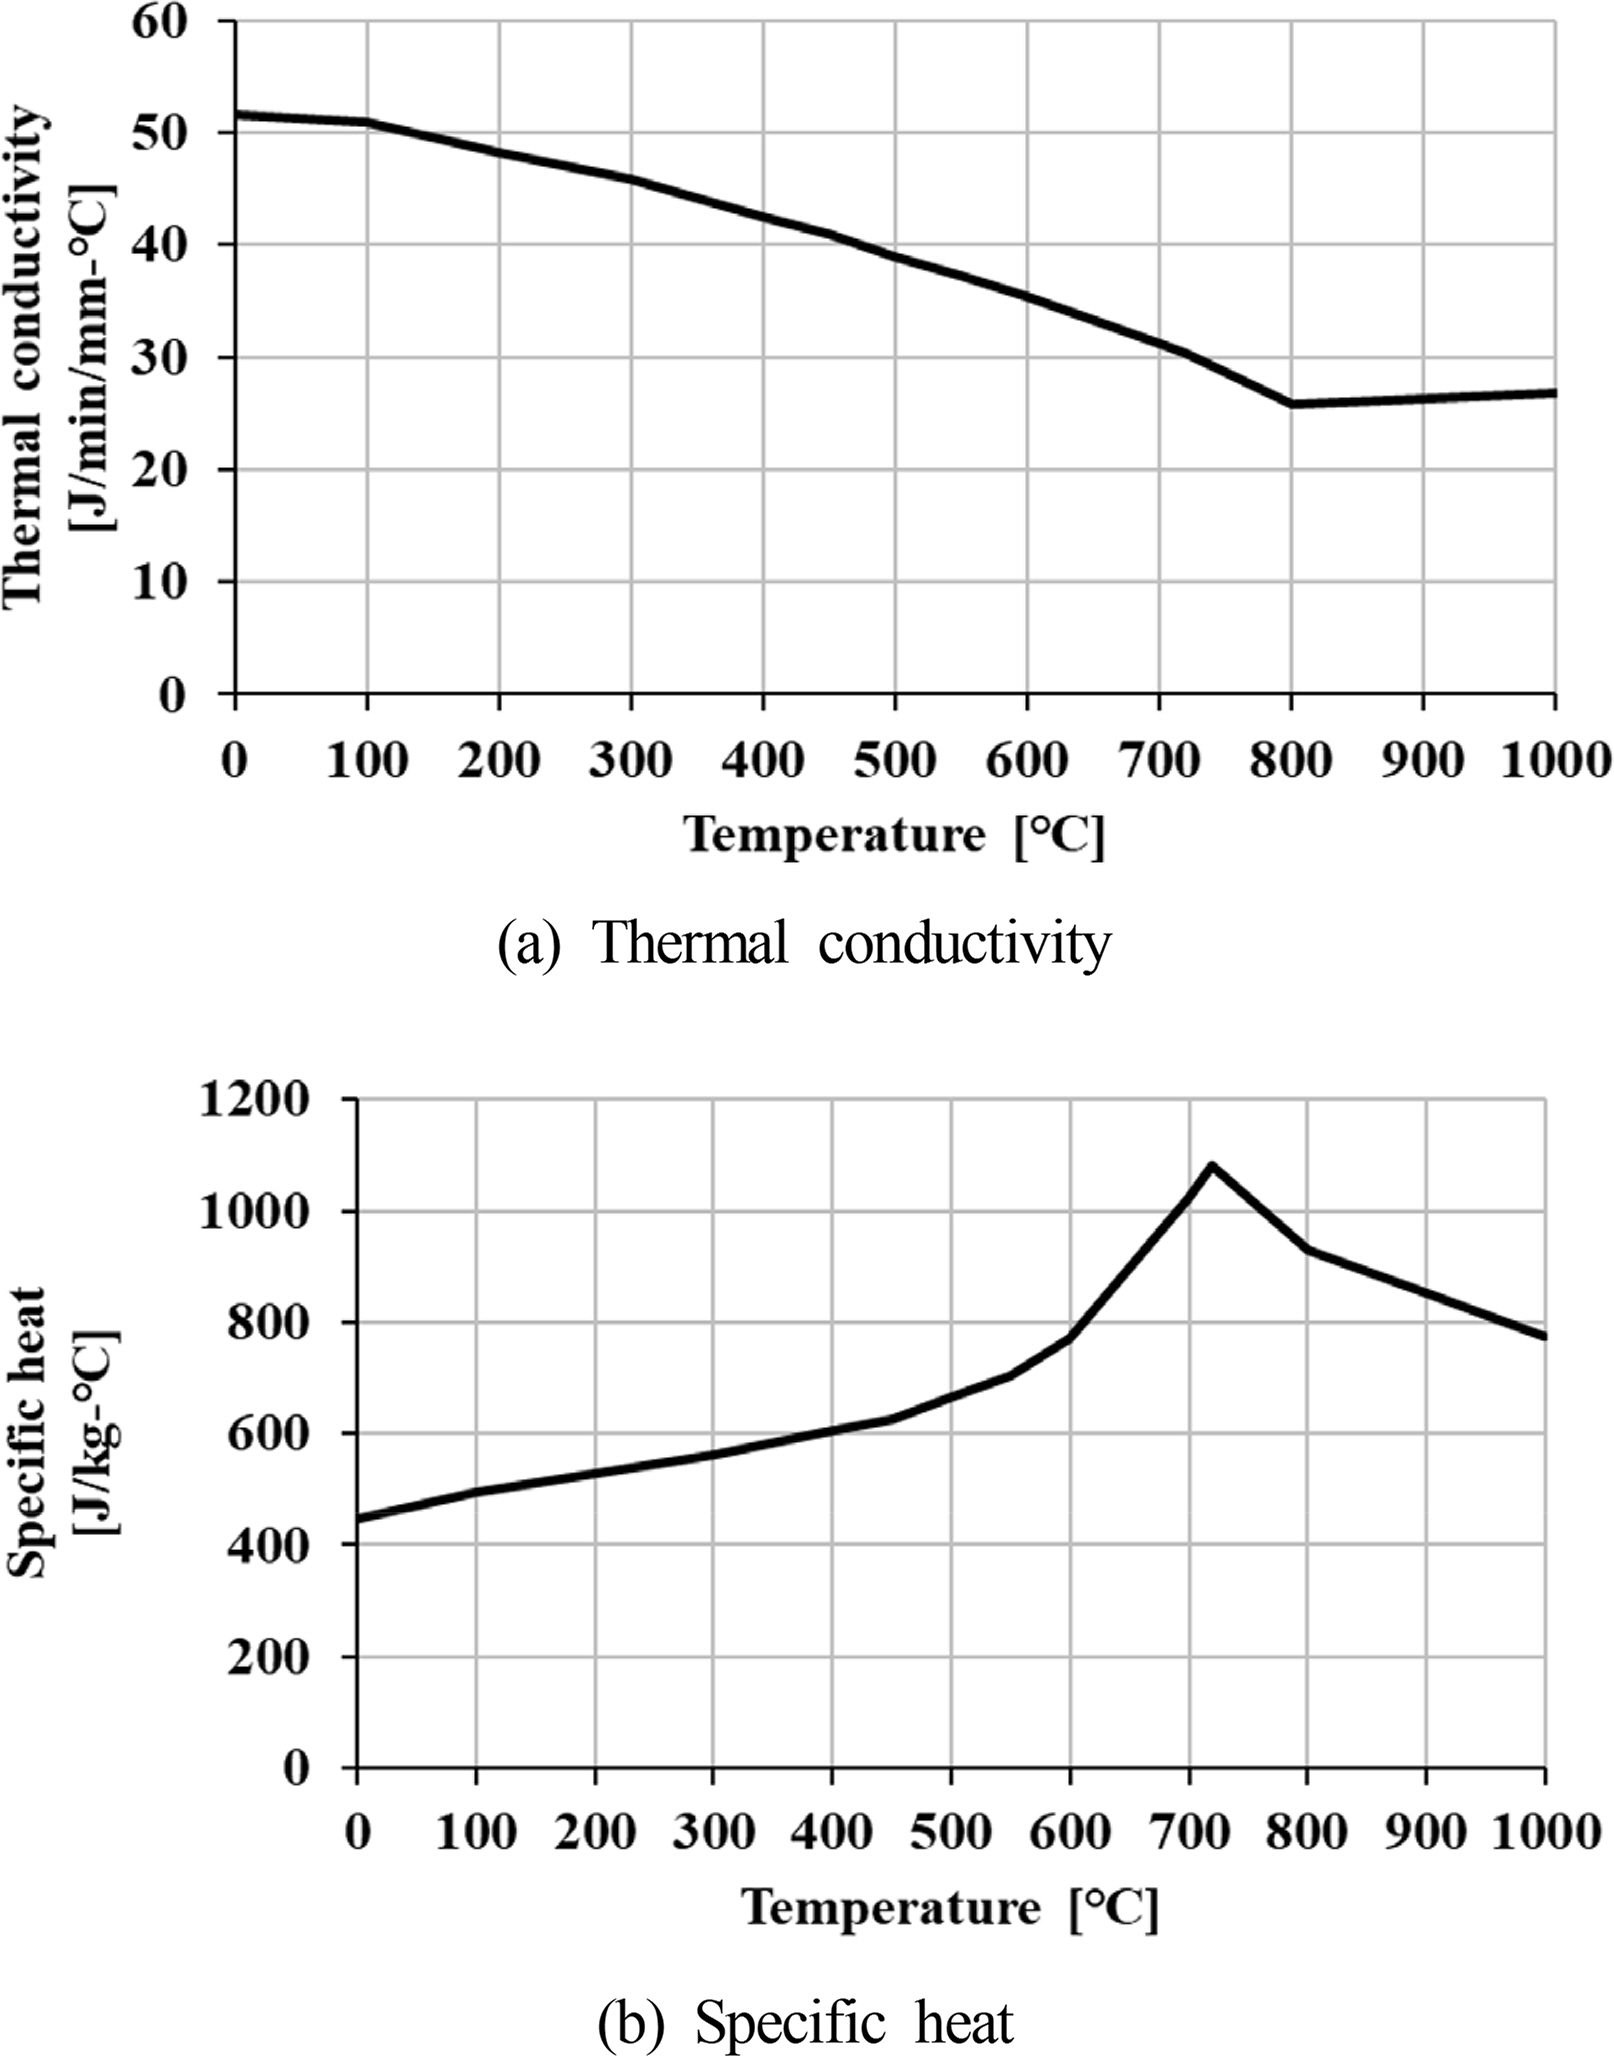
Regarding the thermal conductivity and specific heat characteristics of the material, the characteristics with different temperatures were applied by referring to the results of previous research to improve the accuracy of the transient heat-transfer analysis, as shown in Figs. 4–7.
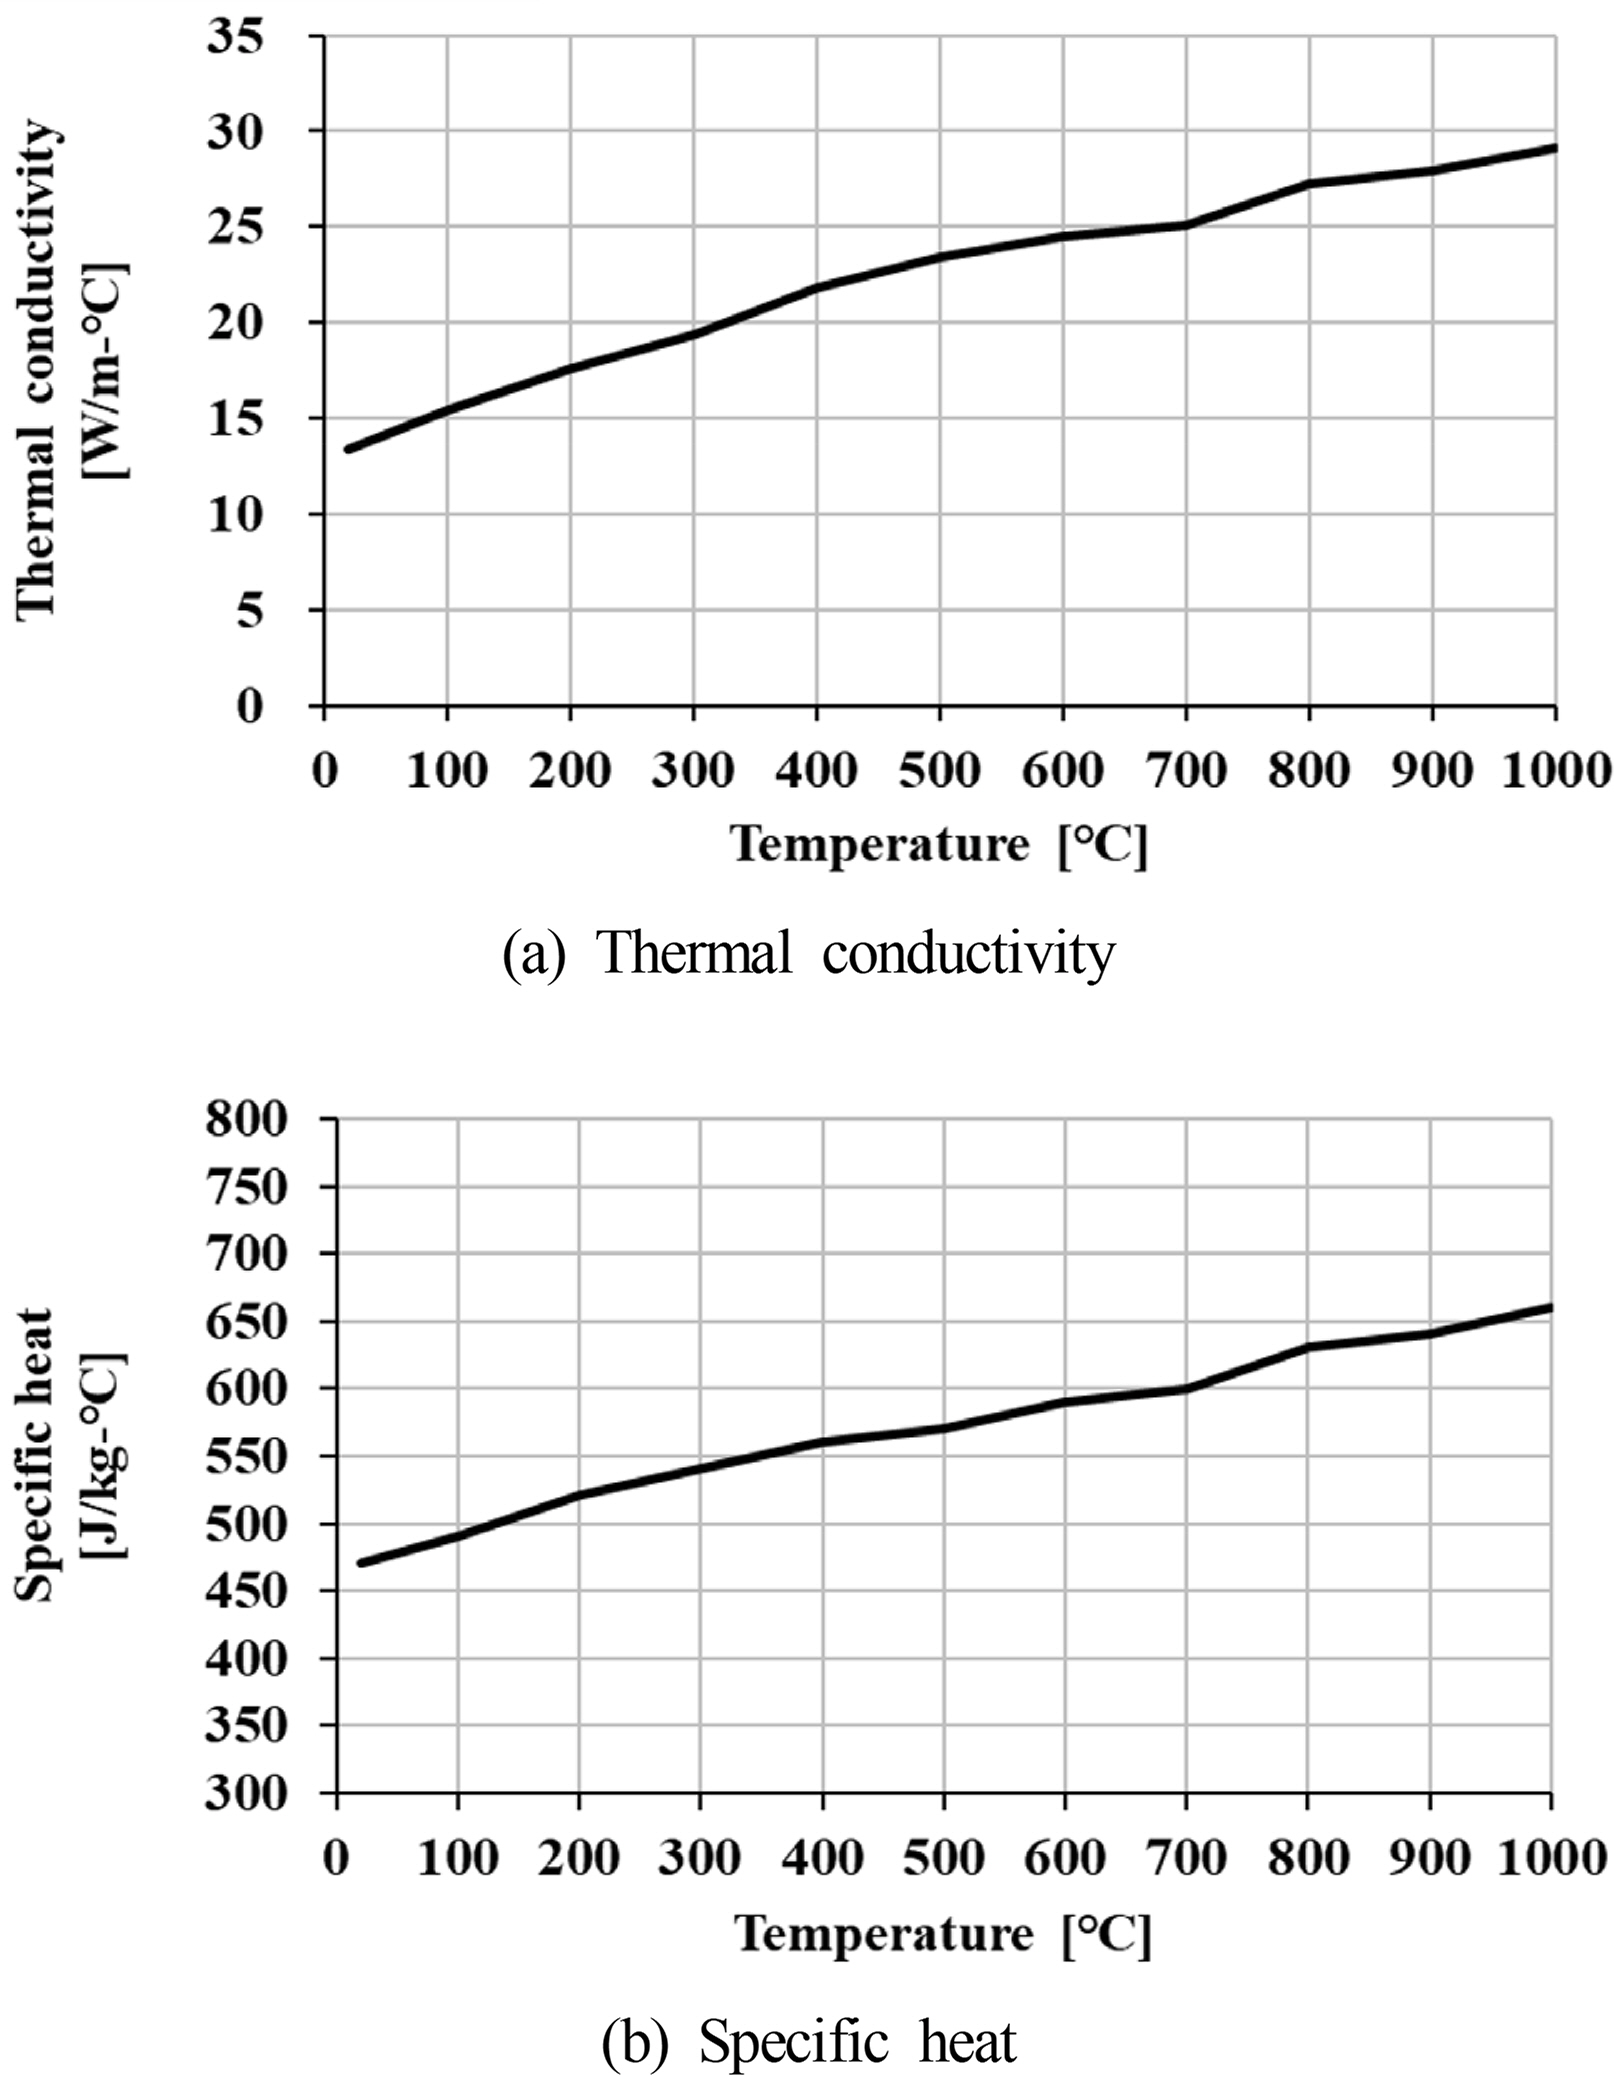
Material properties of SUS316L (Piscopo et al., 2019)
Material properties of S45C (Magnabosco et al., 2006)
Material properties of SS400 (Suman et al., 2016)
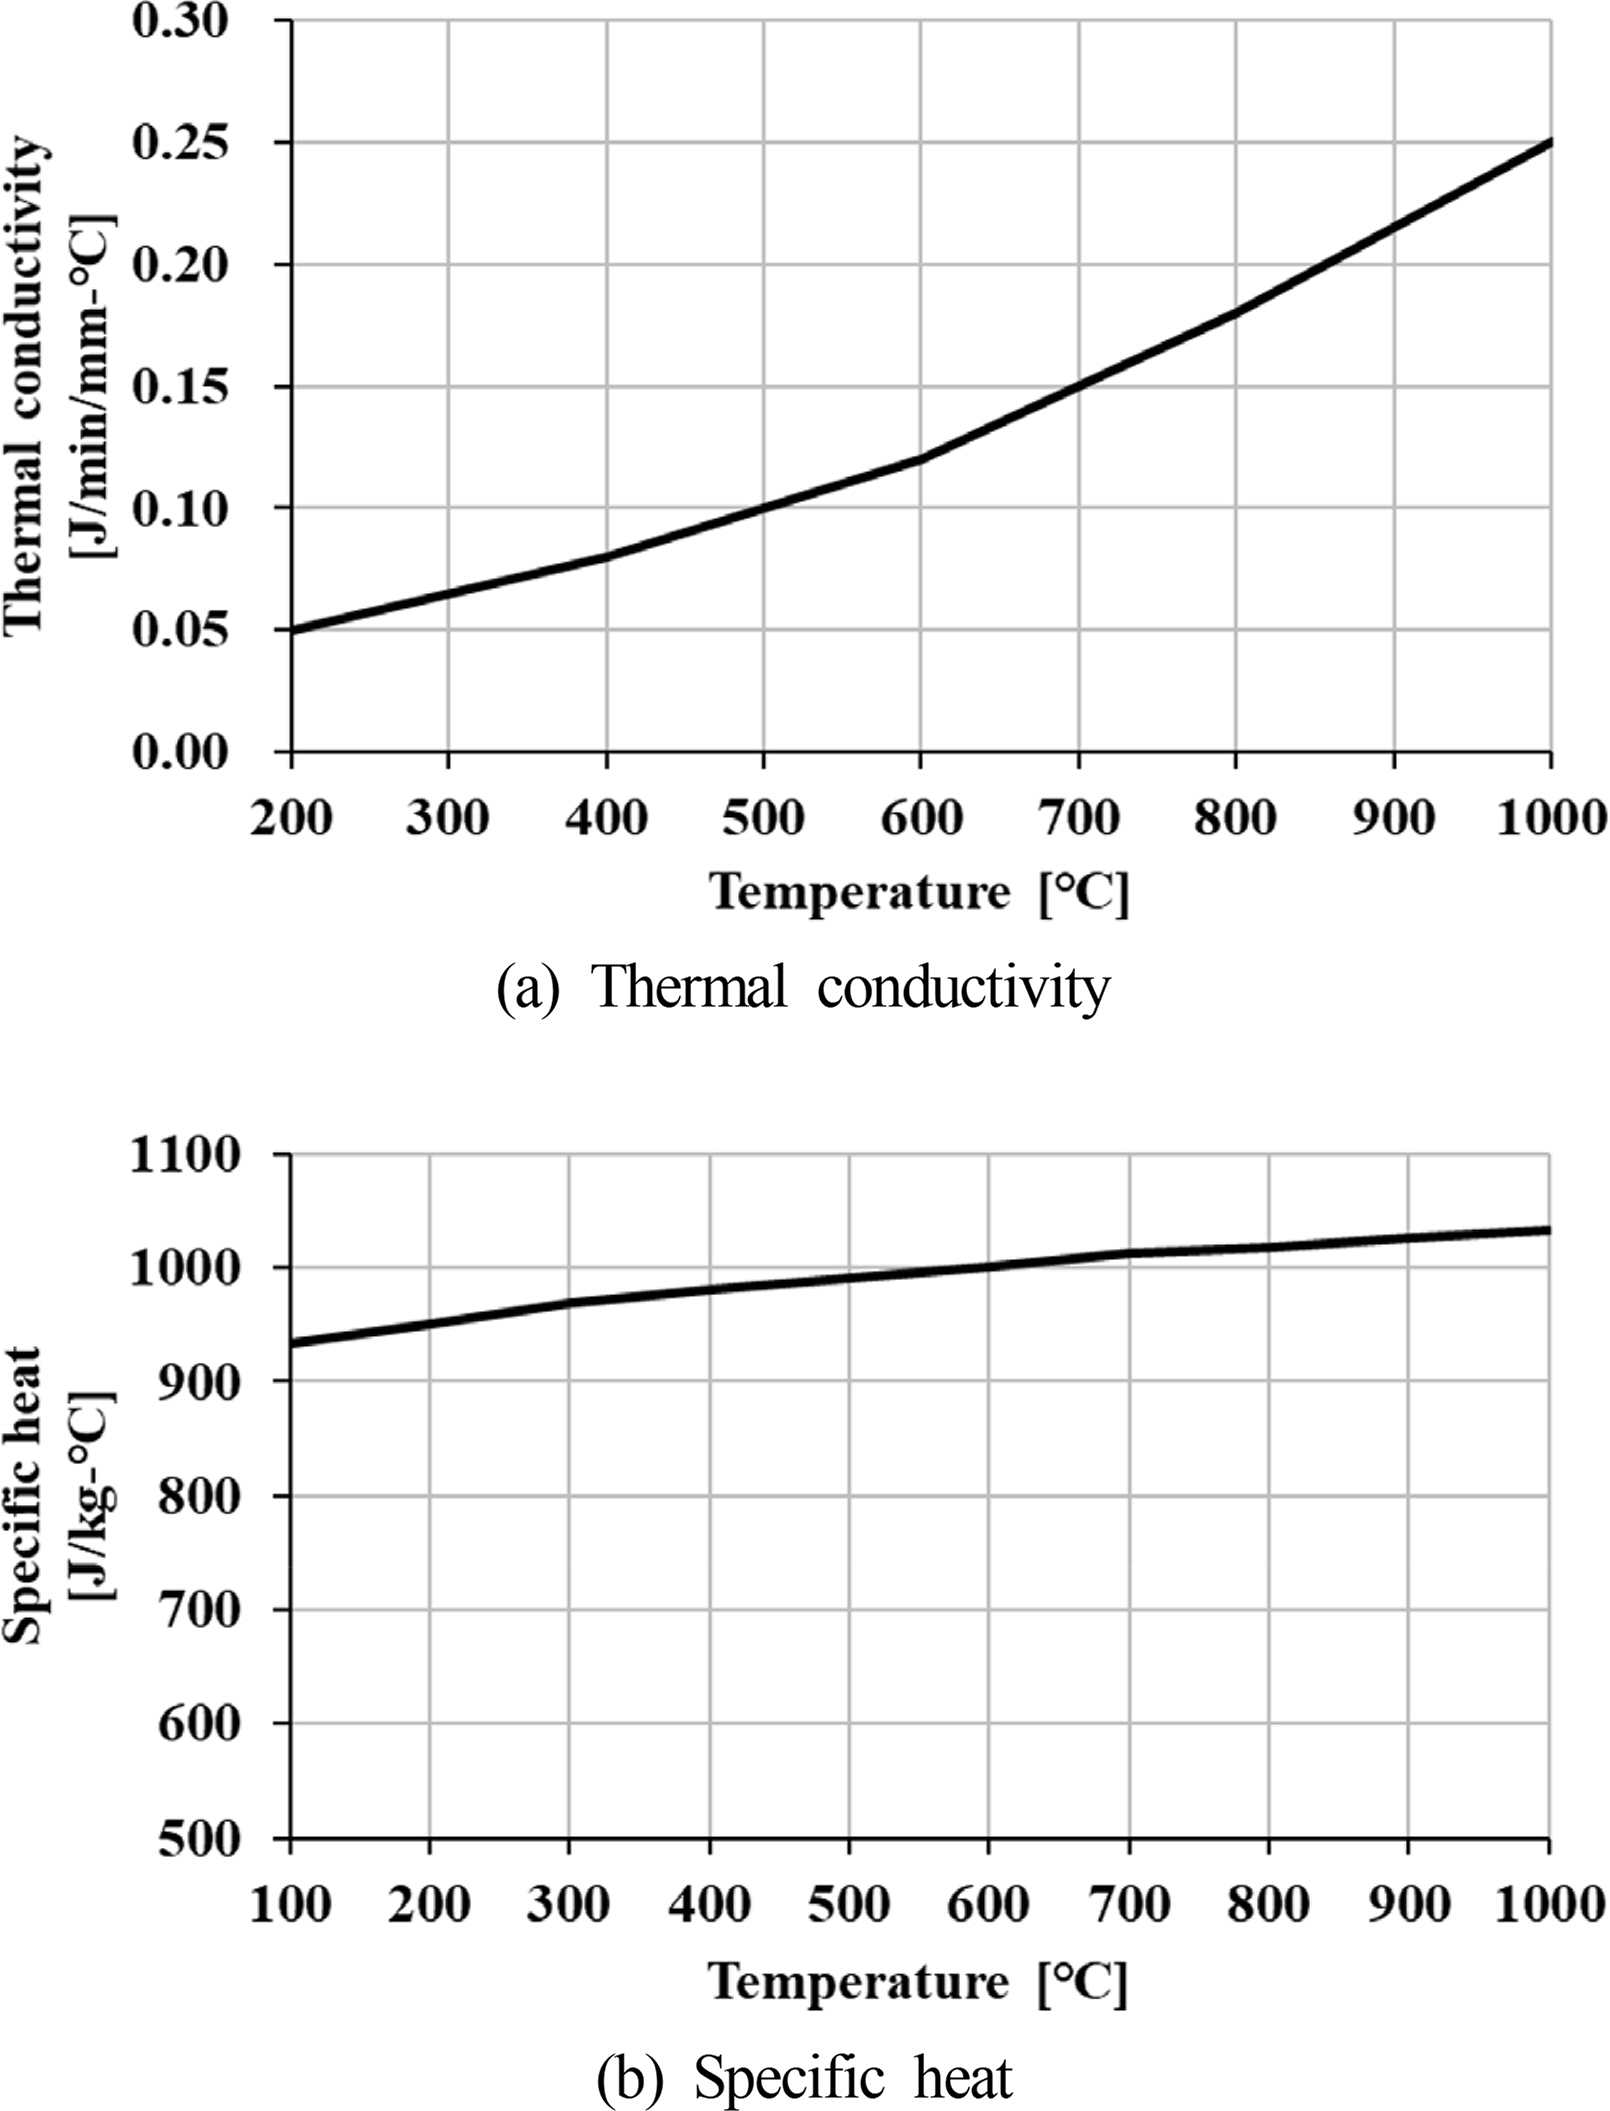
Material properties of insulation (Ohmura et al., 2003)
The furnace heating condition regulated by the FTP code was identically applied for the heat input condition of the transient heat-transfer analysis, as shown in Fig. 8. As indicated by Fig. 8(a), the specimen in which the A60 DPP is embedded at the furnace is installed in a horizontal direction to give the insulation-attached side an internal orientation toward the furnace. The internal temperature of the furnace is increased to 940 °C for 60 min with the flame of flaming point following the furnace control temperature curve presented in Fig. 8(b). The furnace control temperature curve is defined by Eq. (1). (MSC, 2010):

Furnace flame condition
Regarding the temperature measurement, the maximum temperature at the A60 DPP body is measured at the unexposed ambient domain of the furnace. We decided to satisfy the regulations in the case where the temperature deviation is below 180 °C.
Because the furnace heating condition regulated in the FTP code is a method of increasing the atmosphere temperature inside the closed furnace, Eq. (2) for calculating the convection coefficient was utilized in the transient heat-transfer analysis (Yunus and Afshin, 2012):
Here, Nu represents the Nusselt number, RaL represents the Rayleigh number, Pr represents the Prandtl number, k represents the thermal conductivity of the fluid, L represents the characteristic length, ν represents the kinematic viscosity of the fluid, g represents the gravitational acceleration, β is the cubic expansion coefficient, Ts represents the surface temperature, and T∞ represents the temperature of the fluid far from the surface.
The temperature-distribution results of the transient heat-transfer analysis at the heating time point of 60 min are presented in Fig. 9.
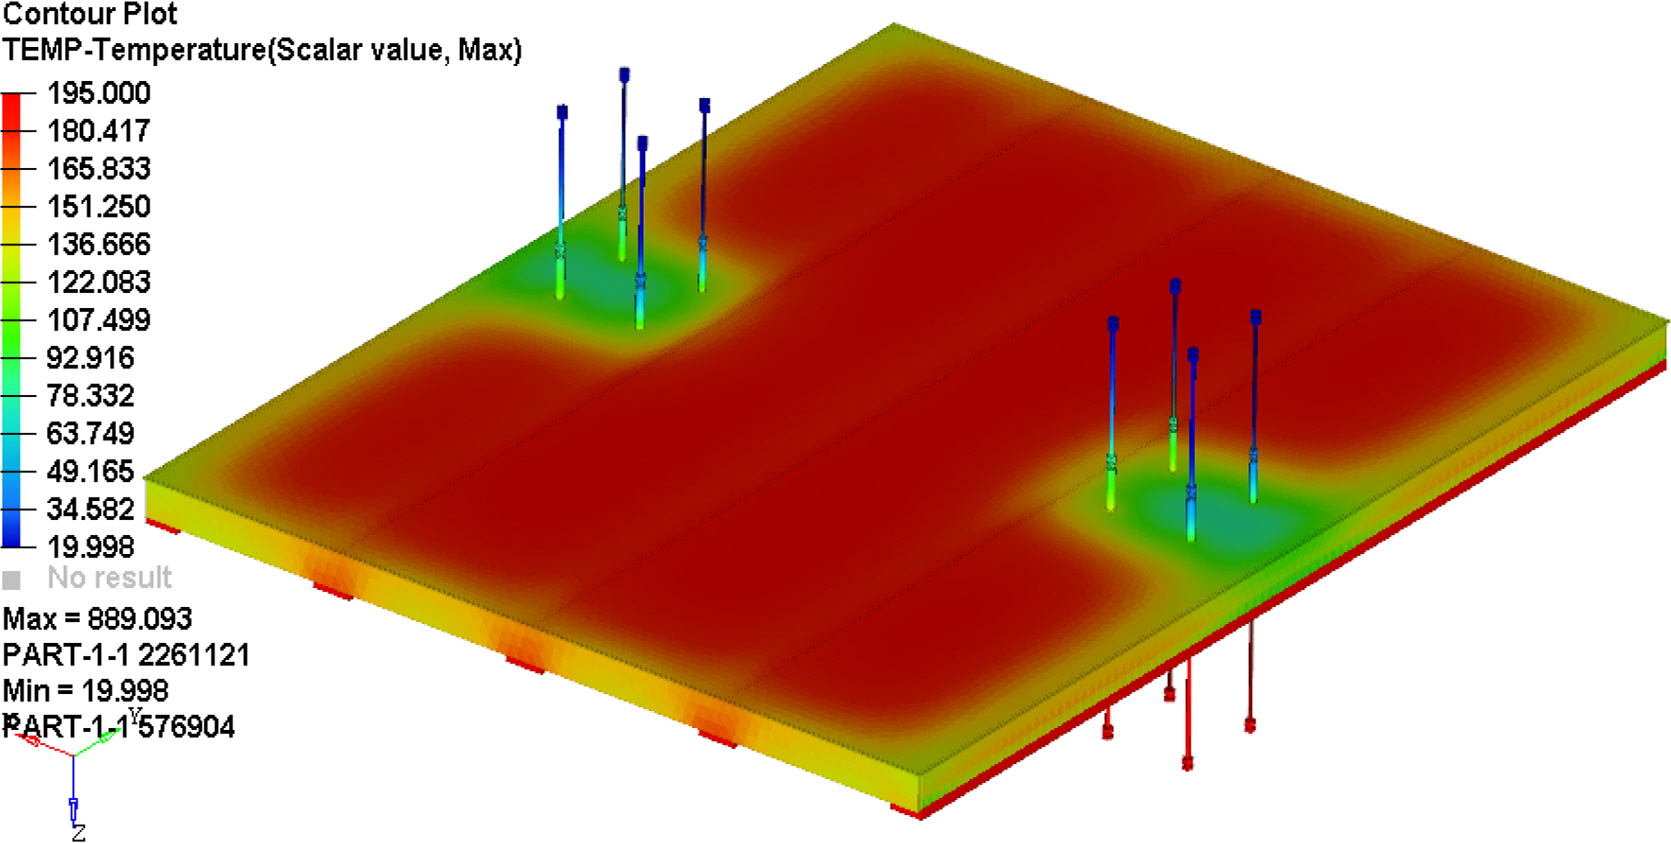
Temperature distribution contour results for unexposed ambient domain
The temperature distribution at the unexposed ambient domain was between 20 and 195 °C, as shown in Fig. 9, and the temperature of the part where the A60 DPP was installed was found to be high. In the transient heat-transfer analysis, the temperatures measured at the A60 DPP body at the unexposed ambient domain at the heating time point of 60 min were 63.7, 84.3, 64.6, and 88.1 °C at points 1, 2, 3, and 4, respectively, which correspond to the numbers in Fig. 3 and Table 1.
For the verification of the transient heat-transfer analysis results, the specimen was manufactured in accordance with the FTP regulation code, similar to the analysis model, and a fire test was performed according to the international standard test method. The horizontal furnace, i.e., fire-testing equipment for the A60 DPP, is an instrument for testing fire-prevention equipment of the A-class horizontal sections used in ships and offshore plants, and it requires an effective heating area of 3,000 mm × 3,000 mm. The internal temperature of the furnace is controlled by following the furnace control temperature curve, as shown in Eq. (1), through the burner installed at the lower part of the side, and the fire test is performed for different durations depending on the fire rating (ISO, 1999). The furnace equipment and the composition of the test setup utilized for the A60 DPP fire test are shown in Fig. 10.

Fire-test setup
As shown in Fig. 10(b), the A60 DPP temperature was measured at the position used for the transient heat-transfer analysis during the fire test, and the measurement results were compared with the analysis results, as shown in Table 2.

Comparison of the temperature measurement results
As shown in Table 2, the minimum error between the A60 DPP transient heat-transfer analysis and the fire test (8.7%) was obtained for measurement point 1, and the maximum error (11.6%) was obtained for point 4. The average error for all the measurement positions was 10.7%, and the tendency of change in temperature characteristics depending on different design specifications was also found to be similar. Considering that it is the transient heat-transfer analysis for the 60 min-fire test, it was concluded that the accuracy of the analysis results is verified. Therefore, it was confirmed that the fire-prevention design specifications of the A60 DPP considered in this study satisfy the FTP code regulations. Furthermore, because the fire-prevention design and heat-transfer characteristics of the A60 DPP were confirmed to be suitable via the transient heat-transfer analysis, a sensitivity analysis of the fire-prevention performance of the A60 DPP along with an evaluation of the approximation of the design space was conducted using analytical methods.
3. Sensitivity Analysis
In the sensitivity analysis of the A60 DPP, the verified finite-element model and transient heat-transfer analysis results were linked with the design of experiments, and the effect of each DF on the output response was quantitatively evaluated. For the DFs of the design of experiments, the length of the A60 DPP, diameter, material type, and insulation density were used. For the output responses, the weight, temperature, price, and productivity were individually applied. According to the design-of-experiments results, the optimum design combinations that can minimize the weight while satisfying the tolerance limit of the output response, such as the temperature, price, and productivity, were identified. In the design of experiments, the DFs and their levels were defined to be three levels for the body length and tube diameter, two levels for the material type of the A60 DPP, and three levels for the insulation type. Details are presented in Table 3.

Design factors and their levels
Among the output responses, the weight of the A60 DPP (excluding the specimen and the insulation connected to the A60 DPP) was considered as the weight, the measurement results from the transient heat-transfer analysis were applied as the temperature, and the price for each material type of the A60 DPP per the unit weight in a unit of 1,000 KRW was considered as the price. A productivity grade was assigned to each of the following and used as a quantitative index: the A60 DPP length, diameter, and the material type. The minimum weight was set to be preferred, and the tolerance limit of the temperature was defined to be below 180 °C, in accordance with the FTP code regulation. The maximum values for price and productivity calculated in the DF fluctuation level range of Table 3 were 37 and 17, respectively, and the 20% upper limit and lower limit of the maximum value were set as the tolerance limits, respectively. A full-factorial experiment with 54 runs was designed by applying the DF fluctuation level shown in Table 3, and the output-response results with changes in the DFs are presented in the experimental matrix of Table 4.

Full-factorial experiment results
In the sensitivity analysis, a quantitative main effect analysis of the DFs on each output response was conducted using the experimental matrix of Table 4, and the results are presented in Table 5. The main effect analysis indicates the average change of the output response observed with the fluctuation of DF levels, i.e., the sensitivity, and if the magnitude of the effect calculated from a DF is high, the importance of this factor to the output response is high.
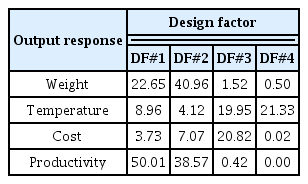
Main effect results (unit: %)
As shown in Table 5, the DFs with the most significant effects on the weight, temperature, price, and productivity were found to be the A60 DPP diameter, insulation density, material type of the A60 DPP, and length of the A60 DPP, respectively. On the basis of the sensitivity-analysis results, the selection of the insulation and A60 DPP material type in the fire-prevention design was found to be highly important. Furthermore, the effects of the A60 DPP length and diameter on the productivity were significant. The optimum design combinations that minimized the A60 DPP weight while satisfying the tolerance limit of the output responses were selected from the results presented in Table 4 and are presented in Table 6.

Optimum design cases for A60 DPP
As shown in Table 6, using the optimum DF combinations, the weight and price were reduced by 22.6% and 24%, respectively, while the productivity was increased by 8.6%. Although the temperature was increased by 18.7%, it sufficiently satisfied the condition of a temperature below 180 °C, which is the FTP code regulation. In summary, useful design information regarding the fire-prevention performance and productivity of the A60 DPP was obtained via the design of experiments and sensitivity analysis.
4. Approximation Modeling
Because an approximate model is generally obtained from the design of experiments, the general suitability of the design of experiments, such as the number of experiments conducted and levels of the DFs, can be verified by reviewing the accuracy of the approximate model (Song and Lee, 2010). Meanwhile, securing an approximate model suitable for the design problem can reduce the numerical cost for optimization analysis, robust analysis, and reliability analysis, which are computationally expensive; thus, the generation of an approximate model with high accuracy is important in design space exploration research. In the approximation modeling evaluation, different approximate models, i.e., Kriging, the RSM, and RBFN, were created according to the design-of-experiments results for the A60 DPP. Moreover, the suitability of the design-of-experiments results was verified by examining the accuracy of the approximation modeling results, and the accuracies of the models for approximating the A60 DPP design space were compared.
The Kriging model is defined as the sum of the whole model of the actual design space function to be approximated and the local model corresponding to the deviation of the actual function and whole model (Cho et al., 2009).
Here, AK represents the unknown coefficient vector, and Z(x) represents the global model vector. E(x) represents the spatial correlation of design data and is defined as the Gaussian correlation function.
The RSM is expressed as the following second-degree polynomial regression model using the least-squares method (Song and Lee, 2010).
When the matrix Z defined by response vector g and k base variables is obtained from n experimental points, the unknown RSM approximation coefficient vector AR is calculated using the following equation, by minimizing the random error vector e from the relationship between g and Z.
By applying the approximation coefficient calculated using Eq. (5), the RSM second-degree regression approximate model can be generated.
The RBFN was developed to approximate the scattered multivariate data with high accuracy (Dyn et al., 1986). The RBFN uses linear combinations of the radial symmetry function utilizing Euclidean distance for the approximation of the output response. When the node-set of the neural network, i.e., x1, …, xn ∈ohm ⊂ Rn, is provided, the basis function of the RBFN is defined as follows:
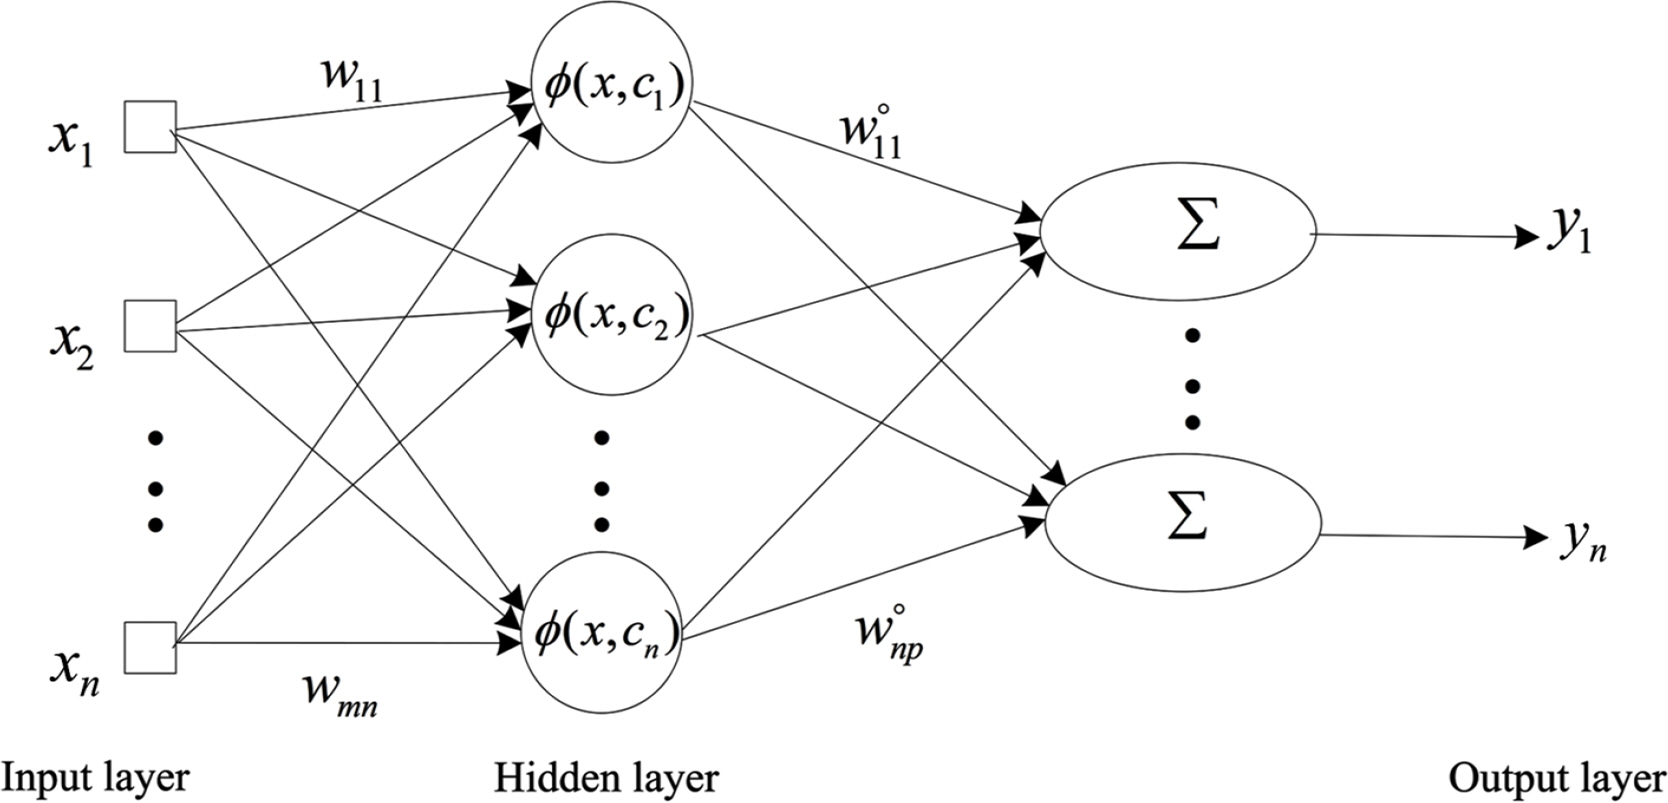
Learning procedure of the RBFN
Here, αj is the unknown approximation coefficient.
The accuracy of the approximate model was determined using the R2 value, as follows:

Comparison of approximate modeling results
As indicated by Table 7, the R2 values for the output responses of all the approximate models were >0.96 on average, indicating a high accuracy. Among approximate models, the Kriging model exhibited the lowest accuracy overall, while the average R2 results for the RSM and RBFN were high: 0.996 and 1.000, respectively. For all the approximate models, the accuracy of the temperature response was the lowest, and that of weight response was the highest. This difference in approximation accuracy can be explained by the fact that the weight response is a linear characteristic while the temperature response, which is the result of the transient heat-transfer analysis, has a relatively high nonlinearity. The design-of-experiments method used in this study was verified to be suitable for the design-space analysis of A60 DPP. Among the approximate models used in the full-factorial experiment of this study, the RBFN allowed exploration of A60 DPP design space with the highest accuracy and is expected to be used for optimization analysis, robust analysis, and reliability analysis to improve the efficiency of numerical calculations in the future. The RBFN has a higher accuracy for the exploration of the A60 DPP design space than the RSM and Kriging models because it can effectively approximate the nonlinear response results of the transient heat-transfer analysis through the neural-network learning process.
5. Conclusions
The approximation characteristics of the design space for the A60 DPP used for ships and offshore plants were evaluated by performing a sensitivity analysis on the fire-prevention design via the design of experiments and applying various approximate models to a sensitivity analysis on the fire-prevention performance and minimum weight design. To evaluate the fire-prevention performance of the A60 DPP, a transient heat-transfer analysis based on the FEM was conducted after applying the specimen specifications and temperature conditions regulated in the FTP code. According to the transient heat-transfer analysis, the temperature results measured at the A60 DPP body at the unexposed ambient domain at the heating time point of 60 min were found to satisfy the condition of a temperature below 180 °C, which is the FTP code regulation. A fire test for verification of the transient heat-transfer analysis results was conducted in accordance with the FTP regulation code of the Maritime Safety Committee. The minimum and maximum errors between the transient heat-transfer analysis and fire test were 8.7% and 11.6%. Moreover, the average error for all the total measurement positions was 10.7%, and the tendencies of the changes in the temperature characteristics with different design specifications were similar. The verified finite-element model and transient heat-transfer analysis results were linked with the design of experiments. The length of the A60 DPP, diameter, material type, and insulation density were used as DFs, and the weight, temperature, price, and productivity were individually applied as output responses. In the design of experiments, a total of 54 full-factorial experiments were performed after applying the DF fluctuation level. For the sensitivity analysis, the effect of each DF on the output response was quantitatively assessed using the results of the design of experiments, and the optimum design combinations that minimized the weight while satisfying the tolerance limit of the output responses, such as the temperature, price, and productivity, were identified. On the basis of the sensitivity-analysis results, the DFs with the most significant effects on the weight, temperature, price, and productivity were found to be the A60 DPP diameter, insulation density, A60 DPP material type, and length, respectively. Furthermore, it was found that selecting the proper insulation and A60 DPP material type are highly important in the fire-prevention design, and with regard to productivity, the effects of the A60 DPP length and diameter are significant. According to the results of the optimum DF combinations of the design of experiments, the weight and price were reduced by 22.6% and 24%, respectively, and the productivity was improved by 8.6%. Although the temperature was increased by 18.7%, it was below 180 °C, satisfying the FTP code regulation. Using the results of the design of experiments, various approximate models, i.e., a Kriging model, RSM model, and RBFN, were produced. According to the analysis results for the accuracy of each approximate model for approximating the A60 DPP design space, the approximation accuracies of all the approximate models for the output response were high, confirming that the design-of-experiments method used in this study is suitable for the analysis of the A60 DPP design space. Furthermore, it was found that among the approximate models used in the full-factorial experiment of this study, the RBFN allows the exploration of the A60 DPP design space with the highest accuracy.
Funding
This work was supported by project for Collabo R&D between Industry, Academy, and Research Institute funded by Korea Ministry of SMEs and Startups (Project No.S2910737) and also supported by “Regional Innovation Strategy (RIS)” through the National Research Foundation of Korea (NRF) funded by the Ministry of Education (MOE).