A Study on the Performance Variation of a Three-Dimensional Hydrofoil Using Jet Flow
Article information

Abstract
As one of the development directions of high-performance ships to reduce greenhouse gas emissions, there is research on high-performance propellers. However, in the case of conventional screw propellers, as they have been studied for a long time, there is a limit to improving efficiency only by depending on the conventional design and analysis methods. In this study, we tried to solve the problems using the Coanda effect by spraying a jet on the surface of the hydrofoil. The Coanda hydrofoil consists of a tunnel and jet slit to make jet flow. The computation was performed for each tunnel and slit position, and the efficiency according to the geometry of the hydrofoil was analyzed. In addition, a study on the 3D geometry change was conducted to analyze the performance according to the span direction spraying range and hydrofoil shape. As the height of the slit and the diameter of the tip were lower, when the slit is located in the center of the hydrofoil, the lift force increased and the drag force decreased. The increase rate of lift-to-drag ratio was different according to the shape of the hydrofoil, and the efficiency of the spraying condition of 0.1S–0.5S, which had the least effect on the vortex at the tip of the blade, was high for all 3D hydrofoils. When the geometry of the slit was optimized, and also the shape and spray range of the hydrofoil in 3D was considered, the efficiency of the jet sprayed hydrofoil was increased.
Nomenclature
CChord length of hydrofoil (m)
SSpan length of hydrofoil (m)
ṁMass flow rate (kg/s)
VjetSpraying velocity at slit (m/s)
ρ>Density (kg/m3)
SjSpraying jet area of the hydrofoil (m2)
V∞Inflow velocity (m/s)
αAngle of attack (°)
CLLift coefficient,
CDDrag coefficient,
1. Introduction
The International Maritime Organization (IMO) established its Energy Efficiency Design Index standard in 2013 and has been strengthening the regulations on air pollutants since 2020, such as lowering the baseline emissions of sulfur oxides (SOx) in ship fuel from 3.5% to 0.5%. As these regulations have been enforced, interest in improving the operational efficiency of ships for fuel savings has increased. To improve the propulsion efficiency of ships, attempts have been made to optimize the propeller designs and apply fuel-saving devices installed at the front and back of the propeller. However, the improved designs that maintain the existing framework have had a limitation in achieving dramatic fuel savings. In particular, screw propellers are propulsion machines using lift as a propulsion force, which is generated by the relative angle of attack created between the rotation of the propeller hydrofoils and the inflow, and have been used in ships for more than 150 years. Screw propellers have become currently the most efficient marine propulsion device through a long period of research and development, and for this reason, it is nearly impossible to improve the efficiency by more than 2% even if advanced optimization tools and analysis techniques are used. To dramatically improve the efficiency of conventional marine propulsion systems, beyond the concept of screw propellers, which have been in use since the 19th century, a new type of propulsion device should be developed. In this study, we focused on applying the Coanda effect to propeller hydrofoils for developing a high-efficiency propulsion system that can be differentiated from conventional screw propellers.
A performance improvement of the wings when using the Coanda effect has been mainly achieved in the aviation field by spraying the jet along the surface of the wings. For example, Pfingsten and Radespiel (2007) used jet blowing at the flap to delay a wing stall and obtain a high lift. Furthermore, they compared the pressure distribution based on the jet injection and angle of attack, thereby analyzing the effect of the jet on the pressure distribution of the wing. In addition, Yoon et al. (2012) used a main slit and a sub-slit to conduct a study on the Coanda effect according to the spraying strength of each slit and the material change in the cylinder shape, thereby experimentally and numerically investigating the change in flow according to the spraying strength of the two adjacent slits in the cylinder structure. Furthermore, Djojodihardjo (2013) conducted a study on the vortex occurring at the wing tip when a jet blows over the wing surface.
Furthermore, although studies have been conducted in a variety of ways in the aviation field, in comparison, very few studies have been conducted in the shipbuilding field, and representative studies include those conducted by Seo and Lee (2013) and Seo et al. (2016). Seo and Lee (2013) analyzed the performance of a Coanda hydrofoil by spraying type based on the changes in the lift and drag characteristics and the boundary layer for application to marine rudder systems. Seo et al. (2016), by contrast, conducted a study on the performance variation of a marine stabilizer fin based on the geometry and amount of spraying of the slit.
Because the physical properties of water and air are different, a basic study was conducted on applying the Coanda effect to the hydrofoils of vessels, and a previous study analyzed the changes and cavitation performance of lift and drag in a two-dimensional geometry (Eom et al., 2020). Based on this, the present study investigated the position, geometry, and scope of the jet slit and analyzed the three-dimensional effect of a Coanda hydrofoil.
2. Numerical Validation
2.1 Experimental Equipment
Because comparisons of the results between this study and the studies of other institutions have been limited, to validate the numerical analysis results, we conducted experiments by creating our own experimental equipment. The experiments were conducted in the towing tank of Inha University, and the overall geometry of the experimental equipment is as shown in Fig. 1. The towing tank of Inha University has a drivable distance of approximately 45 m. In addition, the capacity of the load cell used in the experiments was 100 N in the ±z-direction, and the capacity of the pump was 100W at maximum. The chord length of the hydrofoil was 200 mm and the length in the span direction was 300 mm. To increase the Reynolds number as much as possible, the towing speed was set to 2 m/s, which was the fastest speed possible within the allowed ranges of the load cell and the towing carriage.
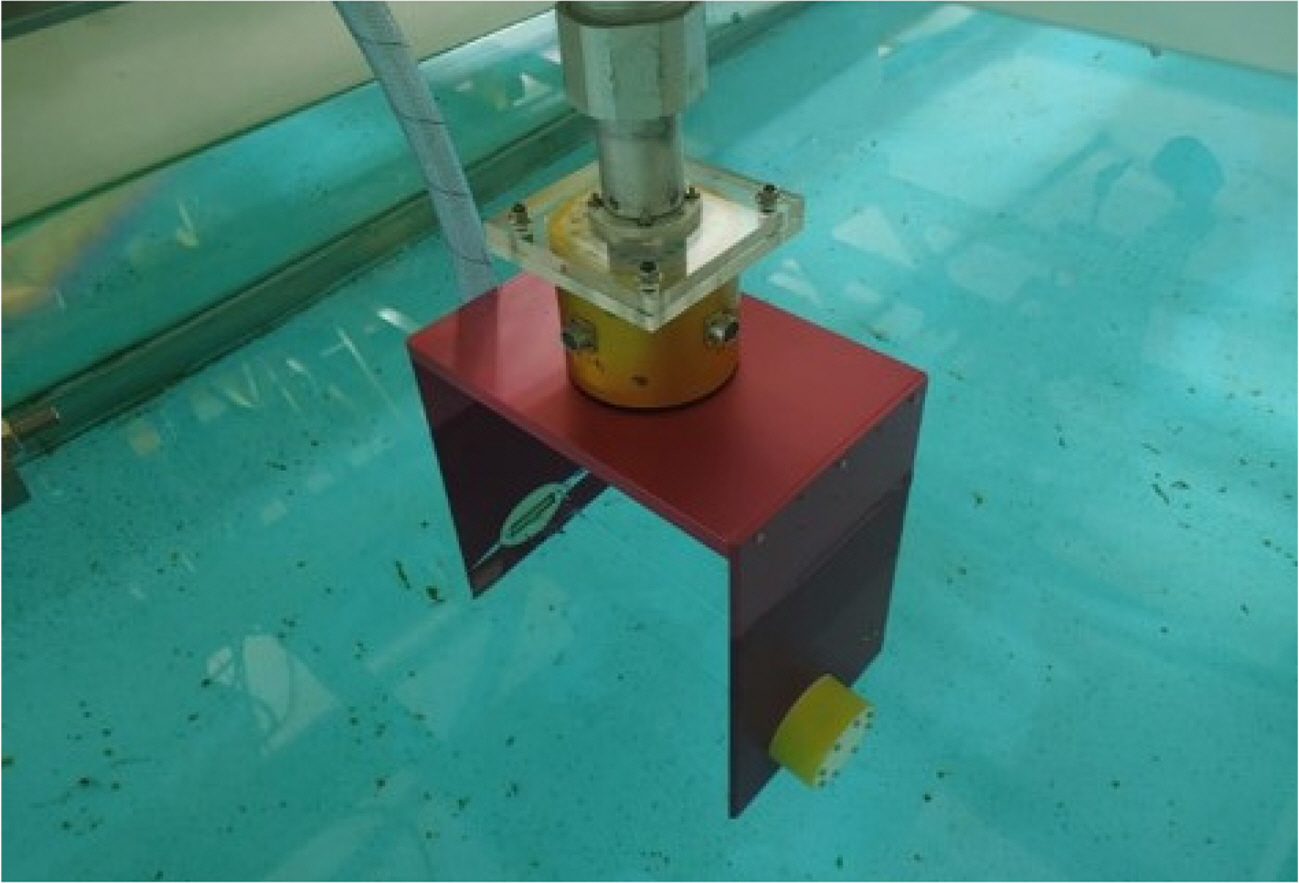
Experimental setup for Coanda hydrofoil
The experimental equipment consists of four main components: a hydrofoil, a tube that supplies water to the spray jets, a chamber that lets the water pass through the hydrofoil, and a frame for fixing the hydrofoil on the carriage. Fig. 2 illustrates the drawings used for fabrication of the experimental equipment. The hydrofoil was made of acrylic material, and the angle of attack could be adjusted by rotating the chamber fixed on both sides of the hydrofoil. Considering the manufacturing tolerance, the height of jet spraying slit (hS) was set to 0.5% (1 mm) of the chord length, and the diameter of the tip (hT) where the slit and the suction side meet was set to 0.5 mm, which was 50% of the slit height. The jet spaying range was 80% of the span direction, and Fig. 3 illustrates the geometry of the hydrofoil. For the cross-section of the hydrofoil, the same dimensional specifications of a previous study (Eom et al., 2020) was used.
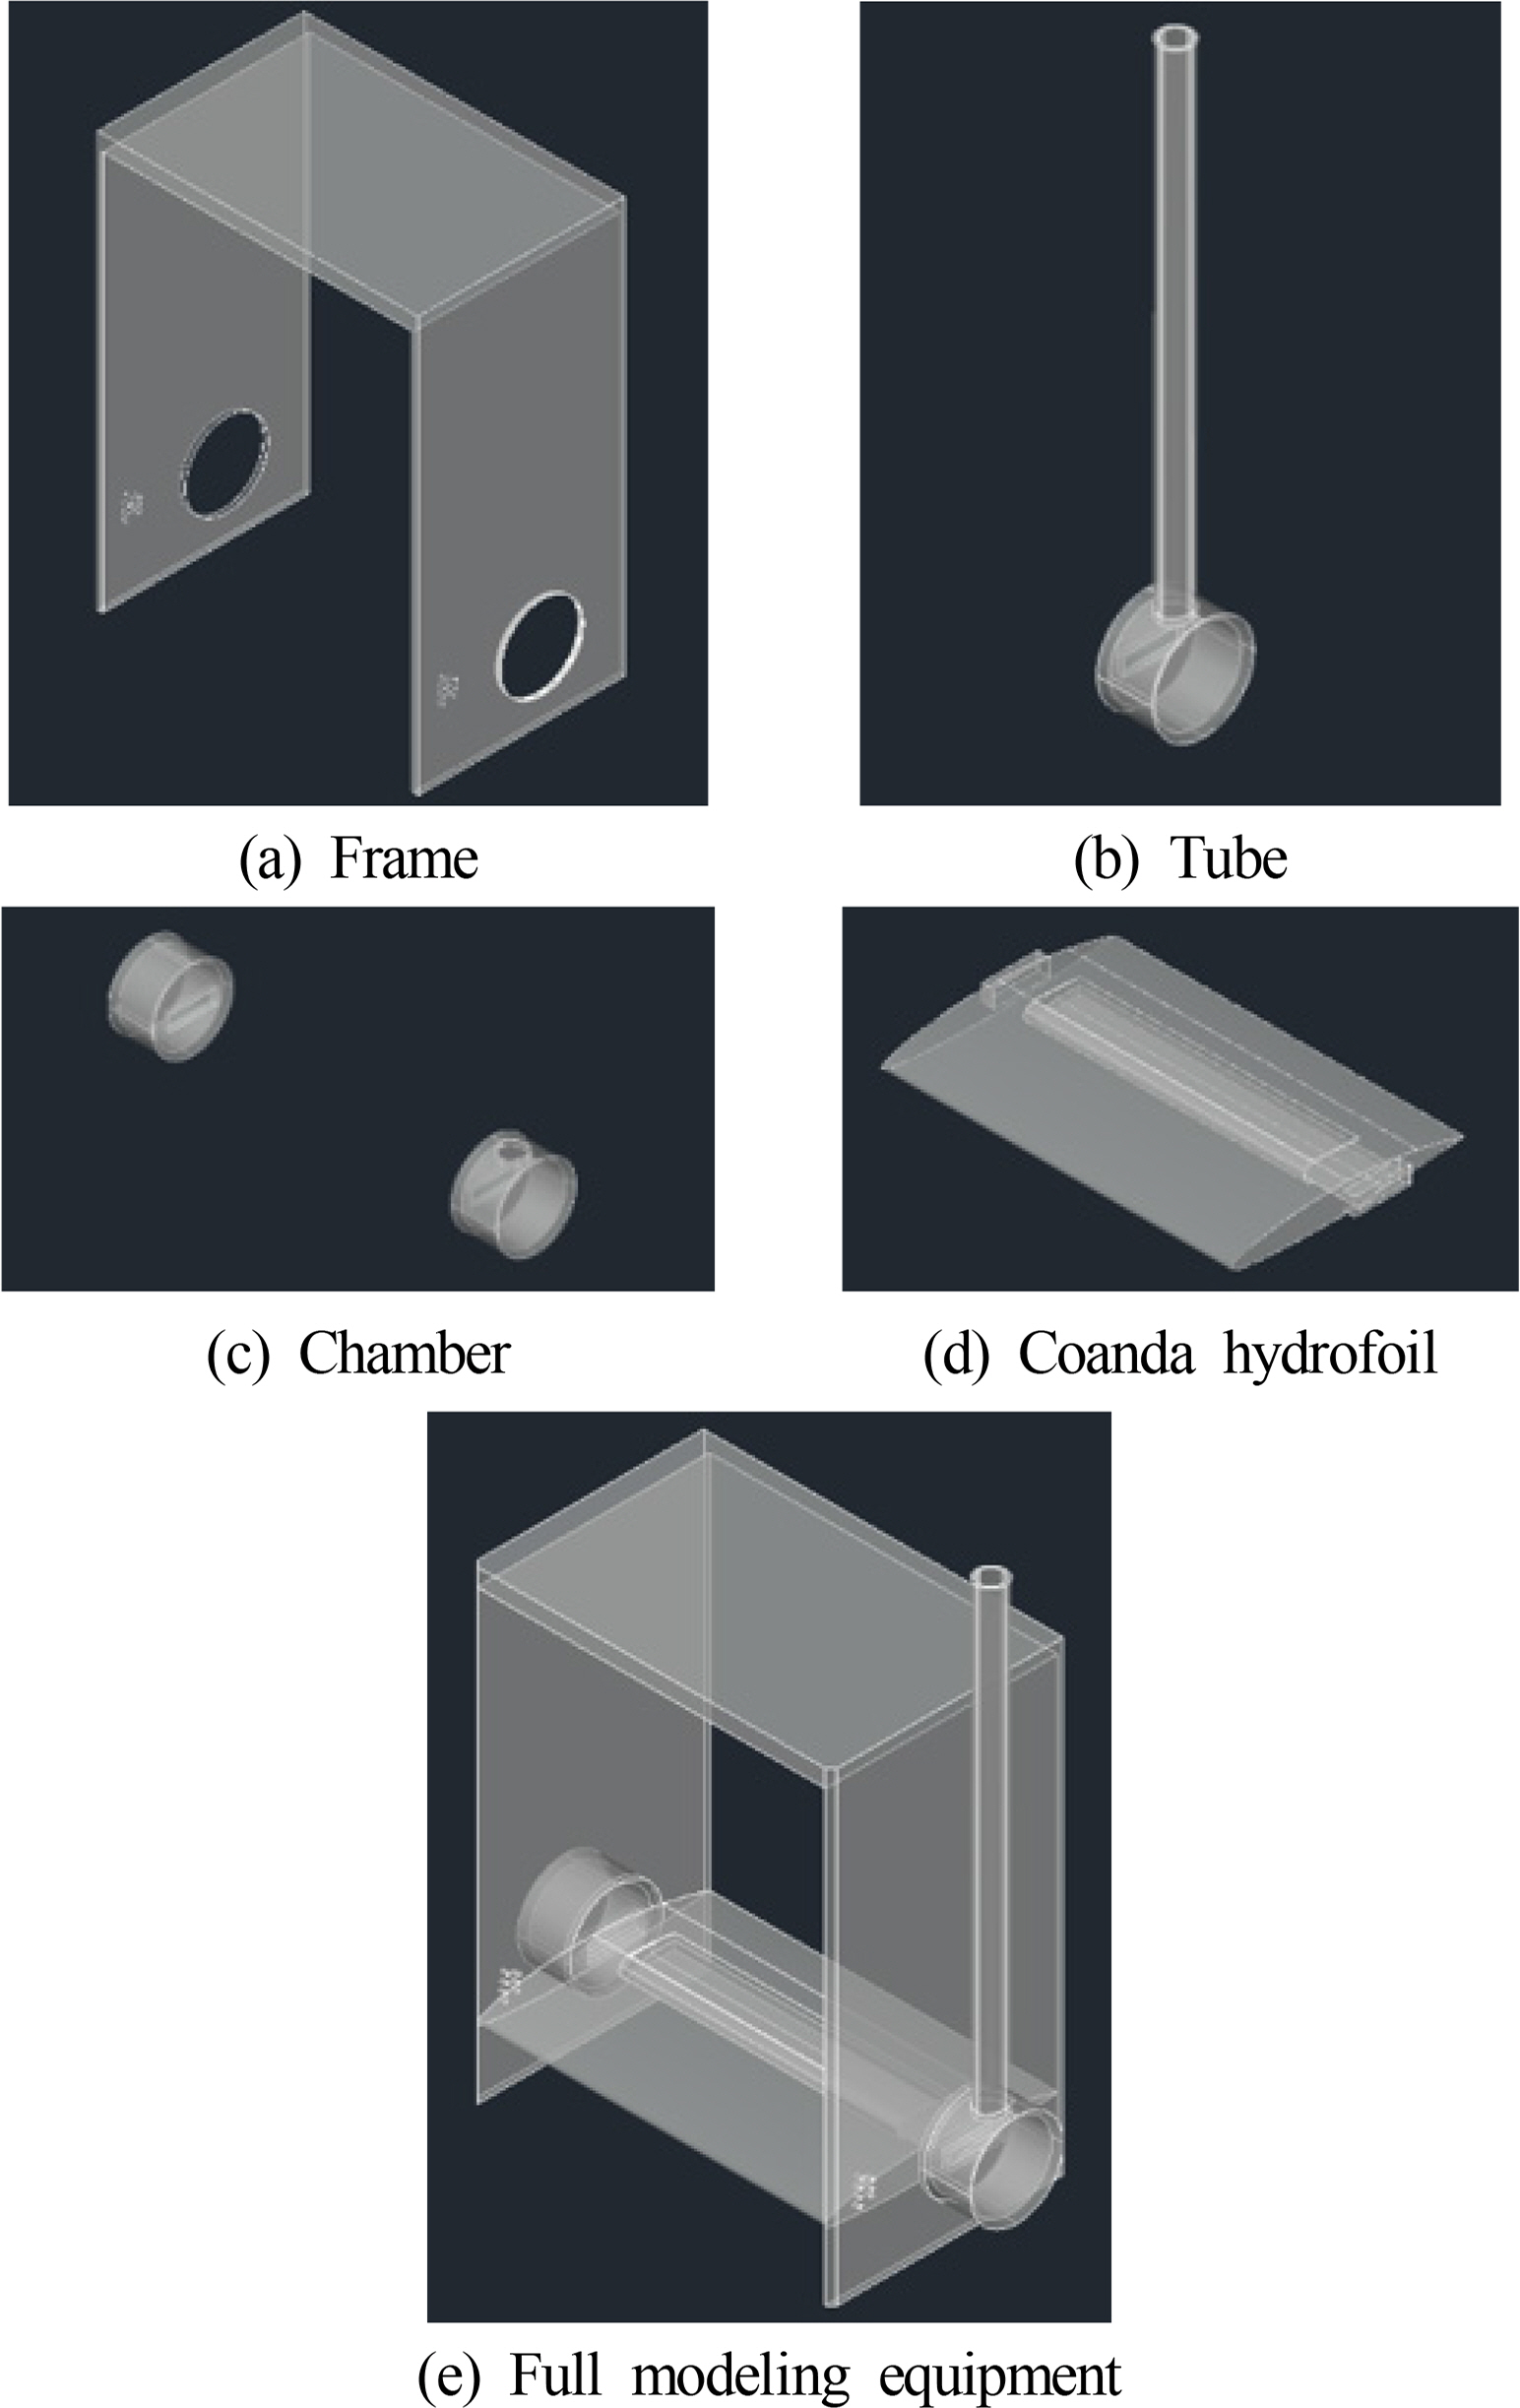
Geometry of experimental equipment

Geometry of Coanda hydrofoil for experiment and numerical simulation
2.2 Numerical Analysis and Conditions
In this study, we used STAR-CCM+ v13.06, a commercial program, to conduct the numerical analysis. An unsteady incompressible turbulence flow was selected as the condition of the numerical analysis, and a continuous equation and Reynolds-averaged Navier-Stokes (RANS) equation were considered as governing factors, as shown in Eqs. (1)–(2) below, respectively:
SST k-ω was used for the turbulence model. The SST k-ω model is a hybrid that combines the k-ε model with the k-ω model according to the characteristics of the flow field, and this model is usually considered when analyzing the turbulent flow phenomenon such as a propeller wake.
To implement a free surface, we used the volume of fluid (VOF) method, which a typical method applied used to implement free surfaces. The VOF method belongs to the class of Eulerian methods, is capable of implementing a multi-phase flow, and is suitable for implementing flat free surfaces of wide range, such as a free surface around a vessel. The VOF method uses the phase volume fraction concept to define the proportion of fluid in a grid, thereby classifying the phase to track the interface between phases.
Because the experimental equipment has asymmetry, the experiment was repeated many times to accurately measure the lift and drag. In addition, a numerical analysis was conducted by including the experimental equipment for an accurate comparison of the resulting values. Because the pump had a fixed output, the flow rate of the spray was adjusted by opening the level of the middle valve, and the jet momentum coefficient was reverse-calculated by attaching a hydraulic system to the tube connected to the hydrofoil and measuring the fluid pressure. After analyzing the experimental results, a numerical analysis was conducted under the same conditions using a reverse-calculated jet momentum coefficient. Fig. 4 illustrates the grid system used during the numerical analysis. For a comparison with the experimental results, the numerical analysis included the free surface and other experimental equipment, thereby applying approximately 6.4 million grids. The volume of jet spray is determined using Eq. (3), which shows the jet momentum coefficient:

Grid system around the experimental equipment
For a numerical validation, we conducted experiments and a numerical analysis using a normal hydrofoil, in which the internal geometry including the slit does not exist, and a Coanda hydrofoil, which facilitates the jet spray. The inflow rate was set to 2 m/s, and the experiment and numerical analyses were conducted by changing the angle of attack.
2.3 Results of Experiment and Numerical Analysis
Figs. 5 and 6 show the results of the experiment and numerical analysis. The experiment using the normal hydrofoil, in which a jet was not sprayed, was conducted after removing the tube that injects water. Fig. 5 shows the lift and drag coefficients by the angle of attack, and the experiment on the normal hydrofoil was conducted from zero to 6°. The resulting trend between the experiment and the numerical analysis was quite consistent, although the numerical analysis showed higher values in the lift and lower values in the drag. Thereafter, the same trend was shown in the results of the Coanda hydrofoil, in which a jet was sprayed.

Comparison of Normal hydrofoil performance between experiment and numerical simulation
Comparison of Coanda hydrofoil performance between experiment and numerical simulation
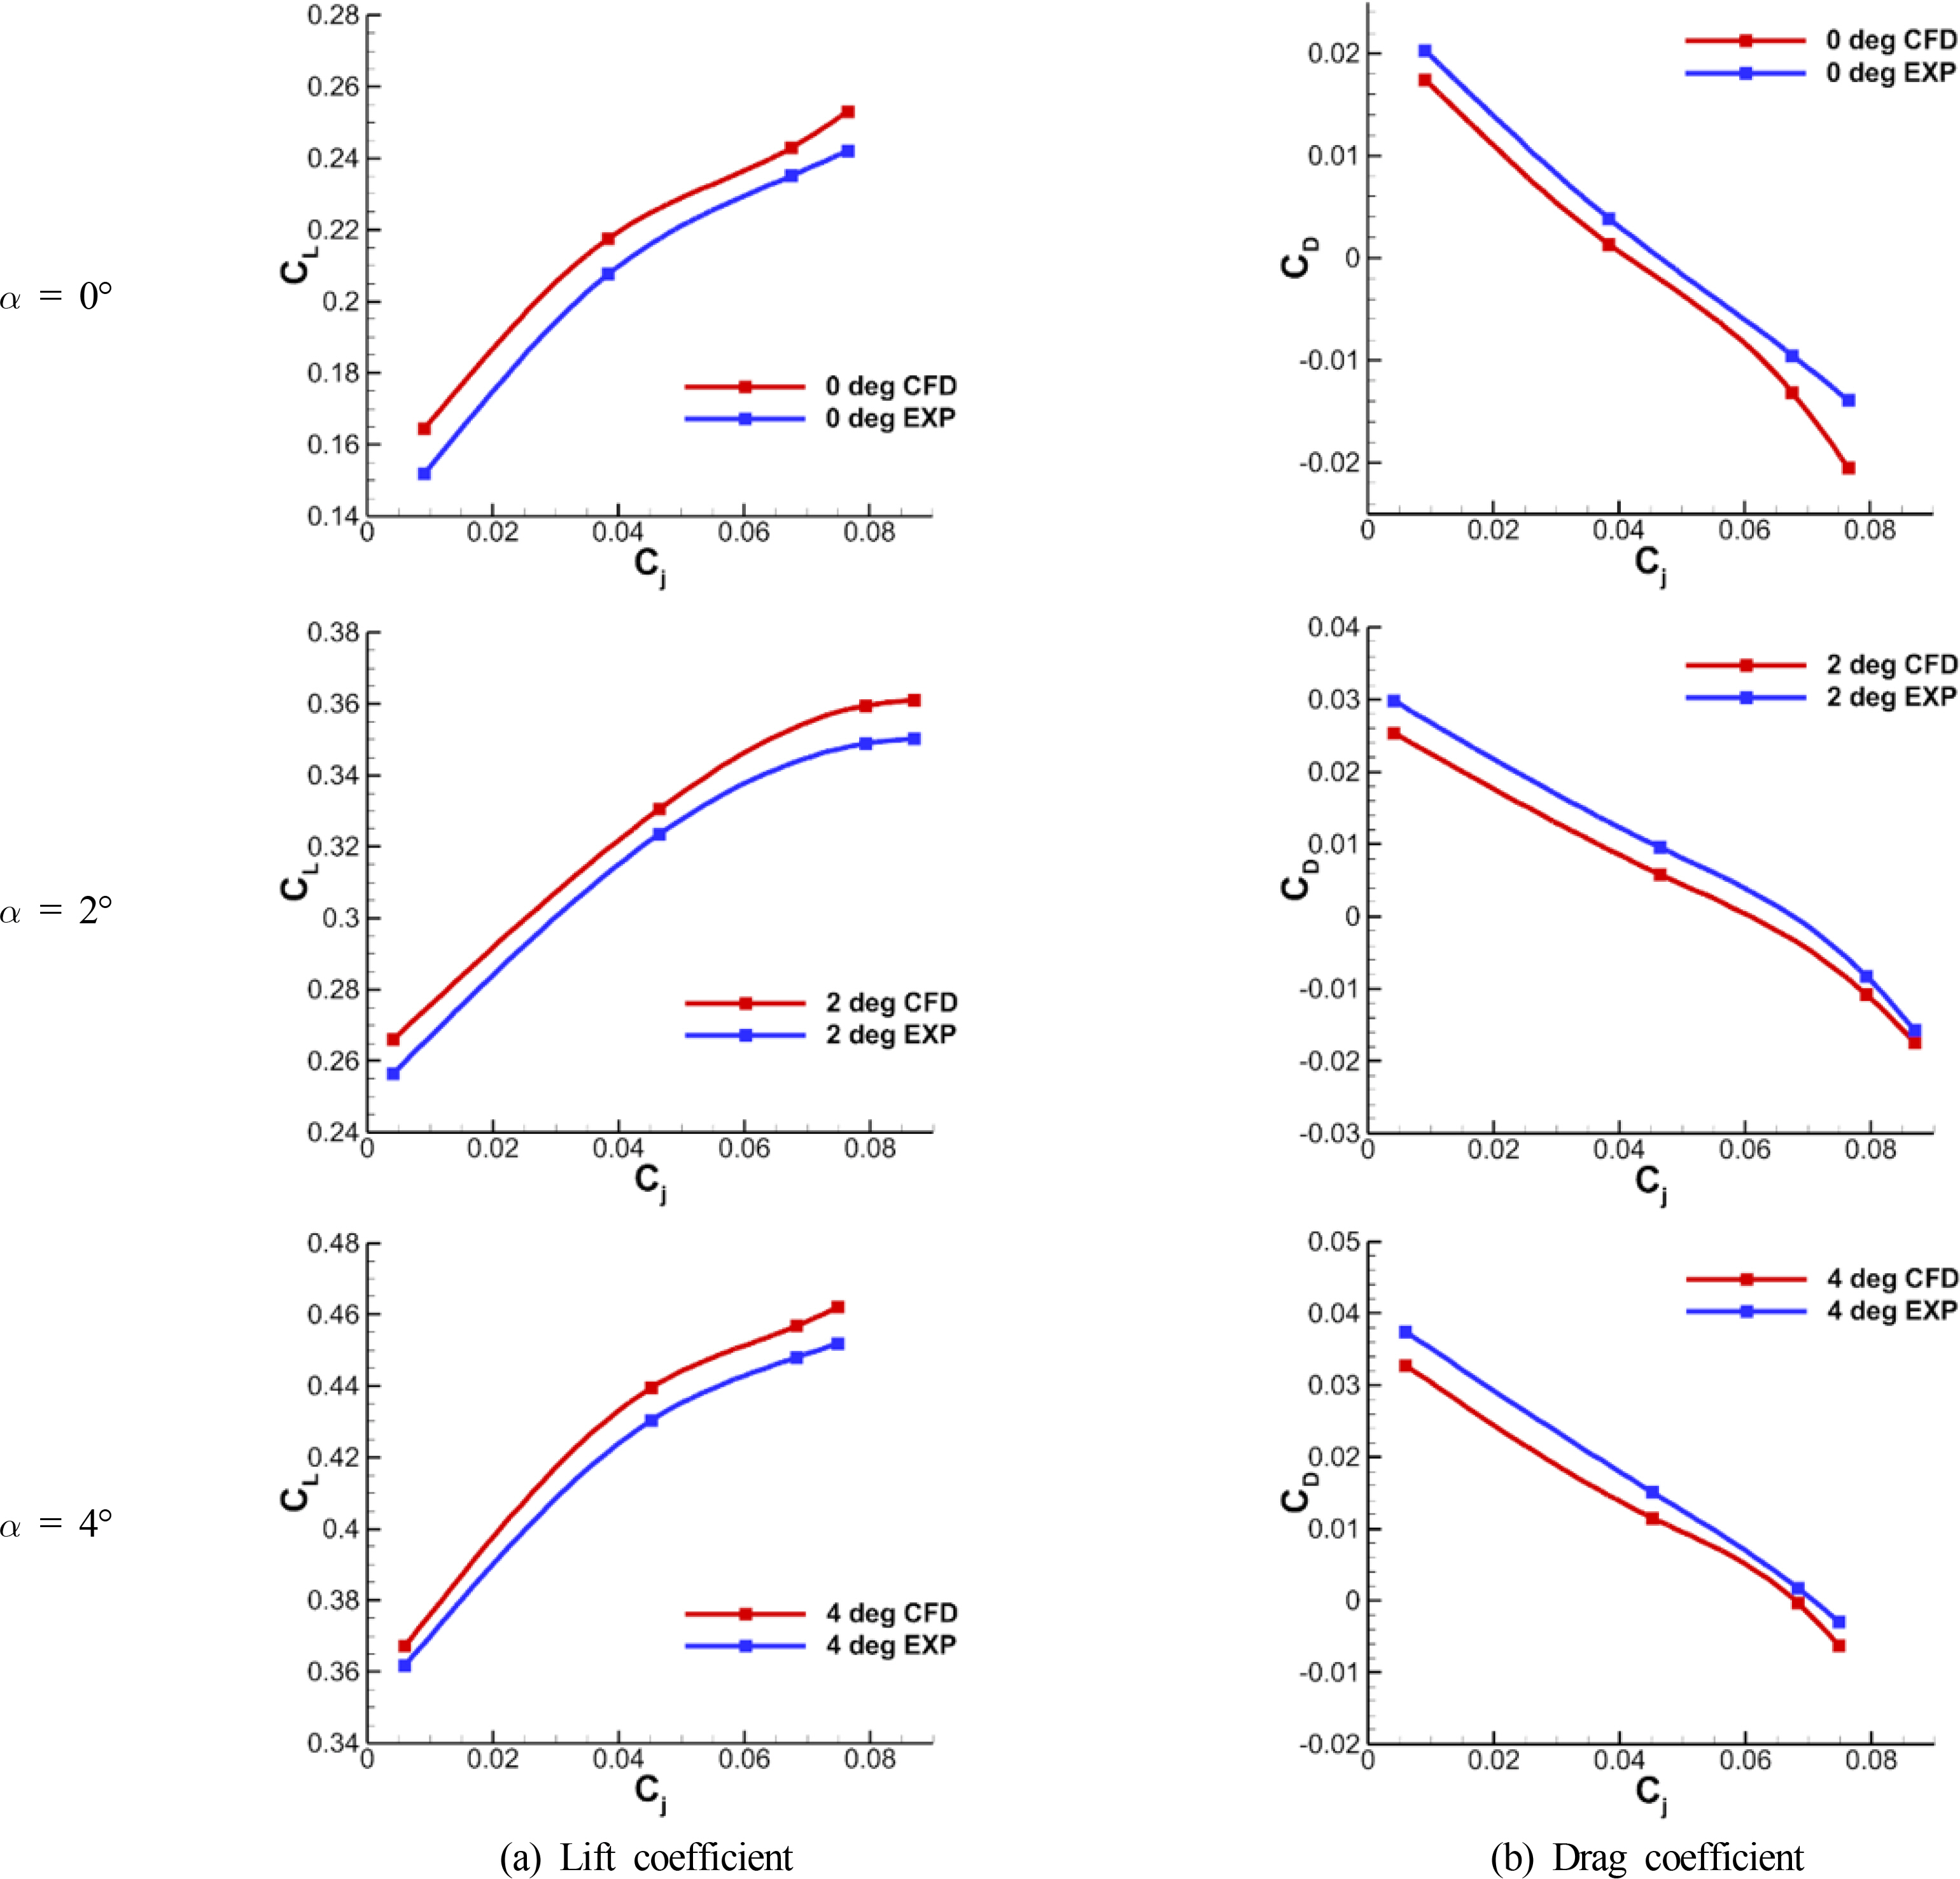
The experiment on a jet spray was conducted at angle of attack of zero, 2°, and 4°, and Fig. 6 shows the change in lift and drag forces based on the angle of attack and jet momentum coefficient. As mentioned above, the flow rate was adjusted by opening the level of the middle valve because the output of the pump could not be controlled in the experimental equipment. Hence, the jet momentum coefficient by the angle of attack was not constant. Because the drag converged to zero owing to the propulsion by the jet spray, its error rate was difficult to show. In the case of lift, by contrast, the error rate was generally less than 5%.
The Reynolds number under the conditions of the present experiment and the calculation was approximately 4.5 × 10⁵, corresponding to a transition flow regime. However, the jet flow rate under the conditions of the experiment and numerical analysis was 7.3 m/s at maximum, at which the Reynolds number was 1.64 × 10⁶, corresponding to a turbulent flow regime. Therefore, the fully turbulence model was selected, and when the results were compared, a same trend was shown in the lift and drag, respectively, for all angles of attack and Cj.
The above results demonstrated that the Coanda effect induced changes in the lift and drag characteristics, which were analyzed using a numerical analysis and were found to be sufficiently reliable; based on this result, using an additional numerical analysis, a study was conducted on a variety of spraying conditions.
3. Optimization of Slit Geometry
The numerical analysis was used to analyze the performance variation of the Coanda hydrofoil based on the height of the spraying slit (hS ), the height of the tip (hT ), and the position of the slit. Fig. 7 shows the calculation domain and the grid system of the numerical analysis used for a performance comparison between the slit geometries.
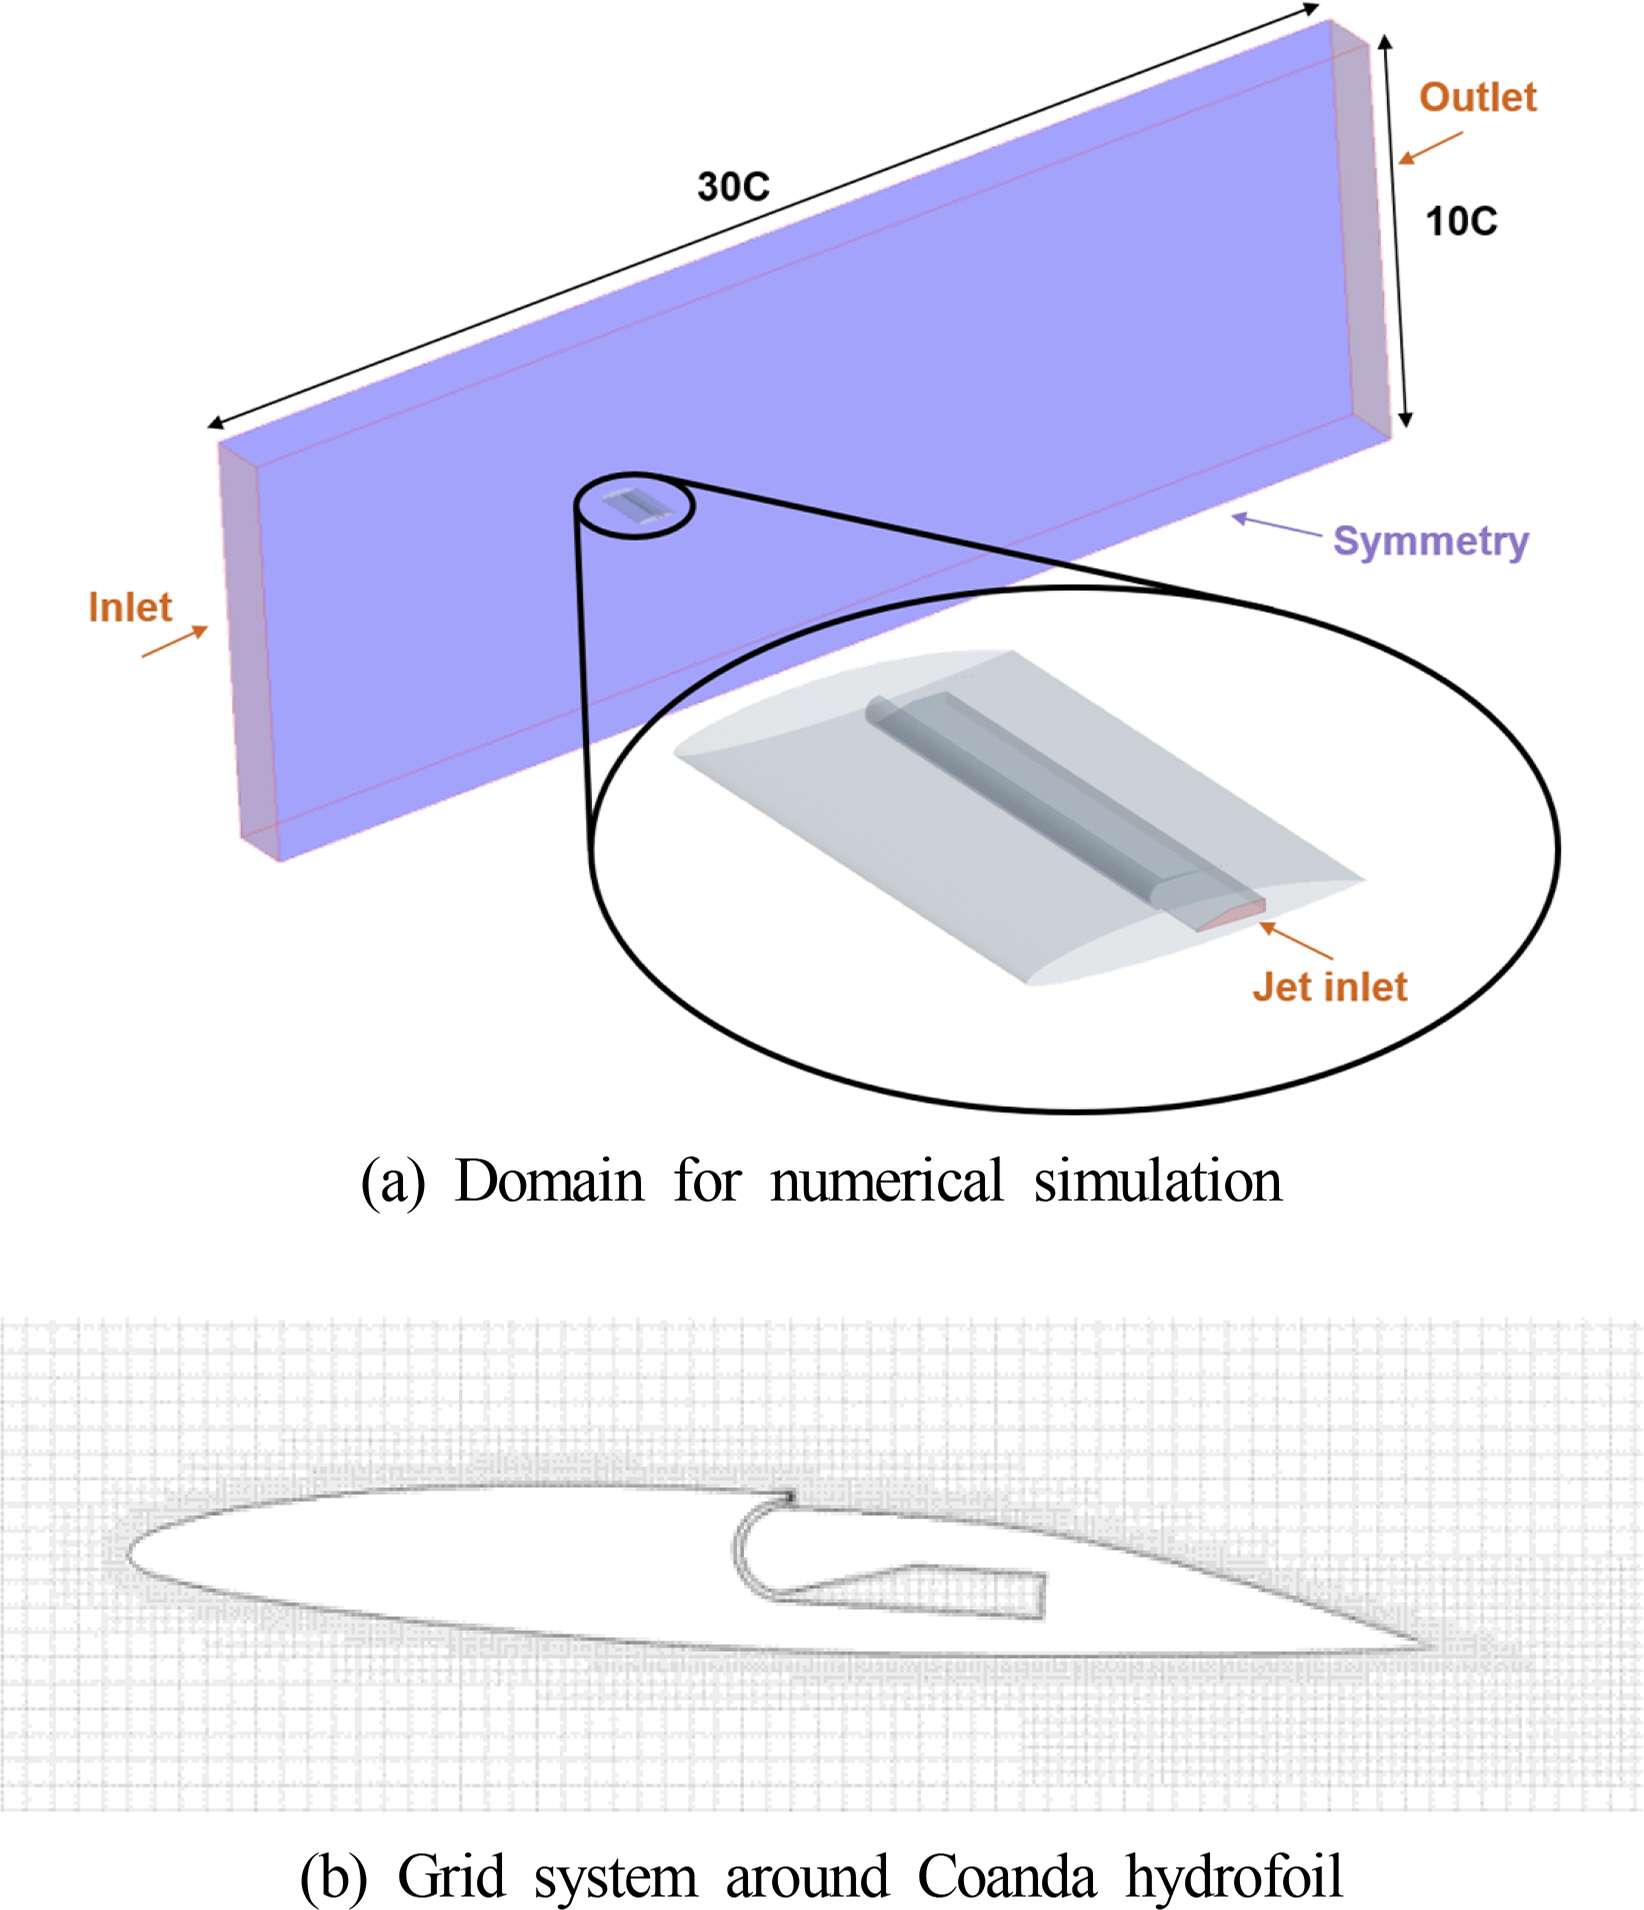
Domain and grid system of numerical simulation for performance analysis according to the slit shape
The spraying range of the jet was 80% of the span direction as in the experiment, and a two-dimensional calculation was conducted by assigning a symmetry boundary condition for both sides of the hydrofoil. However, considering that the water must flow in from one side when the jet is actually sprayed on the hydrofoil surface, we applied the inlet boundary condition to the left part of the hydrofoil. The basic geometry of the hydrofoil was identical to that of the experiment and based on the comparison between the numerical and experimental results, we created a grid system excluding the experimental equipment, in which approximately 2.9 million grids were used.
3.1 Performance Variation by Slit Height (hS )
The geometry conditions considered to analyze the effect of the slit height were hS = 0.003C, 0.005C, and 0.007C, and the calculation condition was Cj = 0.02–0.1. Under all conditions, the angle of attack was 4°, the flow rate was 2 m/s, and the diameter of the tip was 0.5 hS . Fig. 8 shows the performance variation by the slit height. As the slit height decreases, the lift tends to increase overall, and in the case of drag, the slope changes according to the slit height. In general, CL/CD is usually considered when analyzing the performance of a hydrofoil, whereas in the case of a Coanda hydrofoil, it is inappropriate to use CL/CD for the analysis because the propulsion by jet spraying can be higher than the drag of the hydrofoil. Because the drag has a negative value in most of the above calculation conditions, CL/(1+CD ) was used to analyze the trend of the lift according to the drag. Although it does not have much physical meaning because a constant was introduced, the change in lift by the drag can be easily checked.
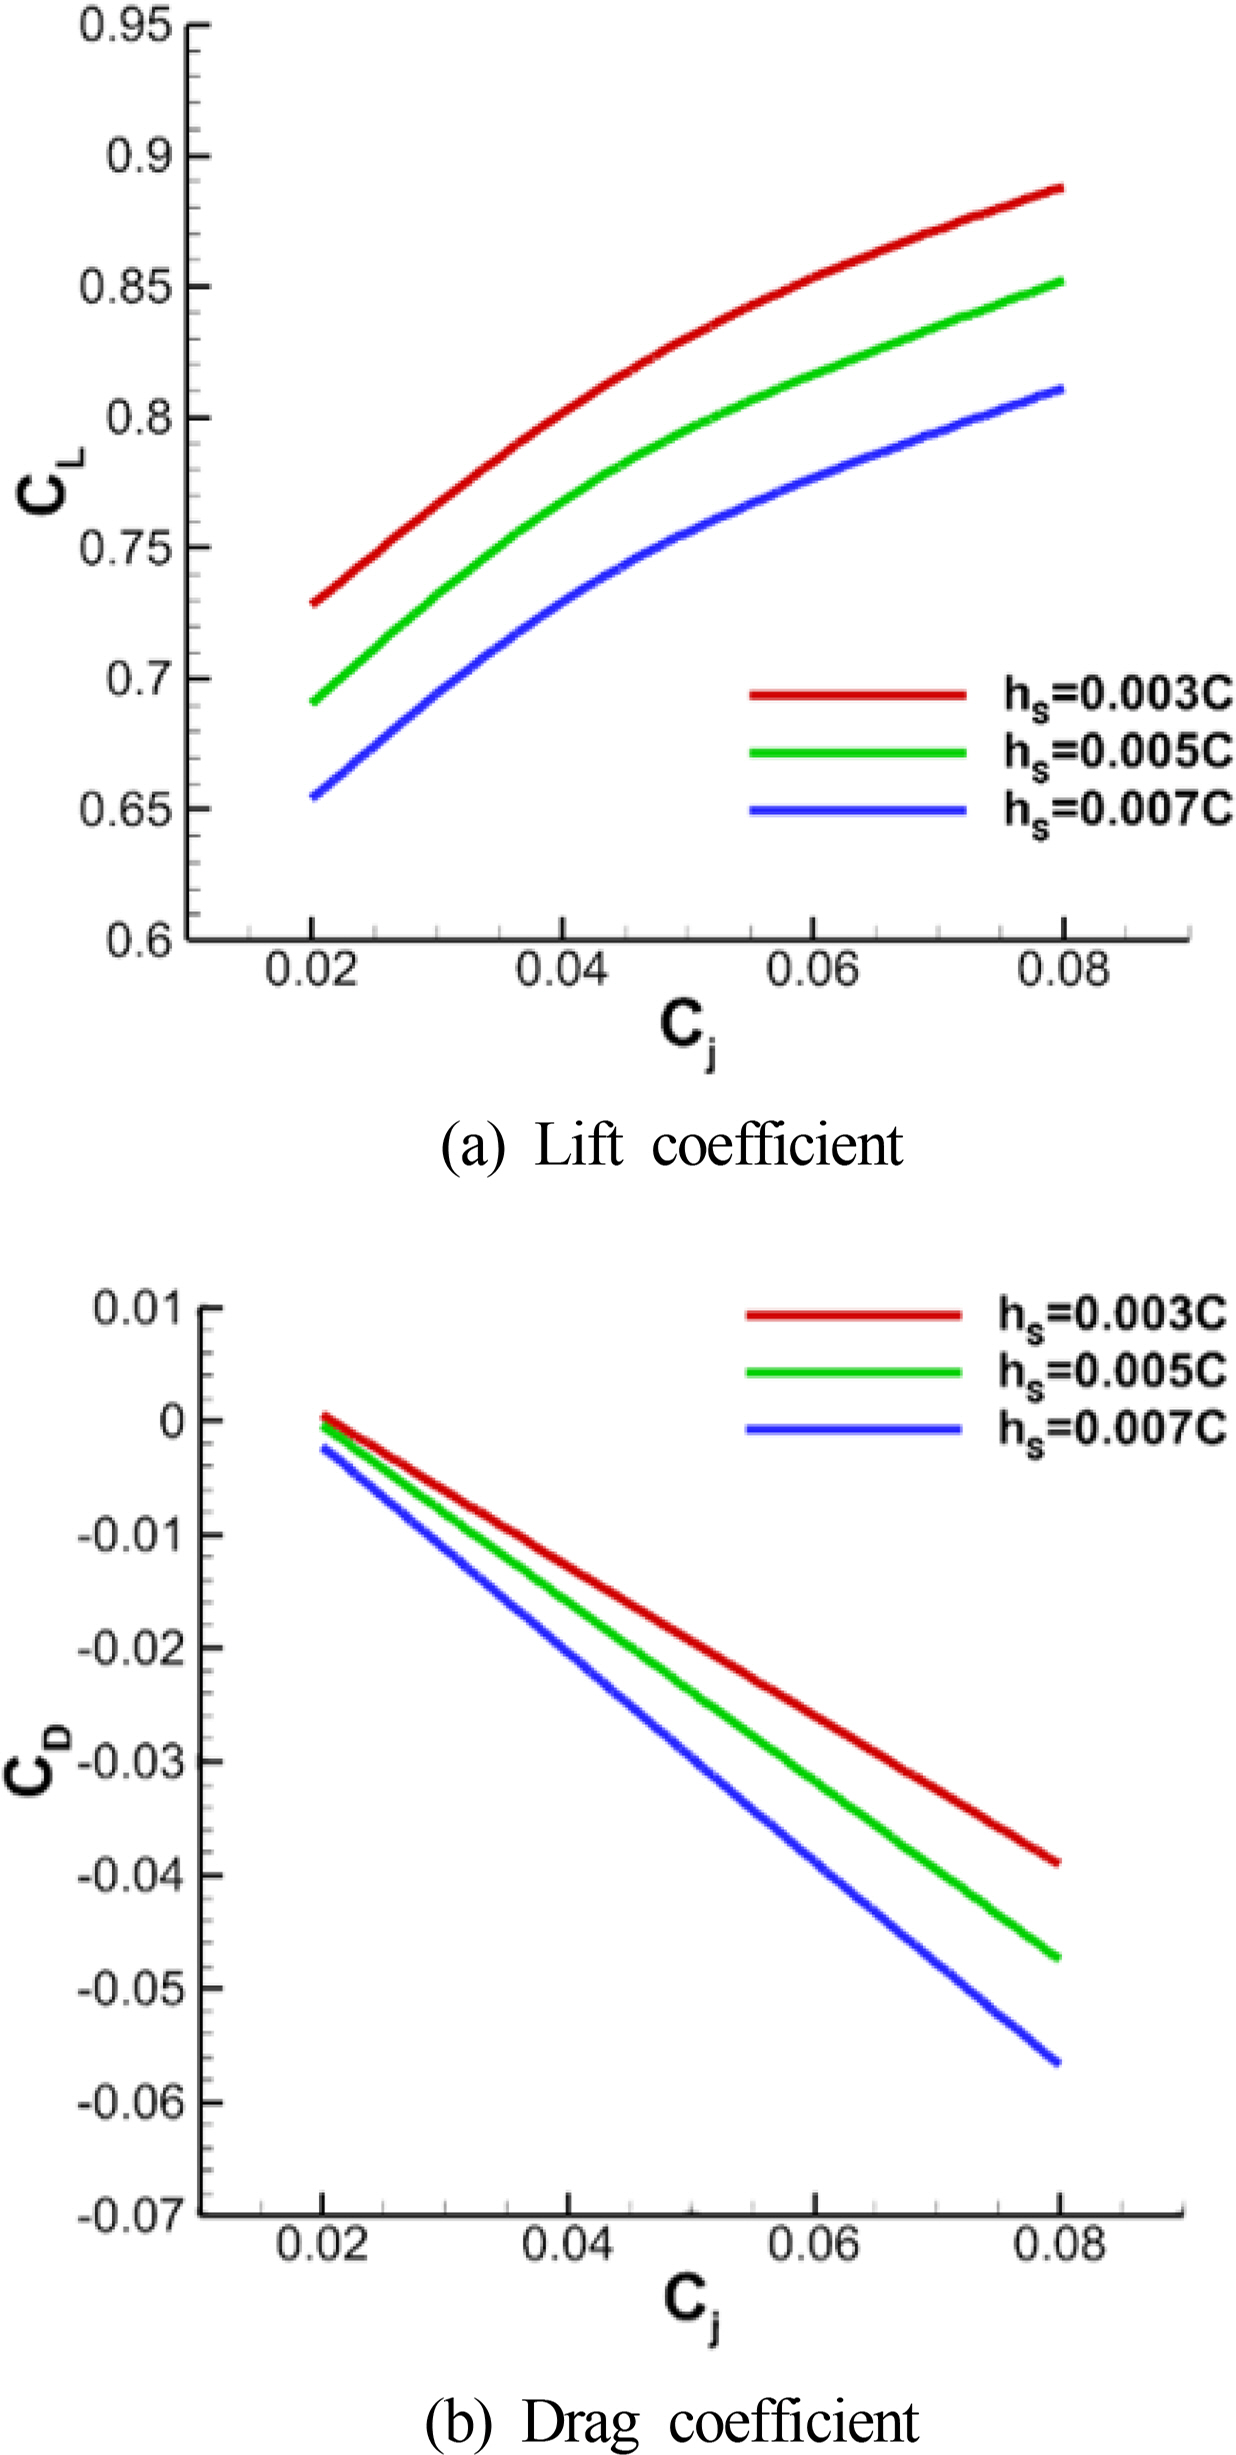
Lift and drag performance according to slit height (α= 4°)
Fig. 9 shows the trend according to the jet momentum coefficient and CL/(1+CD ). It demonstrates that, as the slit height decreases, the performance of the hydrofoil increases according to the jet sprayed. Therefore, the slit height was fixed at hS = 0.003C in the numerical analysis hereafter.

Variation of lift and drag ratio according to slit height (α = 4°)
3.2 Performance Variation by Tip Height (hT )
In this study, hT = 0.25hS, 0.50hS, and 0.75hS were used as the geometry conditions to analyze the performance variation by the height of the tip, and Fig. 10 illustrates the change in the hydrofoil performance according to the tip height. The variation in performance based on tip height was relatively simple: As the tip height decreased, the lift increased, and the drag decreased. The thickness of the tip may affect the Coanda effect of the jet sprayed from the slit (Yoon et al., 2012), and if the thickness of tip increases, a part of the jet, which should flow along the hydrofoil surface, may flow in the tip direction, thereby reducing the lift and drag performance from the Coanda effect. Therefore, hT was set to 0.25hS in the rest of this study.
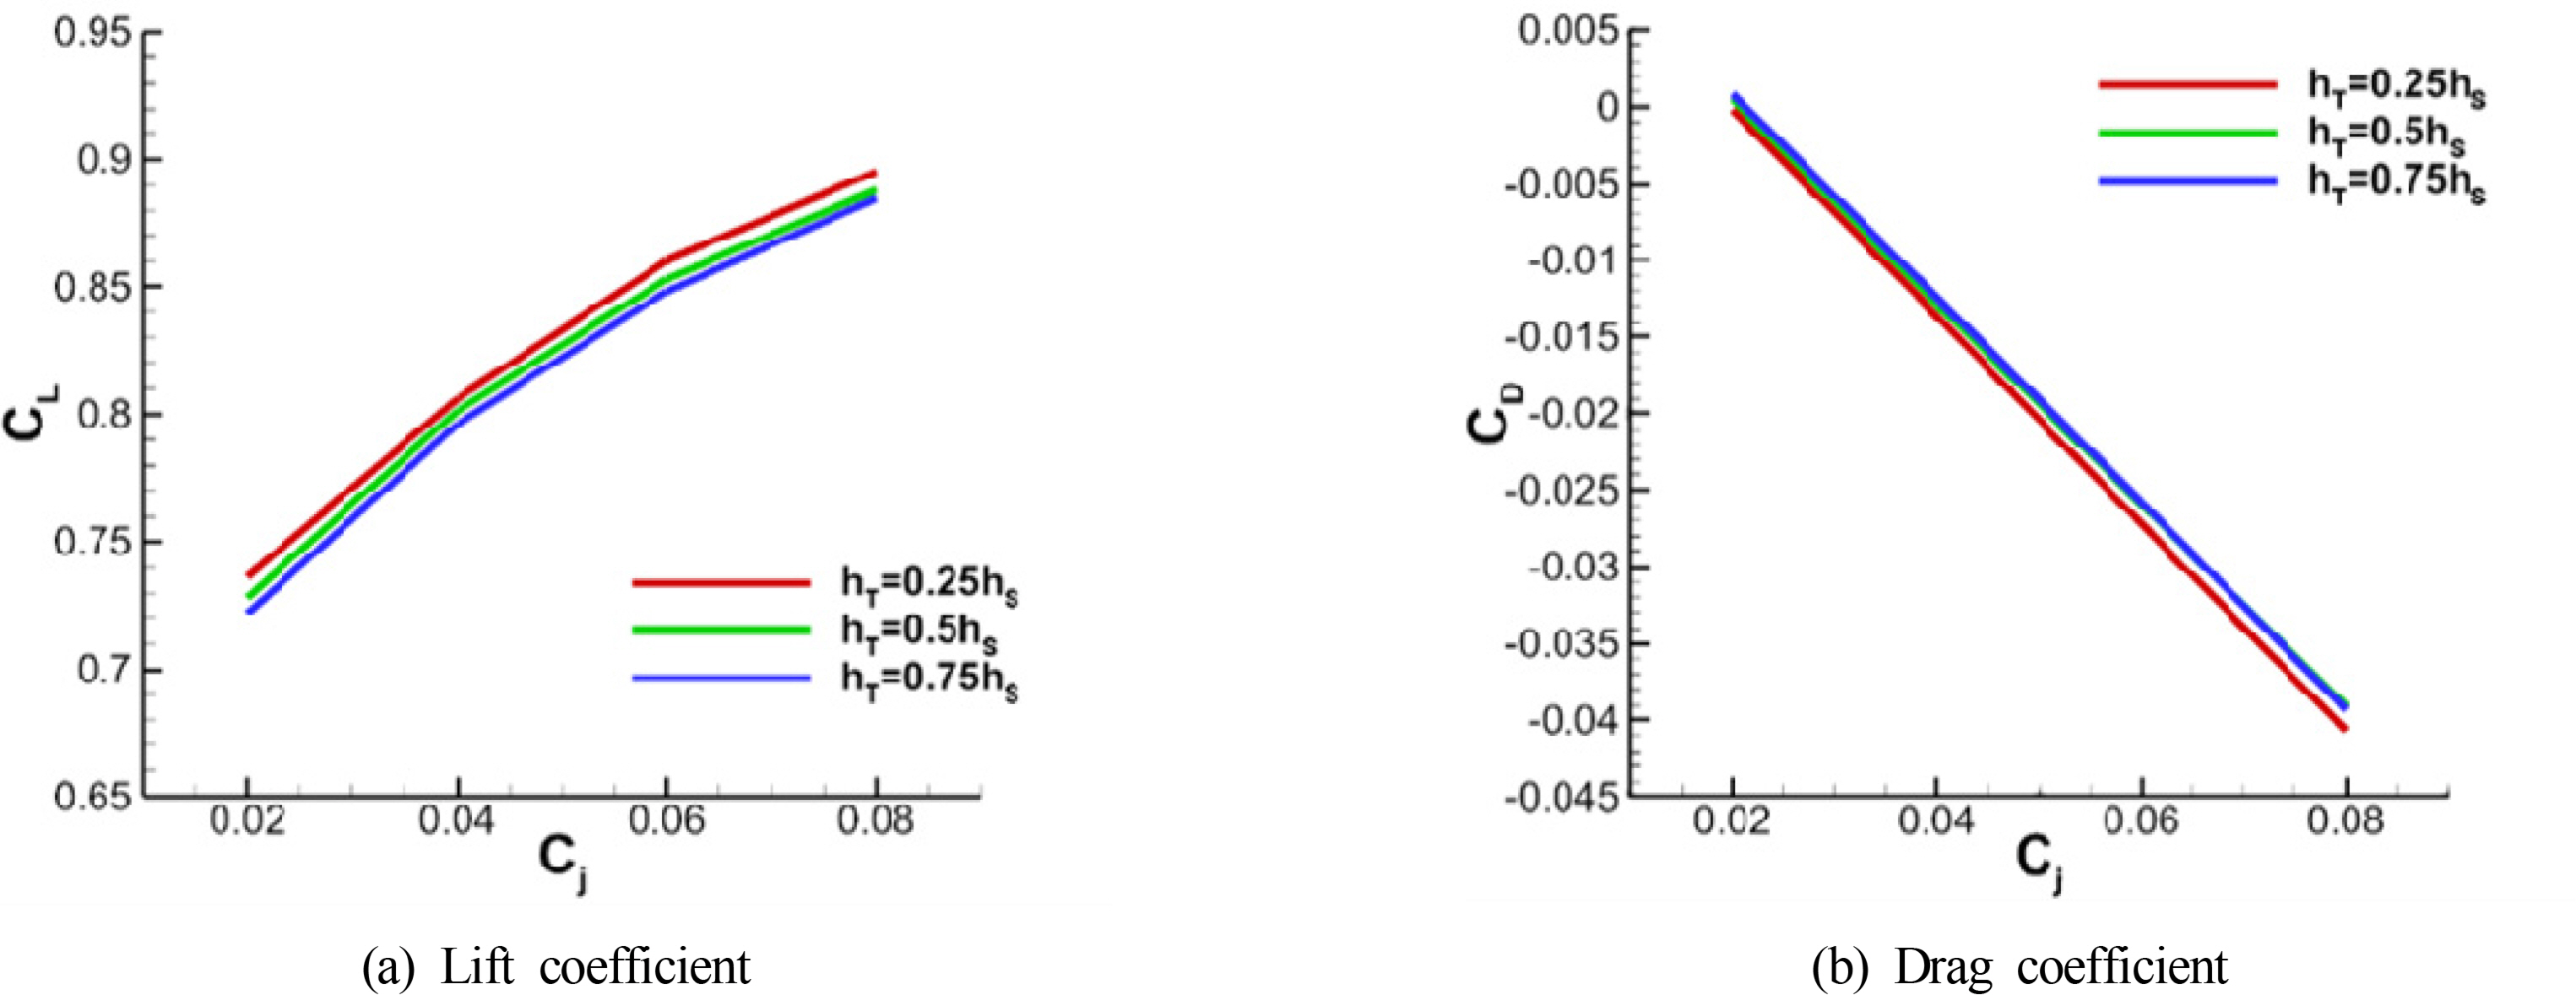
Lift and drag performance according to tip height (α = 4°)
3.3 Performance Variation by Slit Position
Previous studies have shown that the performance increases as the slit height and the thickness of the tip decrease. However, considering the actual production problem, it is recommended to select as small of a slit height and tip thickness as possible. Following a study on the slit shape, this paragraph analyzes the trend based on the hydrofoil chord direction position of the slit. The geometry conditions considered included the position of the slit at 0.1C, 0.3C, and 0.5C on the front part of the hydrofoil, and the analysis was conducted at an angle of attack, 2°, 4°, and 6°. The results are illustrated in Fig. 11.
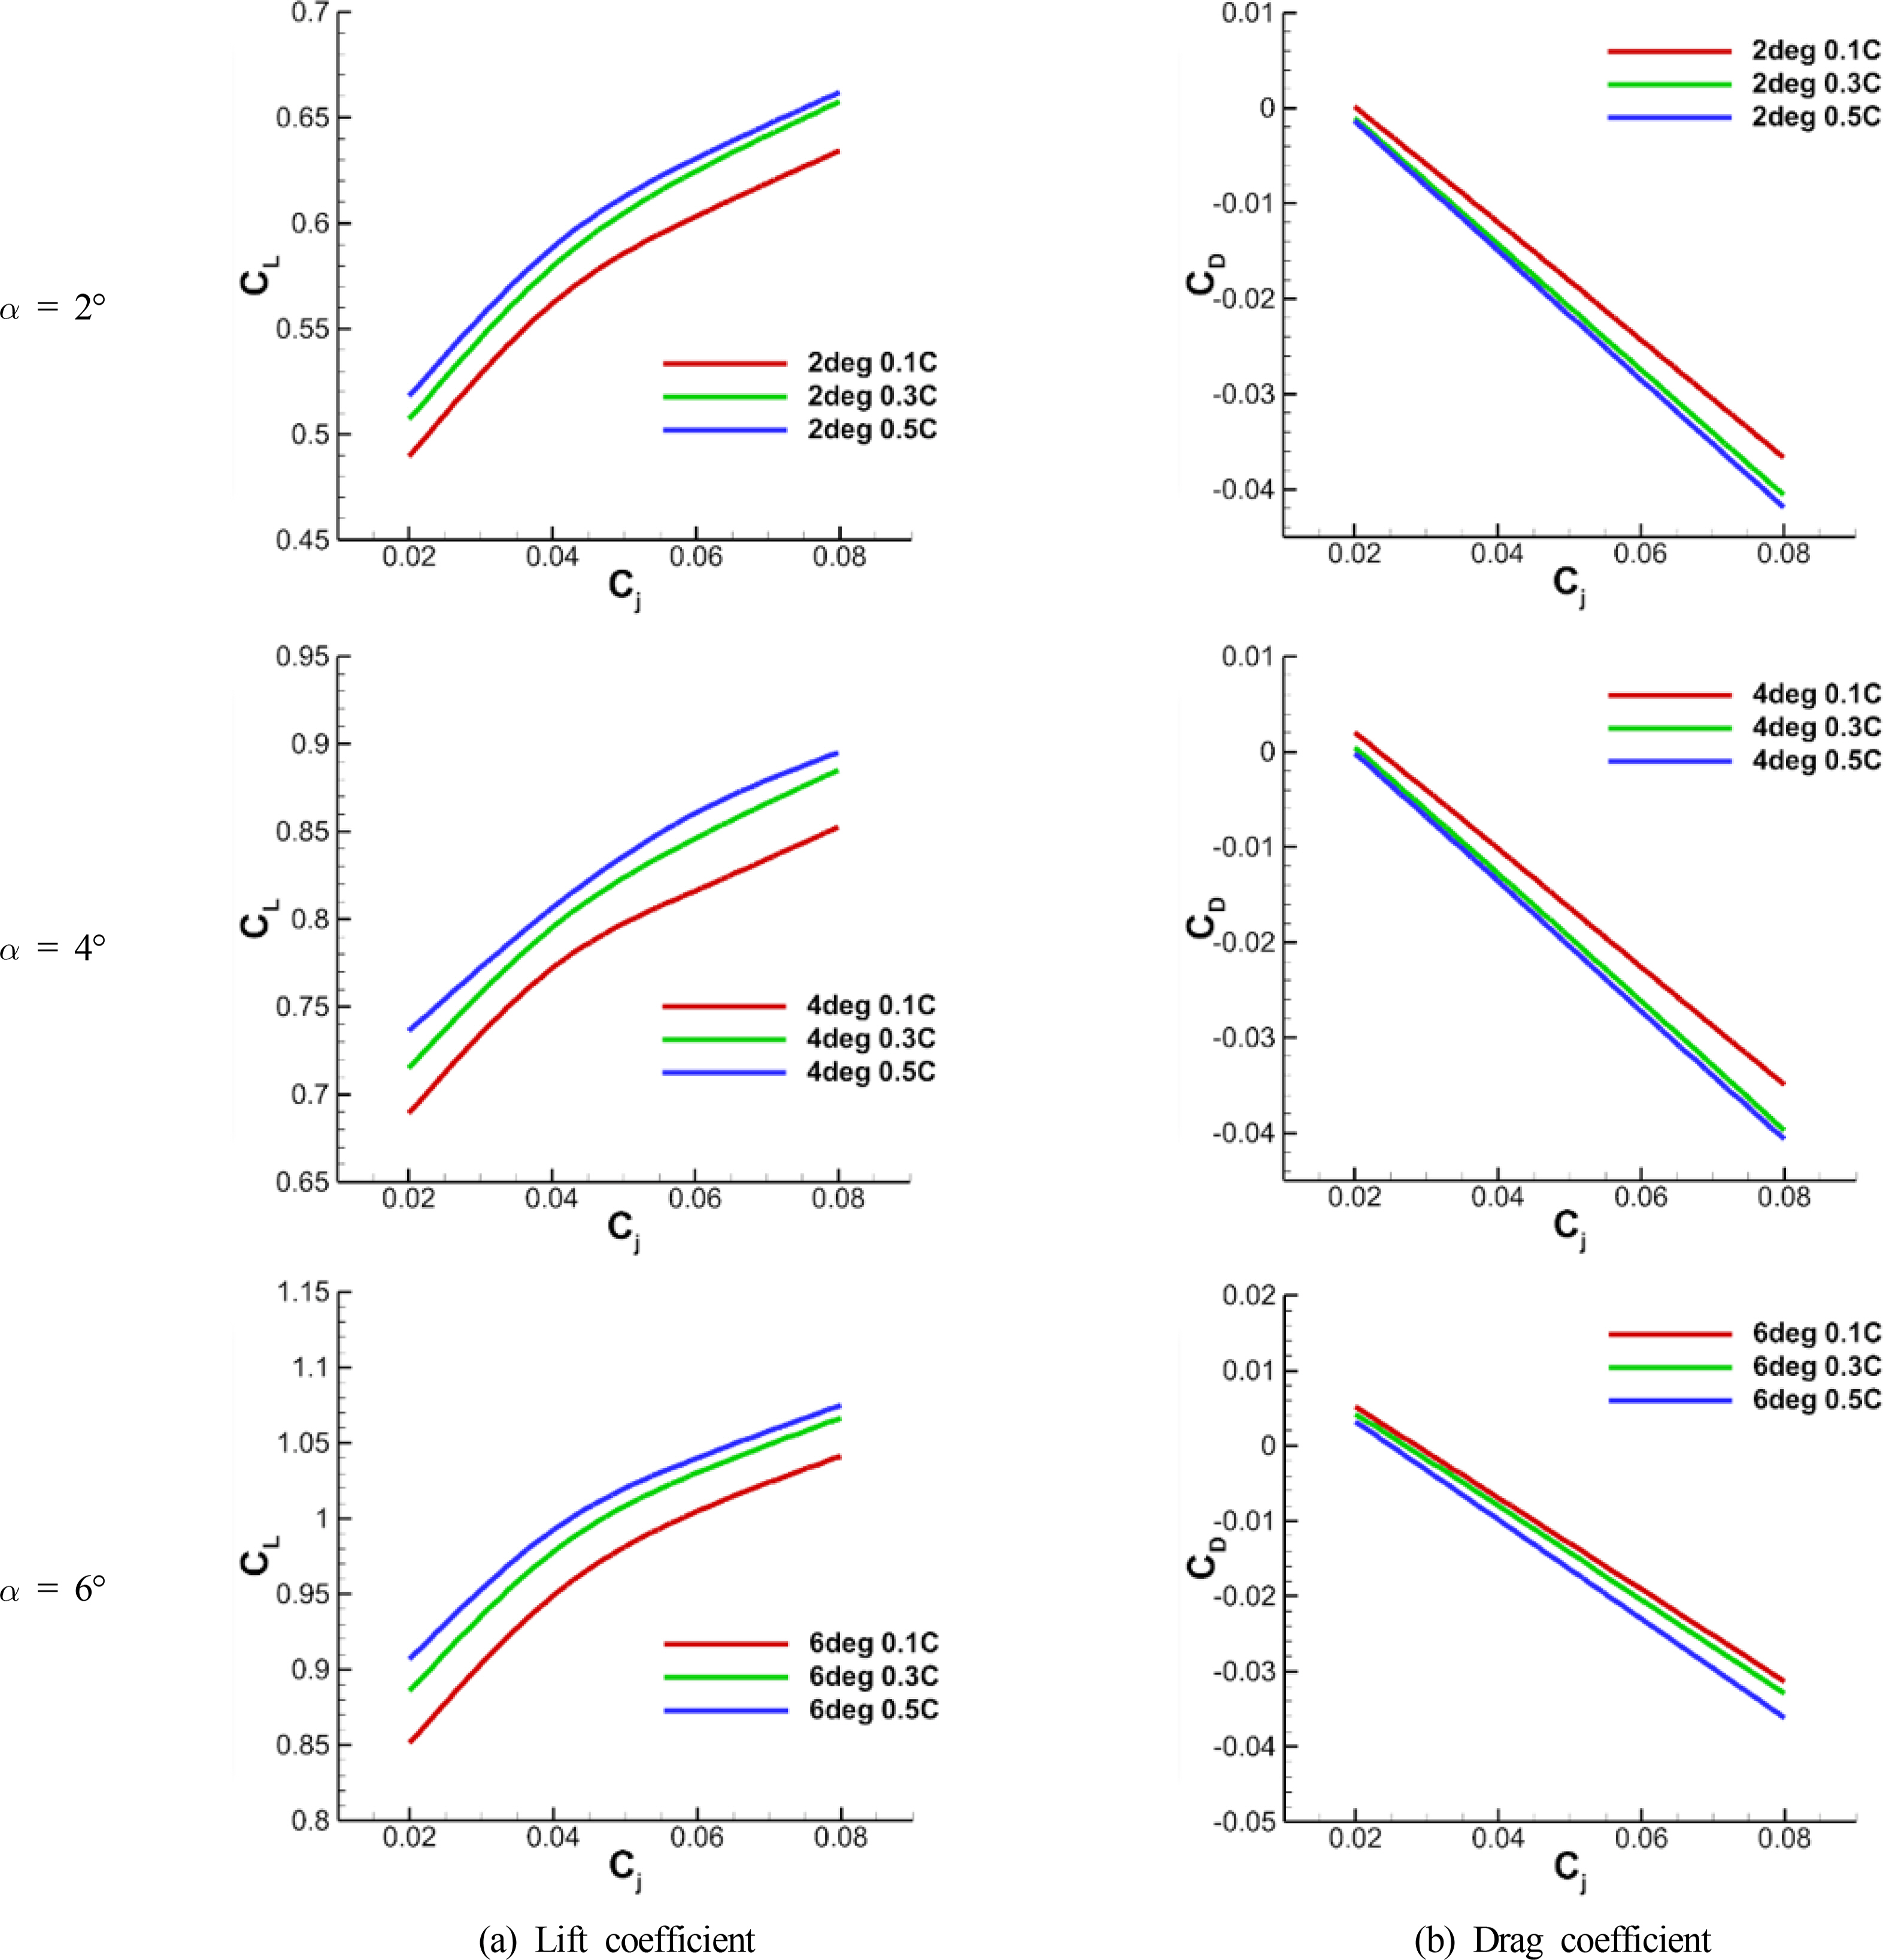
Lift and drag performance according to slit position
The results in Fig. 11 confirm that the lift is the largest and the drag is the smallest, thereby showing the best performance, when the slit is positioned at 0.5C on the front part of the hydrofoil. The condition of the slit position after 0.5C is not considered because the thickness of the hydrofoil decreases, and the cross-sectional internal geometry, which is the basis of this study, cannot be positioned. Because Eom et al. (2020) conducted a study on the hydrofoil geometry to improve the cavitation performance, the pressure distribution of the hydrofoil based on the slit position was analyzed. To compare the pressure distribution, Fig. 12 illustrates the pressure distribution on hydrofoil surface of each geometry under an angle of attack of 6° and Cj = 0.08.

Comparison of pressure distribution according to slit position (α = 6°, Cj = 0.08)
In the pressure distribution of each hydrofoil, it was confirmed that the pressure decreases significantly at x/C = 0.1, 0.3, and 0.5 owing to the jet flow at a high flow rate sprayed from the slit. Because the angle of attack and the jet spraying amount were identical, the pressure drop at the front part of the hydrofoil was similar in all three hydrofoils. In the case of 0.3C and 0.5C hydrofoils, the pressure drops occurring at the slit were similar, but in the case of the 0.1C hydrofoil, in which the slit was positioned right behind the front part of the hydrofoil, an extremely high pressure drop occurred at the slit. Based on this fact, it was determined that, in terms of the slit position, the most appropriate geometry for NACA66 (mod) hydrofoil is 0.5C, which has a relatively uniform pressure distribution as well as a higher lift and lower drag than other slit positions, with respect to all values of Cj.
4. Performance Variation According to 3D Effect and Spraying Range
An appropriate geometry of the jet slit for NACA66 (mod) was derived based on the performance variation of the hydrofoil with respect to the slit height, tip thickness, and slit position derived above, and based on this, this variation in performance according to the three-dimensional (3D) effect and the range of the jet spraying of the hydrofoil when applying the Coanda effect are analyzed in this section.
Fig. 13 shows the calculation domain used in the 3D numerical simulation. Although basically the same as shown in Fig. 7, the 3D effect was considered by assigning a size of 4S in the span direction. The geometry of the grid system is also mostly identical, but the total number of grids is approximately 3.4 million because some grids are added in the span direction.

Domain and grid system of 3-dimensional numerical simulation
4.1 Performance Variation According to 3D Effect
To analyze the 3D effect, a 3D analysis was conducted during which one side was opened in the aforementioned 2D calculation with an angle of attack of 4°. Fig. 14 illustrates the performance of the lift and drag according to the jet moment coefficient in the 2D and 3D geometries of the Coanda hydrofoil with an angle of attack of 4° and a slit range of 0.8S.
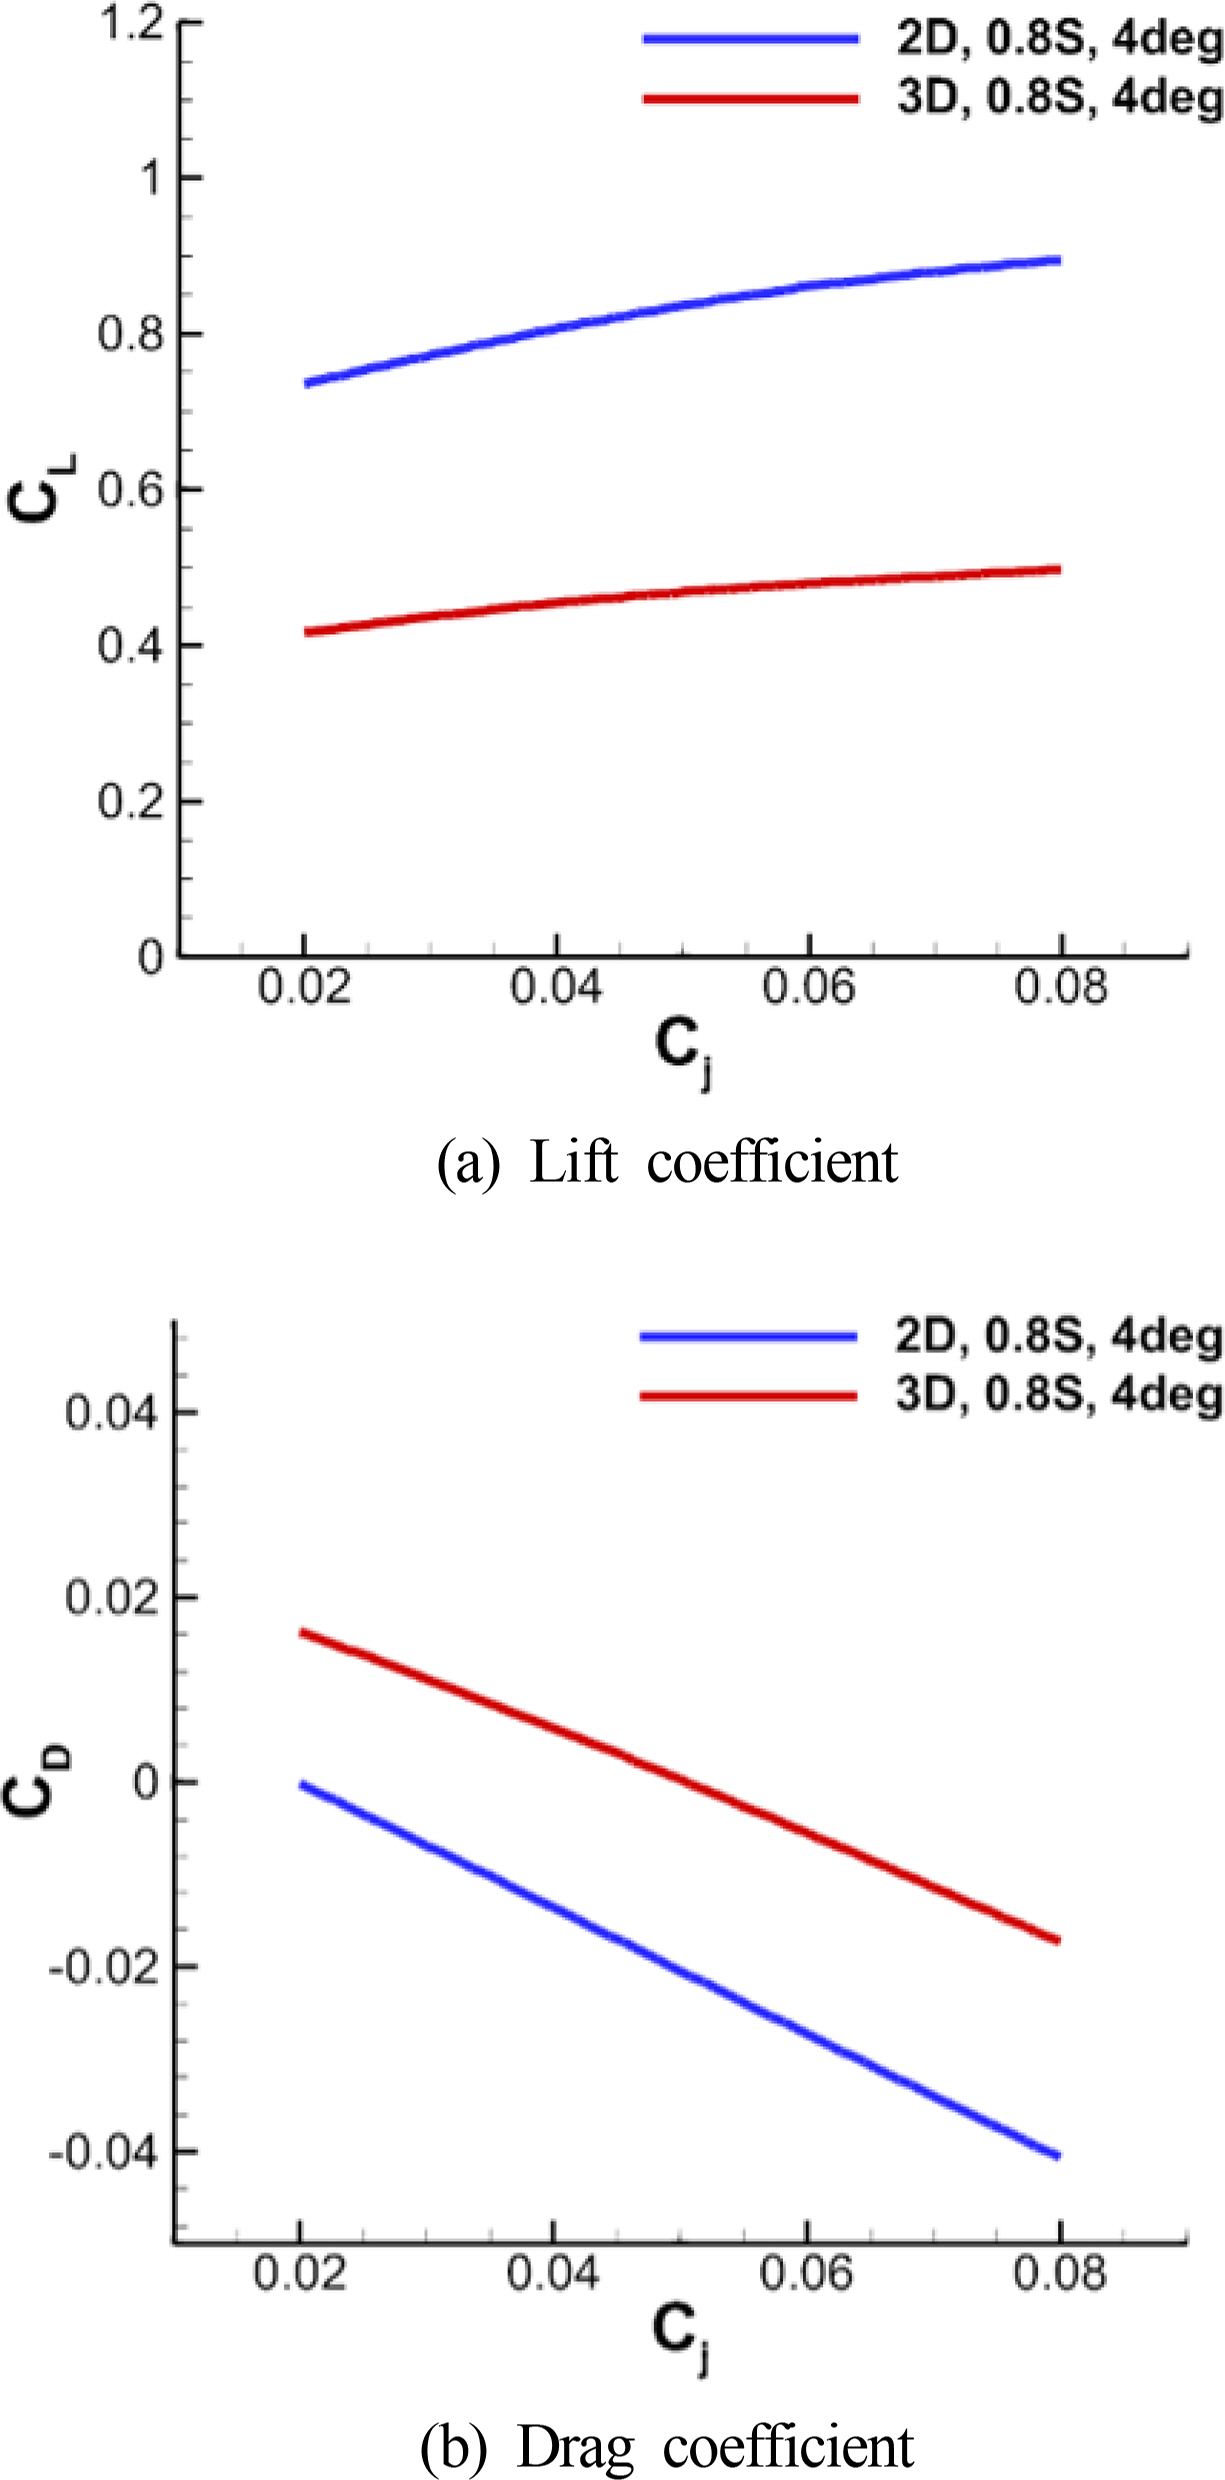
Comparison of lift and drag performance between two and three dimensional (α = 4°)
Overall, as the jet momentum coefficient increased, the lift force decreased and the drag force increased, whereby the lift force decreased by as much as about 42%. Although the geometry and spraying conditions of the Coanda hydrofoils were identical, the performance changed owing to the 3D effect because one side was opened. To analyze the causes of changes in the lift and drag forces, Fig. 15 illustrates the pressure and velocity distribution of the Coanda hydrofoil.

Flow characteristics around the Coanda hydrofoil (α = 4°, Cj = 0.06)
Fig. 15 shows comparisons of the pressure distribution, x-direction velocity, and y-direction velocity distributions between 2D and 3D Coanda hydrofoils. First, the 2D hydrofoil shows that the pressure distribution is formed relatively high compared to the 3D hydrofoil. In the case of the 2D hydrofoil, as confirmed in the x-direction velocity distribution, the direction of all flows at the upper part of the hydrofoil changes owing to the hydrofoil. In the case of a 3D hydrofoil, by contrast, the flow is reduced owing to the hydrofoil because of the 3D effect in the lateral direction of the hydrofoil. Thus, the pressure distribution is different between the 2D and 3D hydrofoils.
In the case of a 2D hydrofoil, the x-direction velocity distribution is uniform on the front part of the hydrofoil because the flow coming in is constant. Furthermore, because the water flows in and is delivered in the y-direction in the tunnel inside the hydrofoil, the x-direction flow rate sprayed from the slit is pushed to the span direction, thereby producing a difference in velocity. In the 3D calculation, the velocity distribution in the x-direction shows that the inflow changes velocity in the span direction, and the jet at the tip of the hydrofoil shows that the pushing phenomenon of the span-direction increases, thereby producing a strong jet flow around a side of the hydrofoil. In the velocity distribution of the 3D calculation in the y-direction, a strong vortex occurs at the side of hydrofoil, inducing the velocity in this direction, and this effect affects the jet spray, which causes larger changes of in the x-direction velocity in the 3D calculation than the 2D calculation. Fig. 16 shows the turbulent kinetic energy distribution to visualize the vortex occurring at the side of the hydrofoil and confirms that a high turbulent kinetic energy distribution appears at the side of the hydrofoil.

Turbulent kinetic energy around the Coanda hydrofoil with 3D effect (α = 4°, Cj = 0.06)
4.2 Performance Variation According to Change of Scale in the Span Direction
As shown in Fig. 17, a study was conducted by selecting two geometry types to analyze the performance variation when the geometry of the hydrofoil is changed by changing the scale of the span direction of the Coanda hydrofoil. The two types were labeled W-type and V-type, respectively, based on their geometry when considering the symmetry of the boundary conditions. W-type has a geometry whereby the size of the span direction changes to 0.625C → 0.875C → 0.625C, and the in the case of the V-type, it changes in the sequential order of 1.0C → 0.5C. The projection area of the two geometries is identical.

Various geometry of Coanda hydrofoil
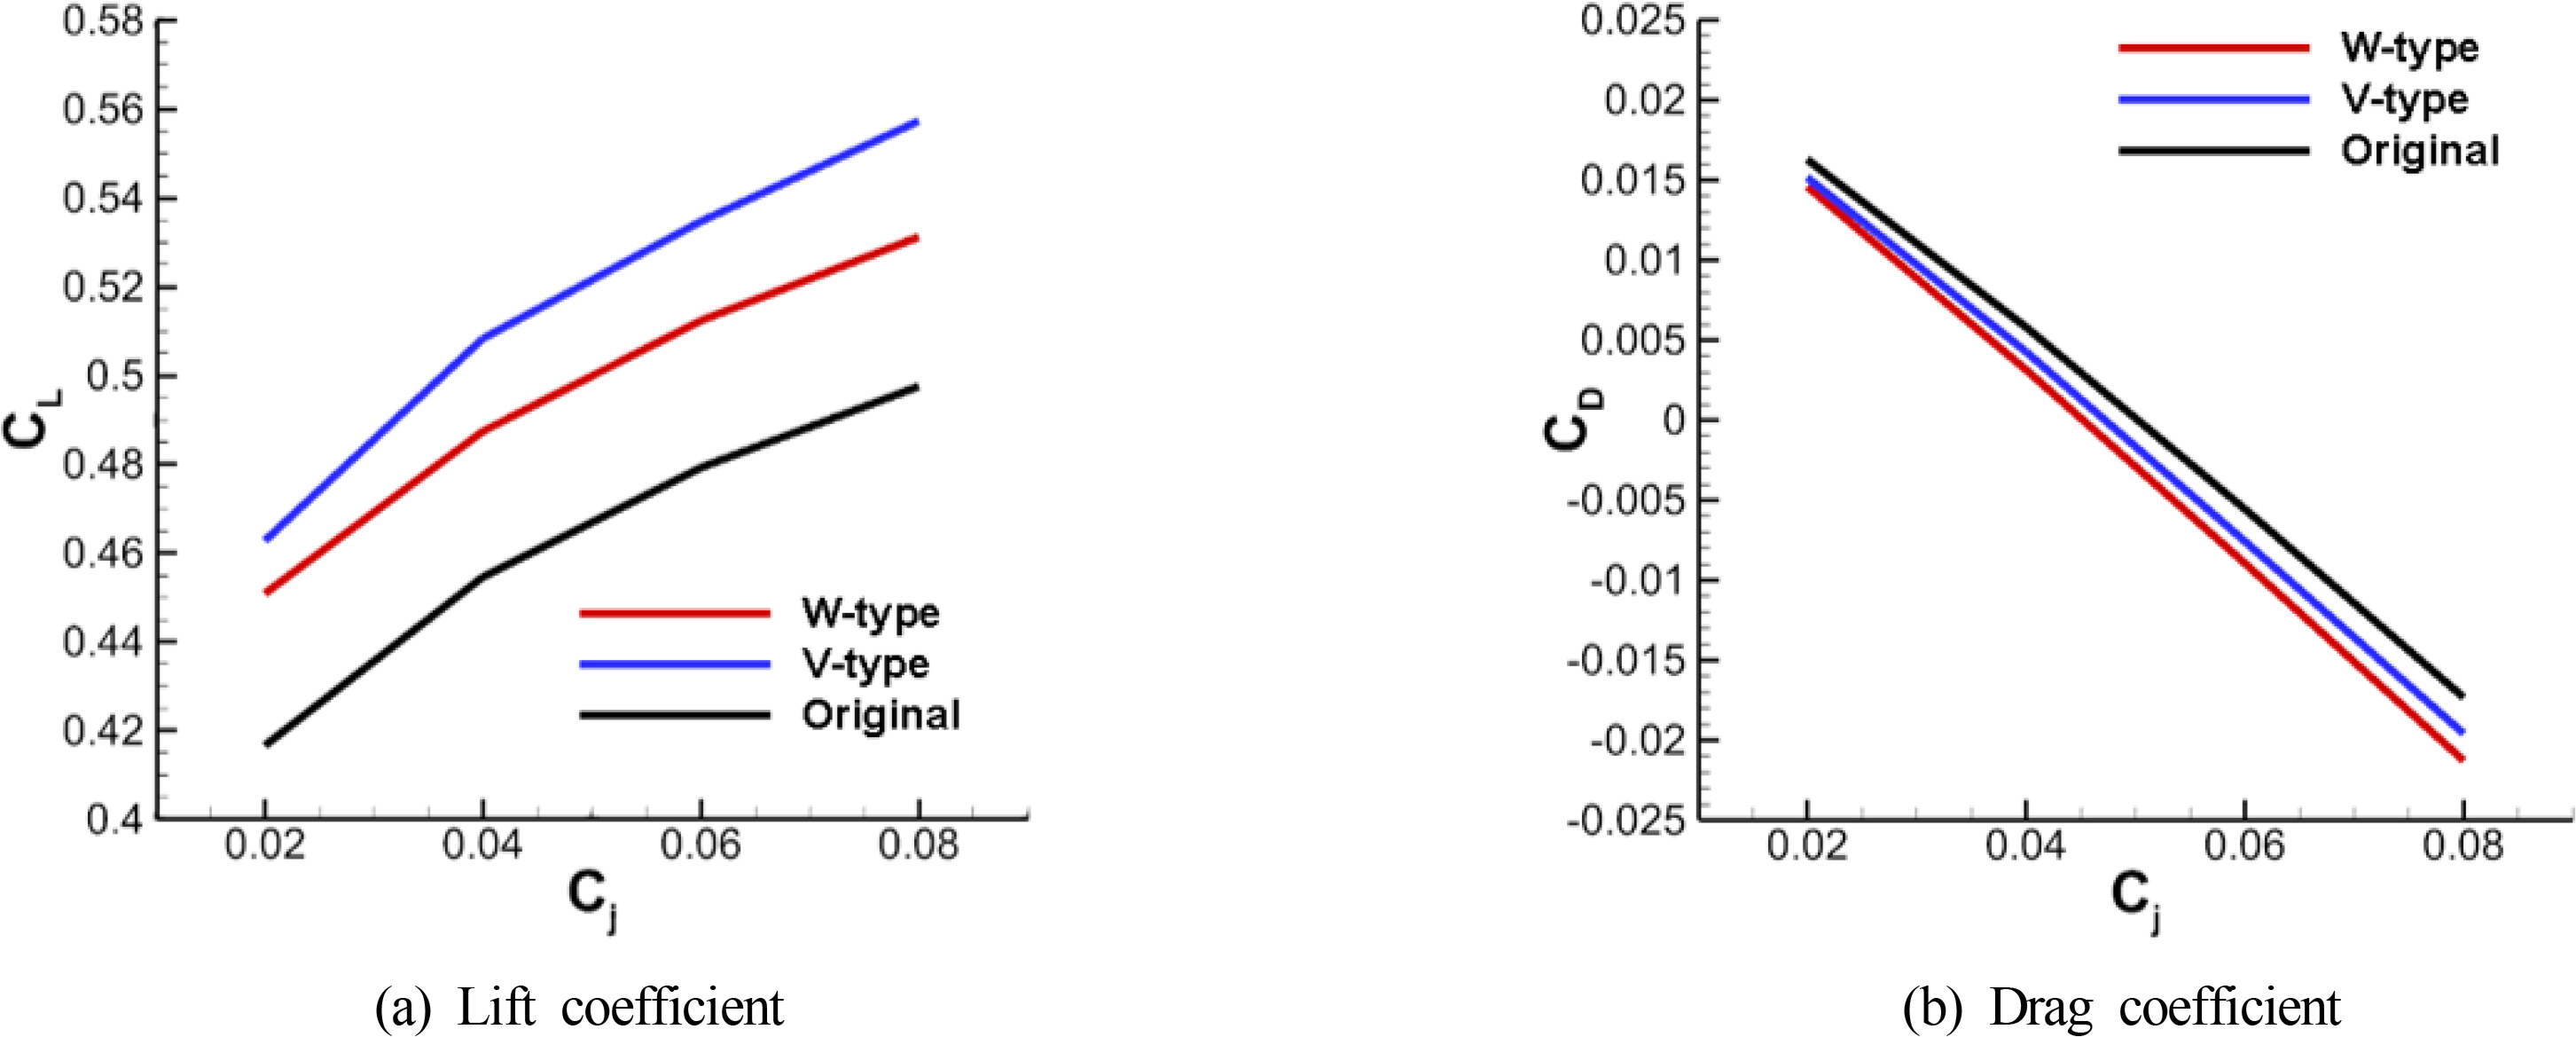
At an angle of attack of 4°, Fig. 18 compares the lift and drag performances between the W-type, V-type, and the hydrofoil (Original) with a fixed chord length in the span direction. When the size of the chord changes in the span direction, the performance is better than that of the hydrofoil with a fixed chord length, and among them, the V-type shows a relatively larger lift force, and the W-type shows a relatively smaller drag force. To analyze the cause of the performance variation according to the geometry and flow characteristics of the two geometry types, Fig. 19 illustrates the flow characteristics under the conditions of an attack angle of 4° and a jet momentum coefficient of Cj = 0.06.
Turbulent kinetic energy around the Coanda hydrofoil with 3D effect (α = 4°)
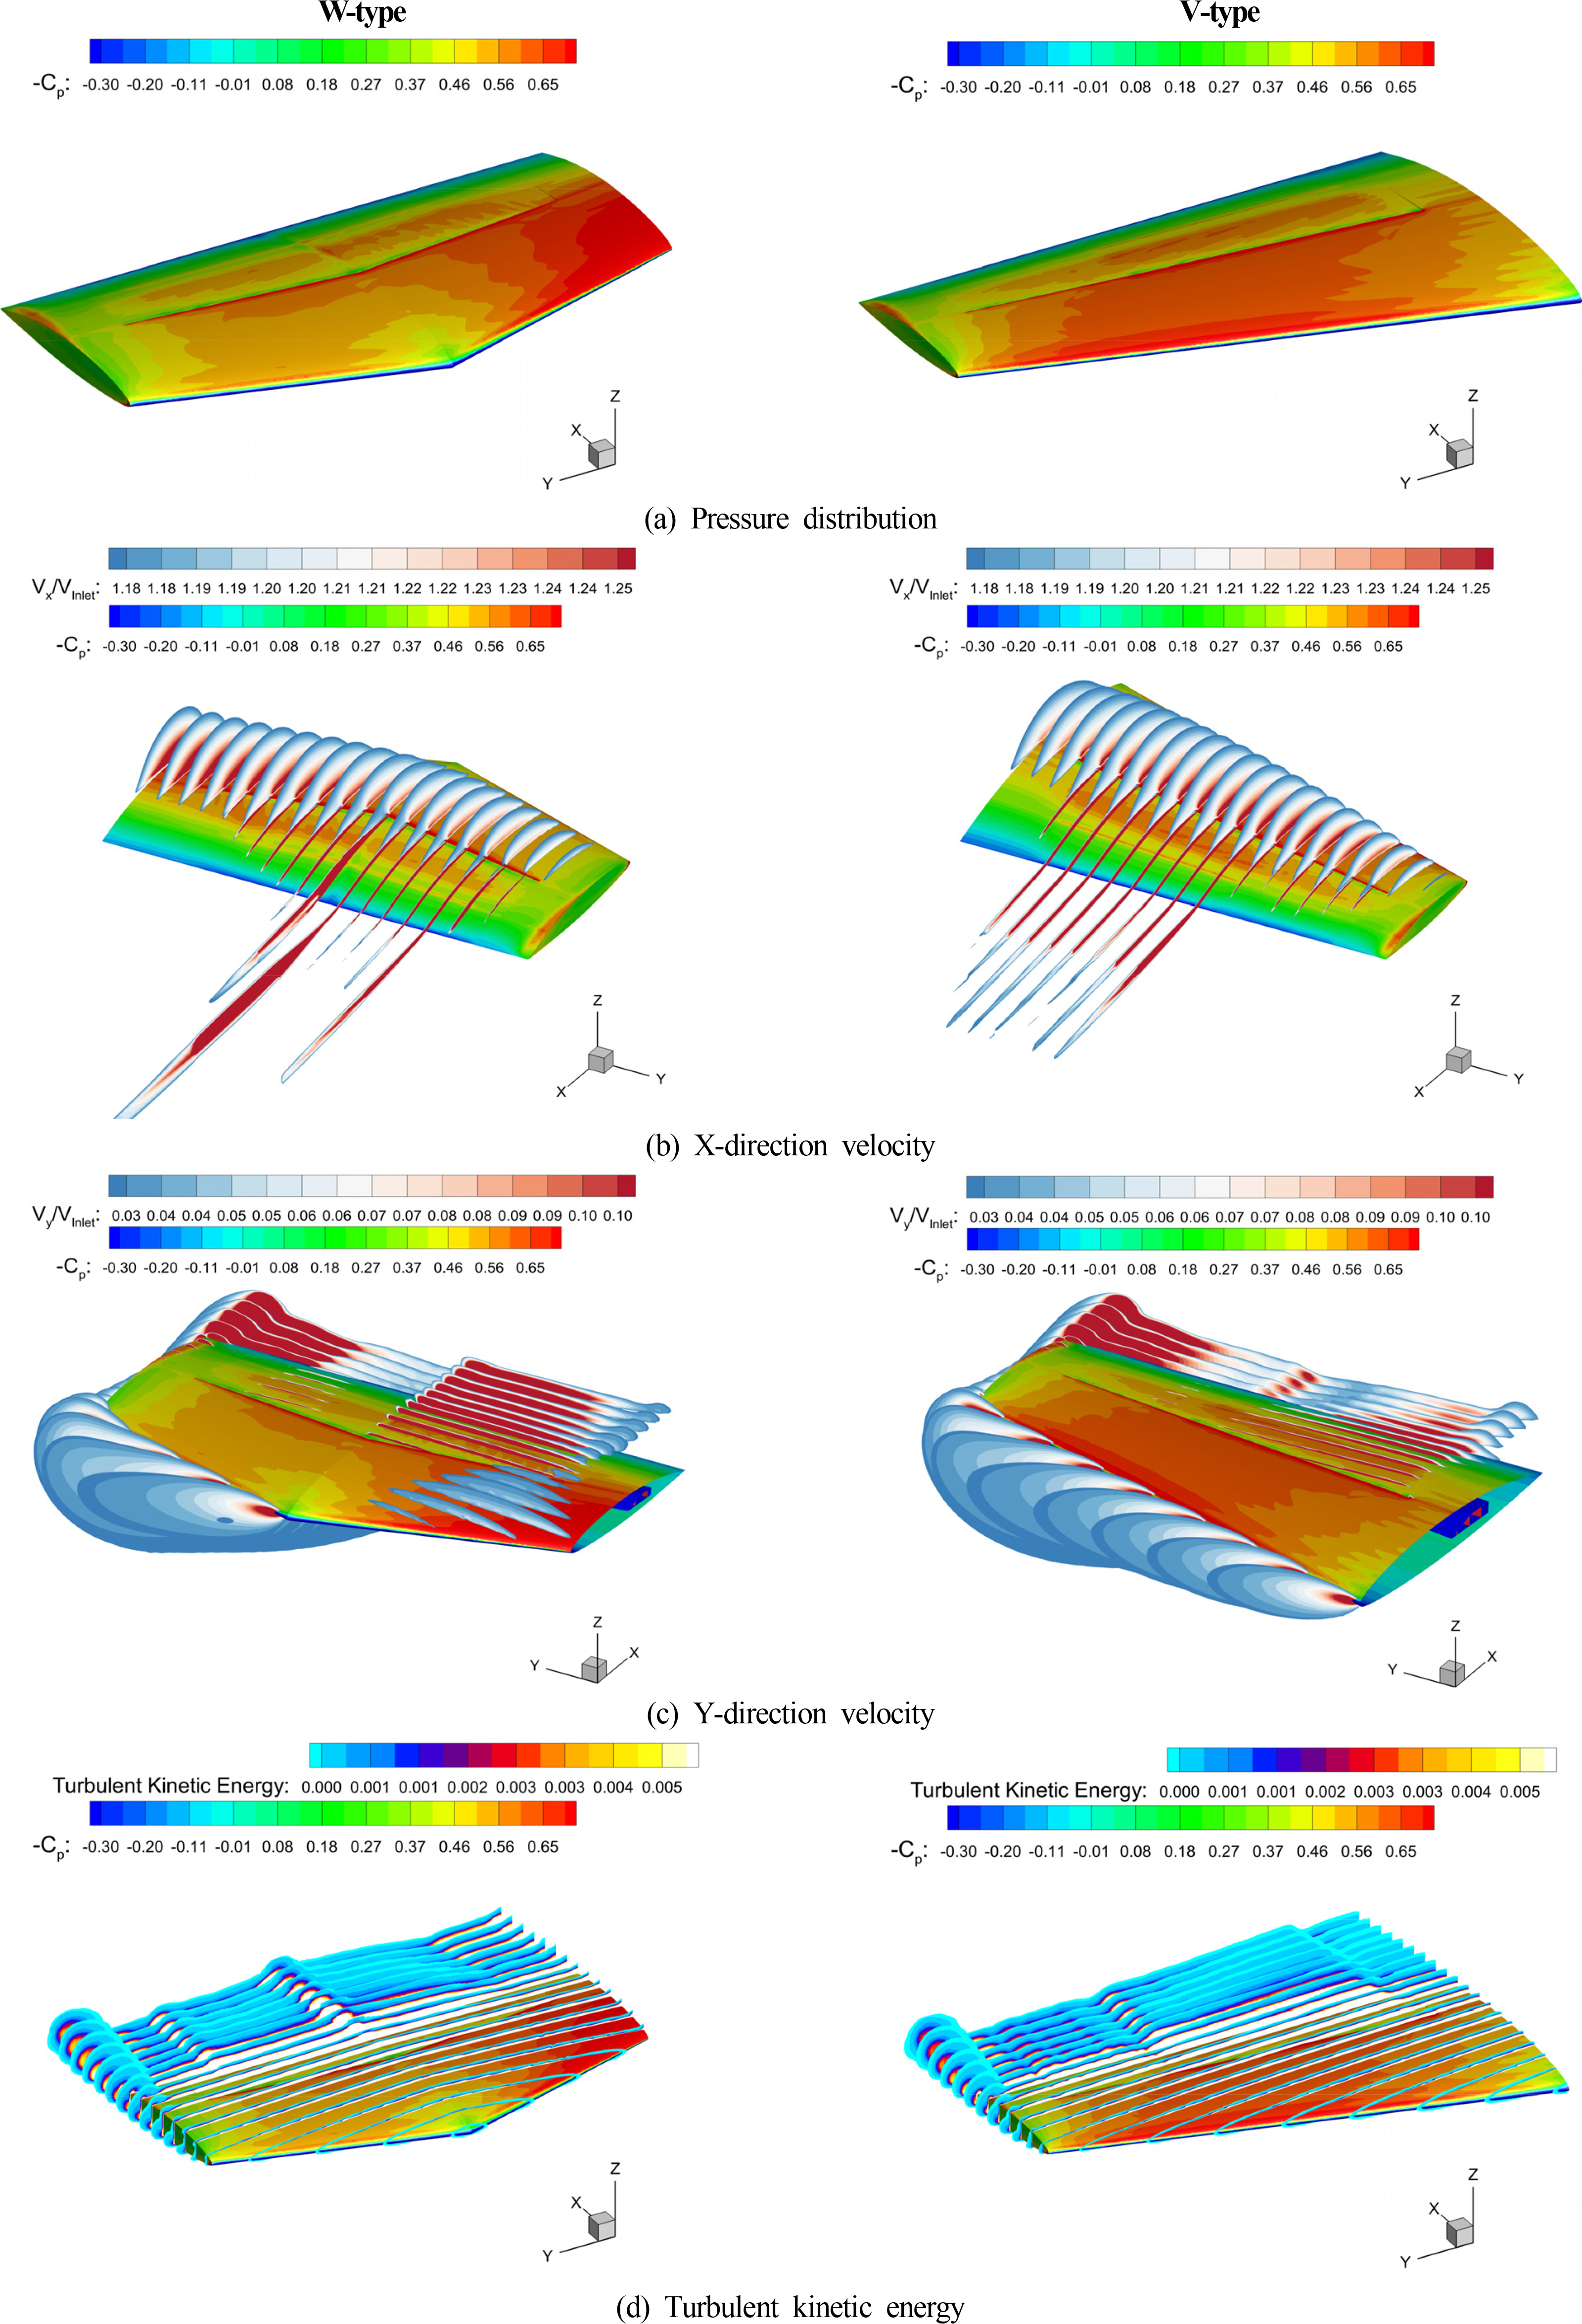
Flow characteristics around the Coanda hydrofoil with 3D effect (α = 4°, Cj = 0.06))
When Fig. 19(d) and Fig. 16 are compared, it can be seen that the vortex at the sides of the W-type and V-type hydrofoils are significantly smaller than that of the Original, and for this reason, the lift and drag performances of the W-type and V-type are high. In the case of Original, the y-direction velocity component is induced only by the vortex at the tip of hydrofoil before the jet slit, as shown in Fig. 15(c). By contrast, in the case of the W-type or V-type, the y-direction velocity component is induced by the slope of the hydrofoil even before the jet slit owing to the angle of inclination of the hydrofoil. As a result, the fluid at the front of the hydrofoil, which is pushed toward the span direction, flows along the slope, thereby reducing the vortex.
In both the W-type and V-type, a large difference occurs in the flow characteristics. In the case of the W-type, the highest lift force occurs around approximately 0.0S −0.4S because the slopes are opposite each other based on the center of the span direction. This phenomenon occurs because the flow is gathered within the 0.1S −0.4S area owing to the slope occurring in the shape of the W-type. At 0.5S, the W-type has a chord length of 0.875C, at which the slit height is the highest, and for this reason, the jet spraying is concentrated at approximately 0.5S.
By contrast, in the case of the V-type, the slit height decreases gradually, and the jet is rarely sprayed after 0.6S, at which the slit height is low, and the jet is concentrated within the area of 0.6S or less where the slit height is high. Furthermore, as the y-direction velocity component is generated from the front end of hydrofoil, this movement reduces the vortex at the side of hydrofoil, and owing to this tendency, the V-type has a relatively high lift force compared to the cross-sectional area.
4.3 Performance Variation According to Slit Range
To analyze the performance variation according to the slit range in the span direction, an analysis was conducted for an angle of attack of 4° by changing the slit range in the Original hydrofoil, which had a fixed chord length in the span direction. The slit range was 0.1S −0.5S, 0.3S −0.7S, and 0.5S −0.9S, respectively. The geometry of the hydrofoil is illustrated in Fig. 20, and the numerical analysis results are shown in Fig. 21.

Geometry of Coanda hydrofoil with various slit range
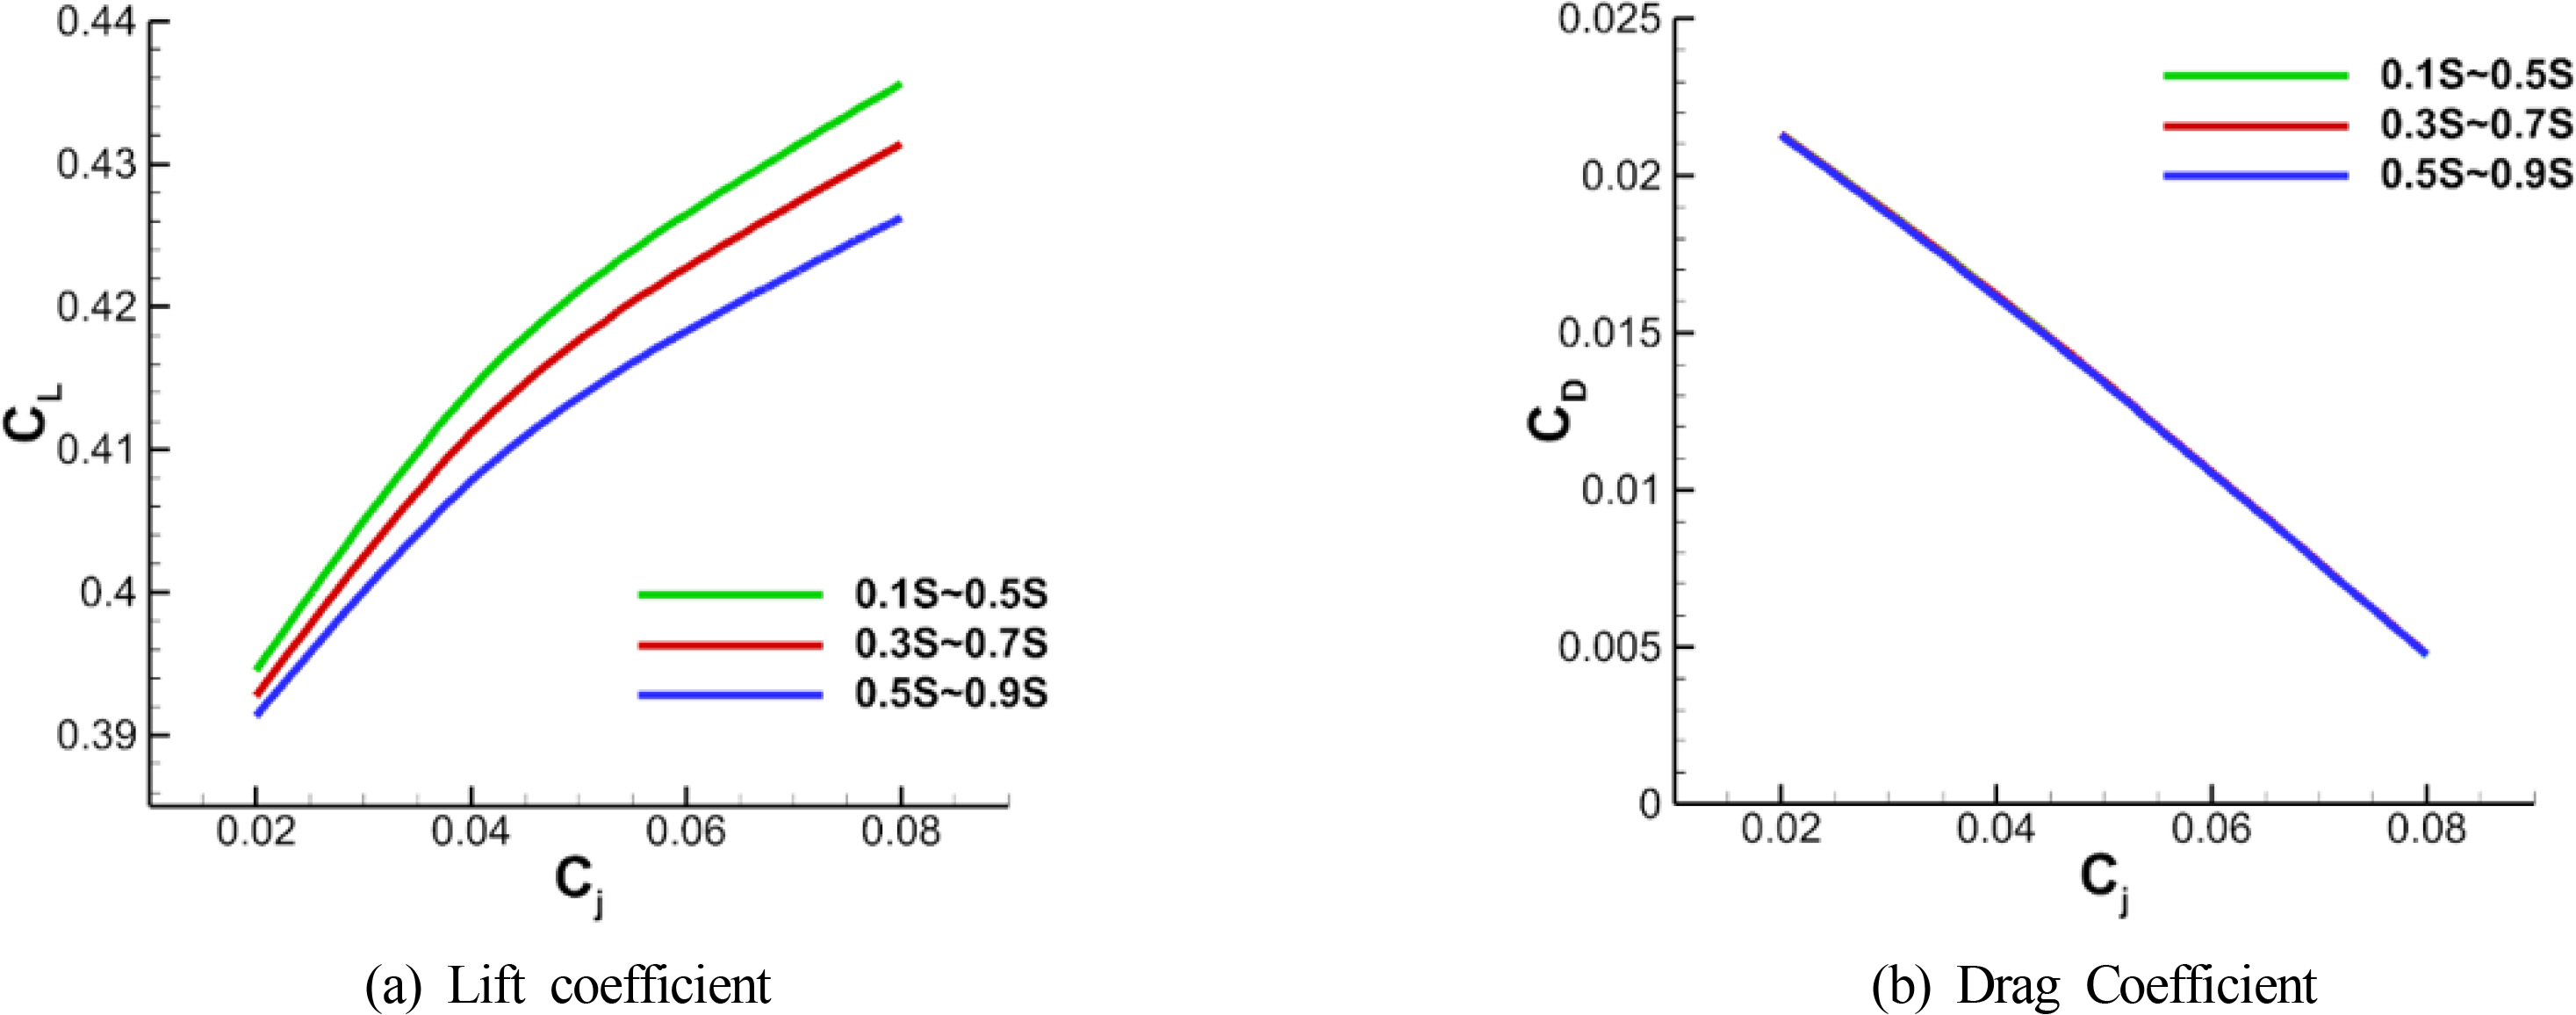
Comparison of lift and drag performance with various slit range
The lift force decreased overall by approximately 5%−60% in the current case with the half spraying range, as compared to the previous case of spraying 80% in the span direction. As shown in Fig. 21, the drag is extremely similar, with a difference of less than 0.5%, between the slit positions under all conditions, although the lift force shows large differences. When the slit range corresponds to 0.1S −0.5S, the lift force is at the highest, and as the slit position moves to the side, the lift force tends to decrease. In the case of drag, because the jet spray is identical under all conditions, the propulsion force in the forward direction of the hydrofoil is identical, thereby showing almost no difference in drag. To analyze the cause of the difference in the lift force, Fig. 22 illustrates the flow characteristics at a jet moment coefficient of Cj = 0.06.

Flow characteristics around the Coanda hydrofoil with various slit range (α = 4°, Cj = 0.06)
In Fig. 22(b), as the position of the slit spraying the jet moves to the side, the volume of jet spray changes at the tip of slit, and the jet pushing increases. Furthermore, Figs. 22(c) and (d) show that the flow of the sprayed jet quickly joins the vortex at the side of the hydrofoil. When the slit range is 0.1S −0.5S, the pressure decrease immediately after the jet spray is the highest because the jet is sprayed at a point relatively far from the vortex at the side of the hydrofoil. Furthermore, considering that the y-direction velocity component increases as the jet spraying slit moves to the side, it is determined that the performance decreases because the sprayed jet is affected by such a vortex. As a result, the performance increases as the sprayed jet is less affected by the vortex generated at the side.
5. Conclusions
Based on a previous study by Eom et al. (2020), to optimize the geometry of jet slit, we conducted a study on the performance variation according to the position and height of the slit and the thickness of the tip where the slit and the top surface of the hydrofoil meet. As the height of slit decreased, the lift force of the hydrofoil increased compared to the drag force. If the thickness of the tip increases, the jet, which has to flow along the hydrofoil, flows along the tip owing to the Coanda effect, thereby increasing the lift and drag performance.
The NACA66 (mod) hydrofoil shows that the best performance is appeared when the slit is positioned at the center of the hydrofoil chord. However, a further study should be conducted to optimize the slit position according to the geometry of the hydrofoil because the pressure distribution is different between hydrofoils.
Afterward, to analyze the 3D effect, a calculation was conducted by opening one side of the hydrofoil in the 2D calculation. When one side is opened, a vortex is generated at the side of the hydrofoil owing to the 3D effect, and for this reason, the fluids flowing into the front part of the hydrofoil are pushed to the span direction, thereby decreasing the lift performance significantly. The vortex has an effect on the sprayed jet. In the results of the analysis conducted by moving the slit position of Coanda hydrofoil, which sprays 40% compared to the span used in the geometry of the Original hydrofoil, the volume of jet spray that joins with the vortex increases as the slit position moves toward the side of the hydrofoil. As a result, the lift performance decreases because the part that contributes to the circulation of the fluid around the hydrofoil decreases.
Finally, 3D geometries with a taper were studied. Compared to the Original hydrofoil, the hydrofoils having a slope showed a large decrease in vortex at the tip of hydrofoil. In the case of the Original hydrofoil, a large vortex is generated along with the y-direction velocity component, which increases rapidly at the tip of hydrofoil. By contrast, in the 3D geometries with a taper, the fluid is pushed to the span direction because of the y-direction velocity component produced from the front part of the hydrofoil, and as a result, the vortex is decreased at the side. Consequently, the impact of the vortex on the jet spray decreases, thereby increasing the lift and drag performance compared to the cross-sectional area.
Notes
Conflict of interest
No potential conflict of interest relevant to this article was reported.
This work was supported by the National Research Foundation of Korea (NRF) grant (No. 2019R1F1A1060883) funded by the Ministry of Science and ICT, Republic of Korea, and the HRD program for Global Advanced Engineer Education Program for Future Ocean Structures (No. P0012646) funded by the Competency Development Program for Industry Specialists of the Korean Ministry of Trade, Industry and Energy, Republic of Korea.