1. Introduction
Since 2000, coastal erosion has been worsening and spreading owing to disturbances of sand movement by coastal and port structures; the reduction of sediment budget by dams, weirs, and levees; and abnormal swells and storm waves. Along the eastern coast of Korea in particular, the narrowing of beach width is increasing. Furthermore, beaches are being damaged owing to the changing coastal environment and repeated beach erosion, which are emerging as serious problems in local communities. Consequently, since 2000, the government has been supporting measures against erosion through “coastal management plans” based on the Coast Management Act. However, an overdesign focusing on artificial structures is causing frequent failures owing to a lack of understanding of the phenomenon, poor reliability of predictions, and a misapplication of overseas cases. Along the eastern coast of Korea, many sand streams have developed and erosion caused by the construction of artificial structures is severe; in addition, beach erosion on the eastern coast has reached a serious level owing to an underestimation or poor reliability of the existing shoreline and topographic change models predicting erosion.
Among the various causes of beach erosions along the eastern coast of Korea, the main cause is the change in shoreline owing to the construction of artificial structures such as breakwater and groyn. Typical examples include port structures such as Sokcho Port in Sokcho-si, Gangwon-do and Gungchon Port in Samcheok-si, Gangwon-do; coastal structures on Yeongnang Beach in Sokcho-si, Gangwon-do and Bongpyeong Beach in Uljin-gu, Gyeongsangbuk-do; and the thermal power plant of Samcheok LNG in Samcheok-si, Gangwon-do. Kang et al. (2010) investigated the shoreline erosion on Yeongnang Beach that occurs from artificial structures when applying a headland construction method. Despite a large number of such types of erosion, few studies have been conducted on evaluation methods for determining how much impact coastal artificial structures have on beach erosion.
To evaluate the erosion occurring from the construction of artificial structures, it is necessary to predict the equilibrium of the shoreline owing to the transport of longshore sediment. Among the many equilibrium shoreline equations that have been proposed (Yasso, 1965; Hsu et al., 1987; Moreno and Kraus 1999), the parabolic bay shape equation of Hsu and Evans (1989) has been proven to be applicable in many coastal areas around the world. Furthermore, the Coastal Engineering Manual (USACE, 2002) adopted a parabolic bay shape equation (Hsu and Evans, 1989) as a means to preserve and manage the coasts of the U.S. In addition, Lim et al. (2019) demonstrated the validity of the parabolic bay shape equation using the wave data of the East Sea in South Korea.
In this study, the rotation angle of an existing equilibrium shoreline is calculated using the parabolic bay shape equation of Hsu and Evans (1989), and a method for evaluating the beach erosion impact proportional to this rotation angle from initial shoreline is proposed. In addition, the criteria for evaluating the beach erosion impact owing to the construction of artificial structures are established by comparing the annual average erosion width calculated using the longshore sediment formula of the Coastal Engineering Research Center (CERC; USACE, 1984) with the rotation angle of an equilibrium shoreline. Finally, the distance affected by beach erosion was calculated along the eastern coast of Korea where artificial structures including port structures and power plants are built.
2. Impact Assessment of Beach Erosion according to Rotation Angle of Equilibrium Shoreline
2.1 Parabolic Bay Shape Equation
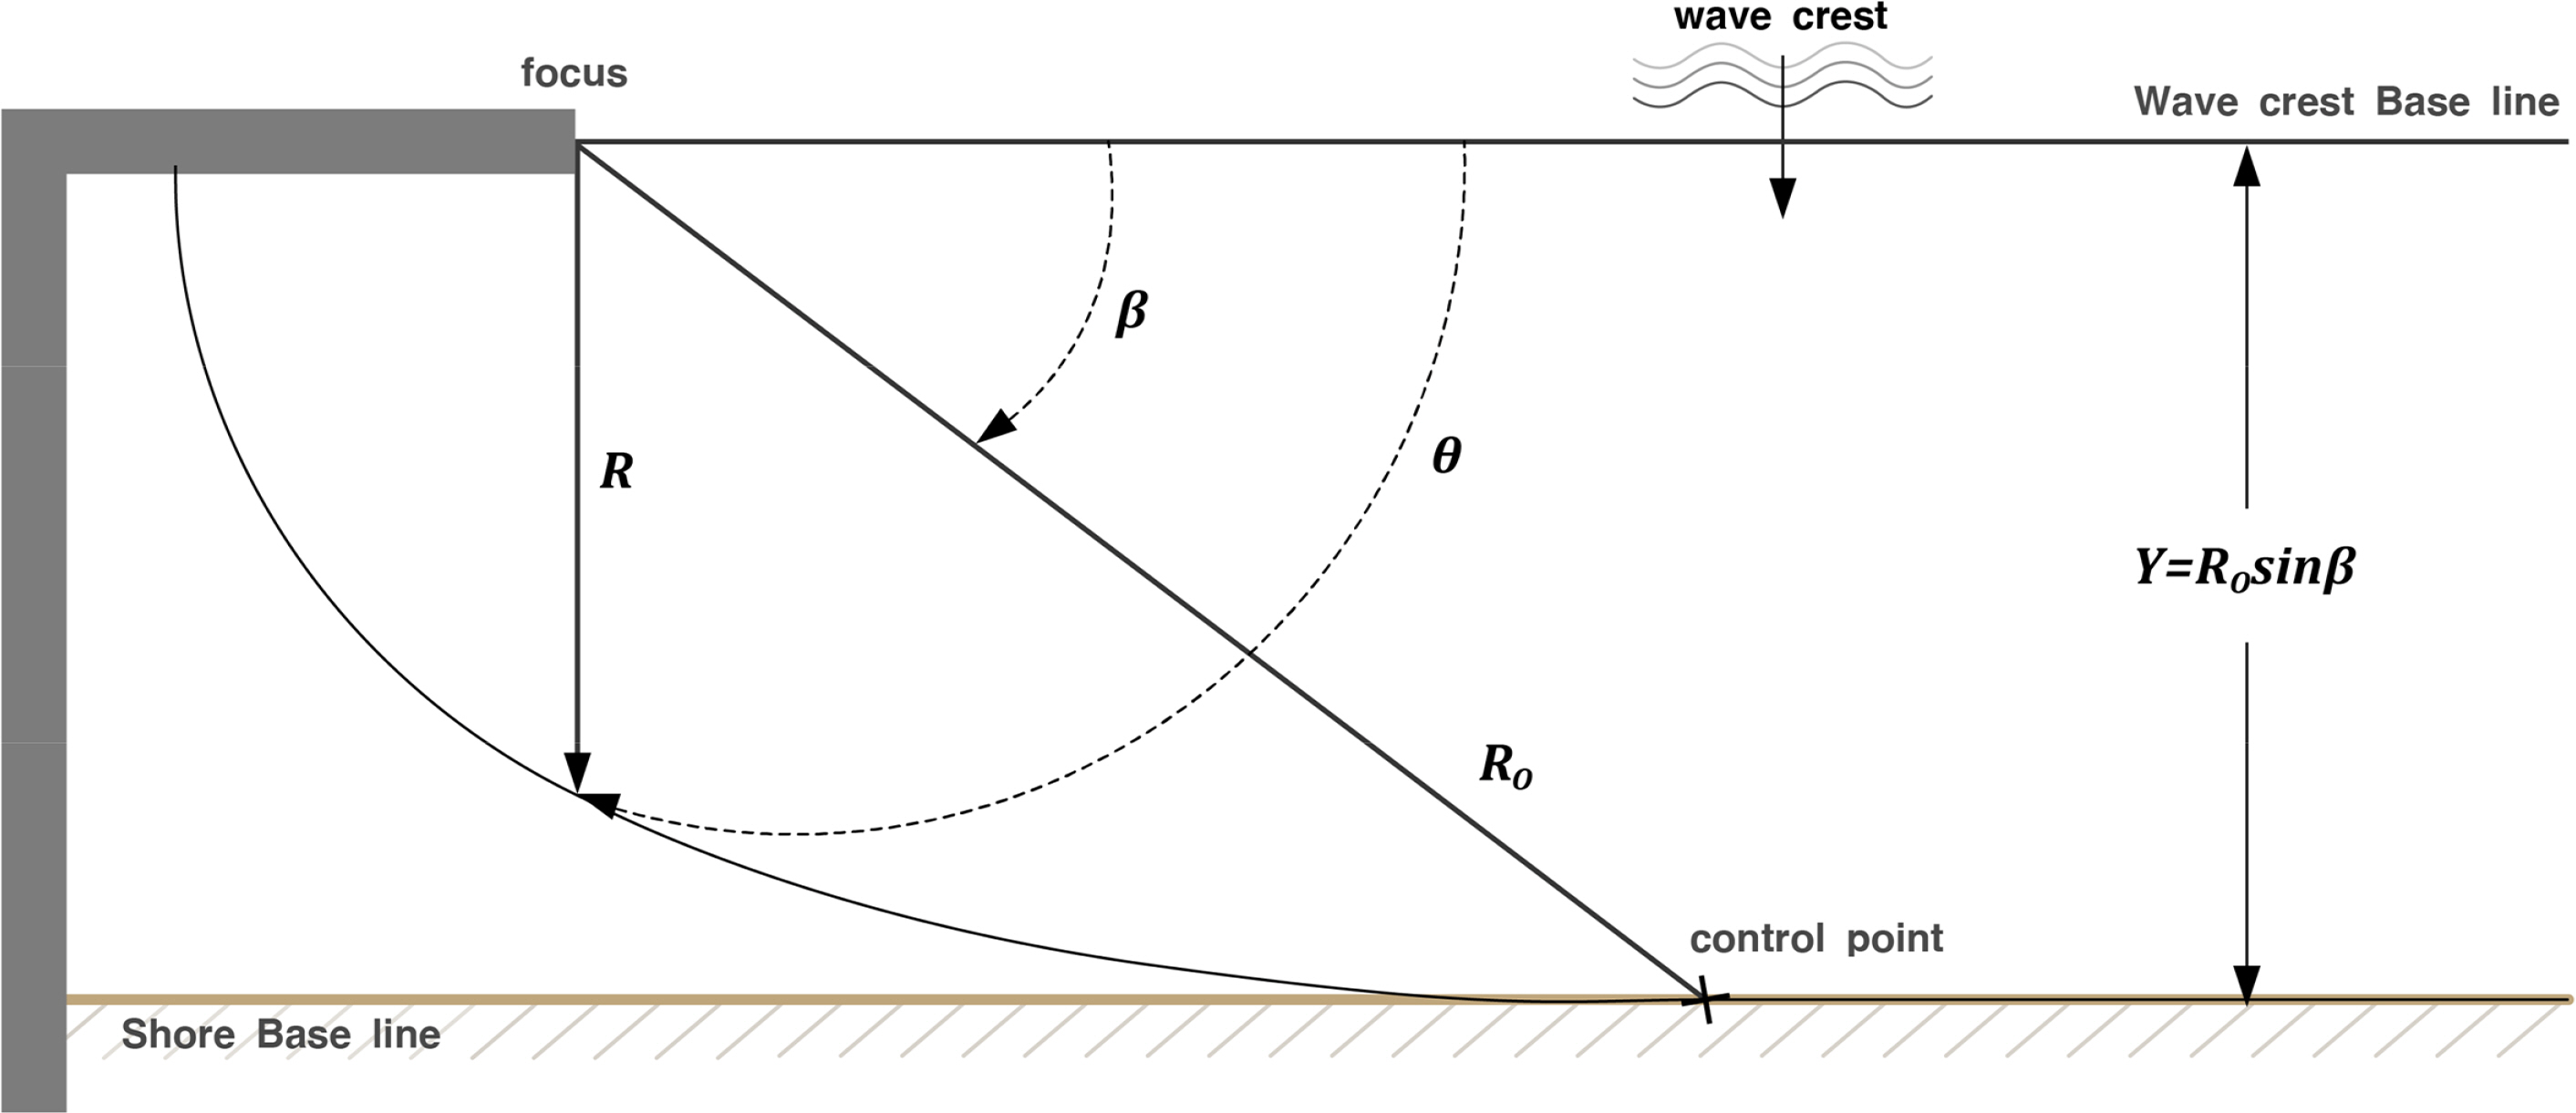
The parabolic bay shape equation (PBSE) of Hsu and Evans (1989), which is a model that predicts the static equilibrium shoreline, is given as follows (Fig. 1):
where R is the radial distance from the focus resulting from artificial structures to the equilibrium shoreline, Y is the distance from the wave crest baseline of the shore baseline that passes through the control point, β is the angle formed by the line that passes through the control point and focuses at the wave crest baseline, and θ is the angle formed by the wave crest baseline with the radial distance R. Furthermore, Ci (i = 1, 2, 3) is the fitting coefficient of the parabolic bay shape equation provided by Hsu and Evans (1989).
For a long sandy beach, the control point is far from the focus, and thus a simple approximate solution such as in Eq. (3) can be obtained (Lim et al., 2019). Because β is close to zero in this case, sinβ converges to β. Furthermore, in the case of the equilibrium shoreline coefficient, C0 and C2 converge at zero, and C1 converges at 1. Therefore, the parabolic bay shape in Eq. (1) can be expressed as a simple relational expression R(θ) as follows:
The approximate solution of the parabolic bay shape equation can be used to estimate the equilibrium shoreline simply by the distance Y of the artificial structure and the angle θ formed by the radial distance of the equilibrium shoreline with the wave crest baseline.
2.2 Erosion Impact Assessment According to the Rotation Angle of Equilibrium Shoreline
According to the longshore sediment formula of CERC (USACE, 1984), the rotation angle αb of the wave crest baseline with the shoreline is the main cause impacting the amount of longshore sediment. In other words, it can be estimated that the amount of longshore sediment increases in proportion to the rotation angle from the straight shoreline. However, it was assumed that variables such as the grain size of the sand and the wave height do not have a significant effect because their values are similar in most coastal areas. Existing shorelines are changed to equilibrium shorelines owing to the artificial structures in harbors or ports, and the shoreline is rotated as a result. At this time, the rotational angle αb can be calculated using the ratio of coastal to transverse shoreline changes as follows:
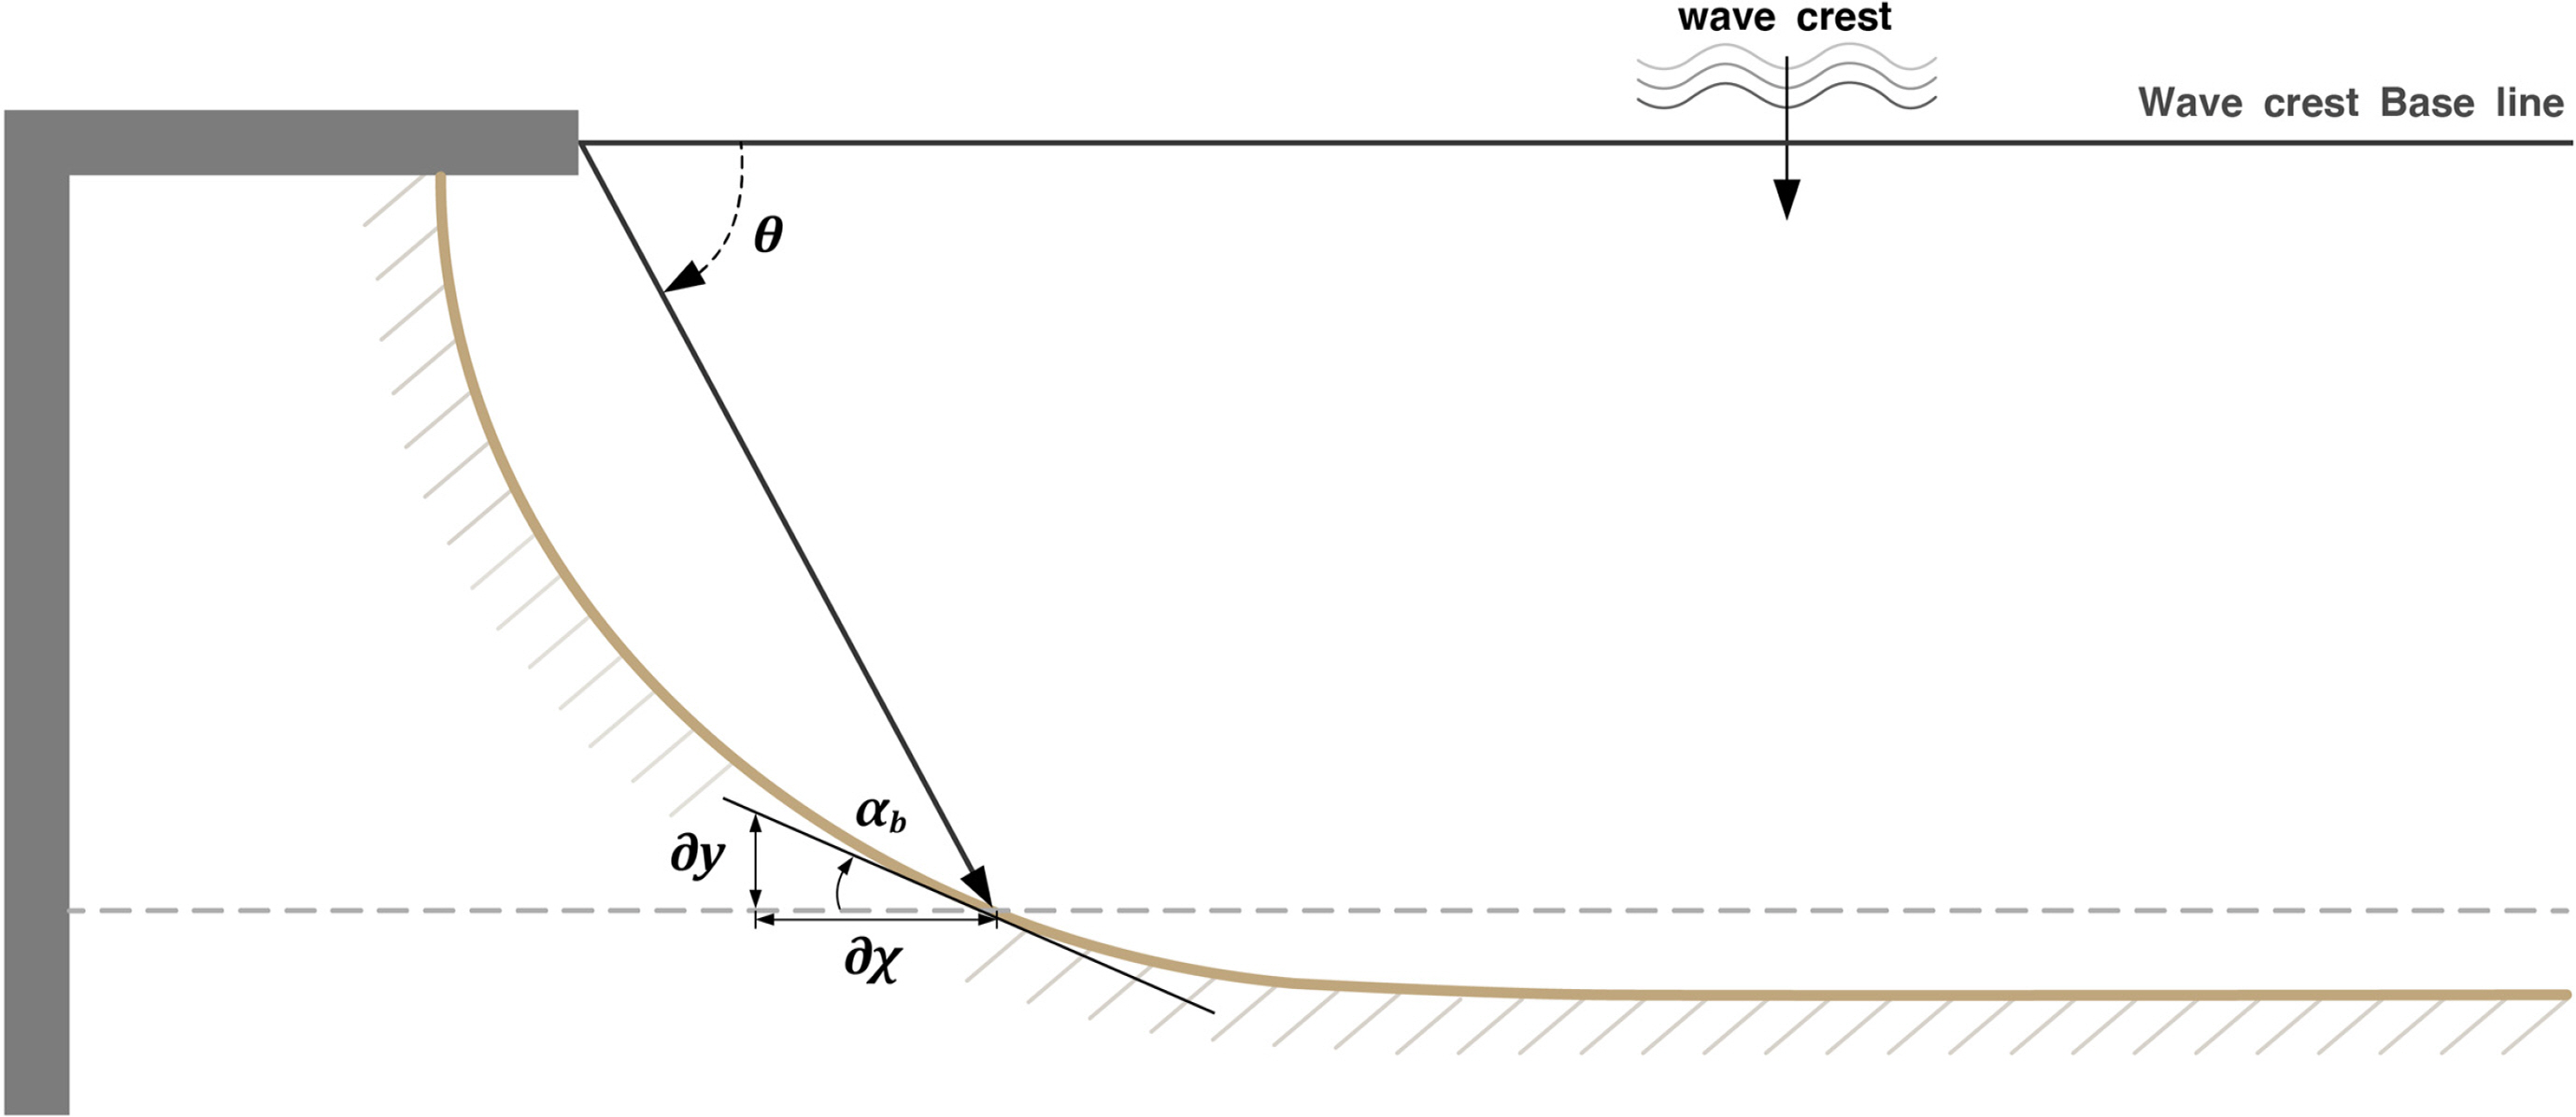
where αb is the rotation angle of the equilibrium shoreline from the original shoreline, x is the equilibrium shoreline length from the existing shoreline toward the coast, and y is the shoreline length in the transverse direction from the existing shoreline. From the approximate solution of the equilibrium shoreline of Hsu and Evans (1989), the shore rotation angle is derived from Eq. (4) as follows (Fig. 2):
Using Eq. (5), the rotation angle of the equilibrium shoreline owing to the construction of artificial structures can be calculated simply using the angle θ formed by the radial distance of the equilibrium shoreline with the wave crest baseline.
Therefore, from Eq. (5), the erosion impact distance L according to the distance Y of the artificial structures can be derived as follows:
where θ is a variable that changes according to the distance Y of the structure and erosion impact distance L, and can be expressed as follows:
The erosion impact distance L according to the distance of the structure that satisfies the above two equations can be determined. The risk level from the erosion is proportional to the rotation angle of the equilibrium shoreline αb from the existing shoreline. In other words, the erosion impact can be evaluated based on the amount of longshore sediments. In addition, Lsafe and Ldanger can be calculated as follows according to the distance Y of the artificial structure:
where Lsafe is the critical distance at which the impact is considered insignificant if the target beach is farther than Lsafe according to distance Y of the artificial structure. If Lsafe/L<1, the beach is at a safe level. By contrast, Ldanger is the critical distance at which the impact is considered serious if the target beach is closer than Ldanger according to the distance Y of the artificial structure. If Ldanger/L>1, the beach is at a dangerous level. Furthermore, if the distance of the target beach is between Ldanger and Lsafe, the beach is at a level of caution.
3. Coastal Erosion Impact Analysis Using Longshore Sediment Formula
3.1 Longshore Sediment Formula
The construction of artificial structures causes a diffraction of waves, and the diffracted waves flow at an oblique angle between the incident wave and the coast and cause the transport of the longshore sediments. Komar and Inman (1970) conducted a field experiment on the coastal energy flux Pl and longshore sediment amount Ql, and proposed the following equation:
where Il is the magnitude of the wave power, ρs is the sediment density, ρ is the seawater density, p is the sediment porosity, which has a value of 0.3–0.4, and αb is an angle between the shoreline and breaking wave crest line. Furthermore, K is the longshore sediment coefficient and can have wide ranging values of between 0.04 and 1.1 depending on the amount of sediment, but 0.77, the value suggested by Komar and Inman (1970), is mainly used. The coastal energy flux component Pl is defined as follows:
where E is the wave energy and Cg is the group velocity. The CERC (USACE, 1984) formula based on Eq. (10) to express the wave energy and group velocity is as follows:
where Hb is the breaking wave height, and
C ′ = [ K g / κ ] / [ 16 ( s - 1 ) ( 1 - p ) ]
3.2 Calculation of Erosion Width Per Unit Time According to the Rotation Angle of Equilibrium Shoreline
In this section, the erosion width per unit time according to the rotation angle of an equilibrium shoreline is calculated using the longshore sediment formula. In addition, the appropriate rotation angle for the beach erosion impact assessment equation derived from the bay shape equation of Hsu and Evans (1989) is calculated. The beach erosion occurring from longshore sediment is caused by the difference in amount of sediment transport, as shown in Fig. 3, and the erosion width per unit time is expressed as follows:
where hB is the berm height, hc is the sand movement limit depth, and W is the erosion width. Furthermore, the erosion width per unit time can be calculated by applying the longshore sediment formula of CREC (USACE, 1984) in Eq. (12) to Eq. (13).
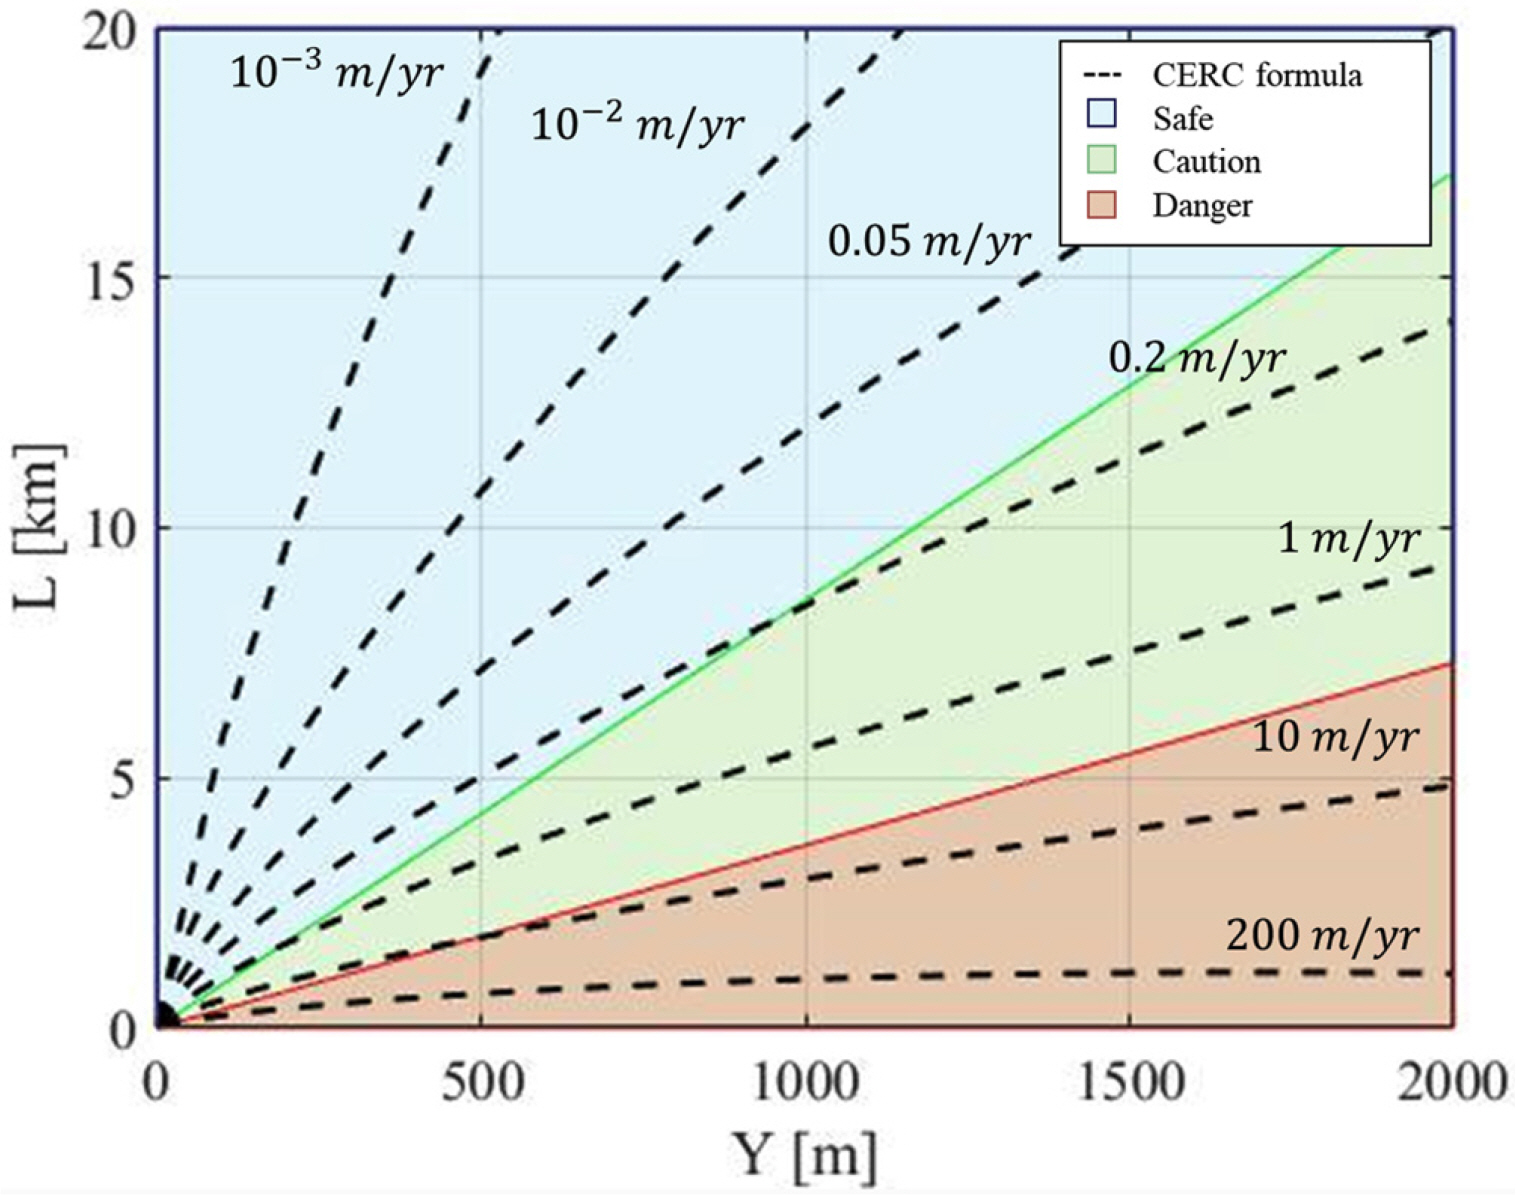
Fig. 4 shows graphically the annual erosion width ∂W/∂t and the rotation angle of equilibrium shoreline αb according to distance Y of an artificial structure and the shore length L. If the annual erosion width is less than 0.1 m, the beach is considered safe from erosion; if the annual erosion width is 2.5 m or larger, the beach is considered at a dangerous level. As shown in Fig. 4, if the rotation angle αsafe of an equilibrium shoreline at a safe level is smaller than 0.1°, it is estimated that there is almost no impact from the artificial structures. By contrast, if the rotation angle αdanger of an equilibrium shoreline at a danger level is larger than 0.35°, there is a high risk of erosion owing to artificial structures. For the coefficient C of the longshore sediment amount, 0.167 was applied as mentioned above, and the breaking wave height was assumed as 1 m. The erosion impact of artificial structures can be assessed more easily using the rotation angle αb of an equilibrium shoreline. However, according to Fig. 4, the erosion width is slightly underestimated when the distance Y is small and overestimated when it is large.
4. Assessment of Impact of Beach Erosion by Artificial Structures in Eastern Coast of Korea
The impact of beach erosion increases if the coastal and port structures are constructed too far from the coast. In this study, the erosion impact from artificial structures on the eastern coast of Korea is assessed using Eqs. (6) and (7). The impacts of the construction of port structures along the eastern coast including Donghae Port, Sokcho Port, and Gungchon Port, as well as the Samcheok LNG thermal power plant, on beach erosion are assessed. Fig. 5 shows the distances and shore lengths of the port structures and thermal power plant and impact levels in each coastal area.
The distances of beaches at safe levels in terms of beach erosion from the artificial structures built in Donghae Port, Sokcho Port, Gungchon Port, and Samcheok LNG are 18.82, 6.59, 3.25, and 12.06 km, respectively, according to distance Y. Furthermore, the distances of beaches at a level of danger from erosion are 8.03, 2.81, 1.39, and 5.15 km, respectively (Table 1). Therefore, the Chogok Beach located of Gungchon Port in the southern part is assessed as a level of caution, whereas the Donghae Port, Sokcho Port, and Samcheok LNG are assessed as at levels of danger.
5. Discussion
The assessment method for erosion impact from artificial structures using the rotation angle of the equilibrium shoreline proposed above has the disadvantage in that Eqs. (6) and (7) need to be repeatedly calculated. Therefore, an approximate solution for the equation of the erosion impact from artificial structures is proposed in this section. The distance Y of artificial structures and the shore length L receiving the erosion impact derived from Eqs. (6) and (7) have the following proportional relationship:
where β is the erosion impact coefficient and has a different value depending on the rotation angle of an equilibrium shoreline. For the values of αsafe and αdanger calculated using Eq. (14), the erosion impact coefficients β have values of 8.5554 and 3.6514, respectively (Table 2). When the result of Eq. (6) is compared with the approximate solution of Eq. (14), they have almost identical trends in a straight line.
6. Conclusions
Among the 96 coastal areas on the eastern coast of South Korea, 75 are at a danger level of erosion (Gangwon Province, 2017). It is therefore necessary to establish a method of assessing the impact of artificial structures built on the coast on beach erosion. In this study, an assessment method for the impact of artificial structures is proposed based on the rotation angle of an equilibrium shoreline obtained from the parabolic bay shape equation of Hsu and Evans (1989). It can be considered that beach erosion from artificial structures is at a more dangerous level in proportion to the rotation angle of an equilibrium shoreline from the shore baseline. For a quantitative assessment, the results were compared with the annual average erosion width calculated using the longshore sediment formula of CERC (USACE, 1984). The qualitative assessment criteria were established as being at a safe level if the rotation angle of the equilibrium shoreline is less than 0.1° and at a level of danger if it is 0.35° or greater.
Using the method proposed in this study, the impacts on beach erosion owing to the construction of large artificial structures in Donghae Port, Sokcho Port, Gungchon Port, and the Samcheok LNG Plant were evaluated. The values of Ddanger/D, which is the assessment criterion of the danger level, were 2.01, 1.28, 0.57, and 1.83 in these four coastal areas, respectively. In other words, Gungchon Port was evaluated as at a level of caution, whereas the others were evaluated as at a dangerous level. However, caution should be practiced because these results are slightly different from the values calculated using the longshore sediment formula