Response Analysis of MW-Class Floating Offshore Wind Power System using International Standard IEC61400-3-2
Article information

Abstract
In 2019, the Korean government announced the 3rd Basic Plan for Energy, which included expanding the rate of renewable energy generation by 30 −40% by 2040. Hence, offshore wind power generation, which is relatively easy to construct in large areas, should be considered. The East Sea coast of Korea is a sea area where the depth reaches 50 m, which is deeper than the west coast, even though it is only 2.5 km away from the coastline. Therefore, for offshore wind power projects on the East Sea coast, a floating offshore wind power should be considered instead of a fixed one. In this study, a response analysis was performed by applying the analytical conditions of IEC61400-3-2 for the design of floating offshore wind power generation systems. In the newly revised IEC61400-3-2 international standard, design load cases to be considered in floating offshore wind power systems are specified. The upper structure applied to the numerical analysis was a 5-MW-class wind generator developed by the National Renewable Energy Laboratory (NREL), and the marine environment conditions required for the analysis were based on the Ulsan Meteorological Buoy data from the Korea Meteorological Administration. The FAST v8 developed by NREL was used in the coupled analysis. From the simulation, the maximum response of the six degrees-of-freedom motion and the maximum load response of the joint part were compared. Additionally, redundancy was verified under abnormal conditions. The results indicate that the platform has a maximum displacement radius of approximately 40 m under an extreme sea state, and when one mooring line is broken, this distance increased to approximately 565 m. In conclusion, redundancy should be verified to determine the design of floating offshore wind farms or the arrangement of mooring systems.
1. Introduction
In 2017, the South Korean government established a plan to increase the rate of renewable energy development to 20% by 2030 through the Renewable Energy 3020 Policy. To achieve this, the security of additional renewable energy installation of 48.7 GW is required by 2030, among which 16.5 GW will be replaced by wind power generation. According to a detailed plan published by the Ministry of Trade, Industry, and Energy, approximately 13 GW will be provided by offshore wind power generation. The resource technical saving potential of the domestic offshore wind power is approximately 33.2 GW, whereas the geological saving potential including the offshore with a water level exceeding 50 m is approximately 215.9 GW (Korea New & Renewable Energy Center, 2016). Based on these values, to achieve the policy objectives seamlessly, offshore wind power generation must be considered because of the high wind resource- saving potential and relatively easy construction of large-scale complexes. Moreover, the depth of the East Sea coast of Korea reaches 50 m even though it is only 2.5 km away from the coastline, and the depth of water becomes deeper rapidly compared with those of the west and south coasts. Therefore, it is more suitable to consider the floating system instead of the fixed system for offshore wind power generation on the east coast. In this study, the response analysis of a 5-MW-Class floating offshore wind power generation system was performed while applying the marine environmental conditions of the east coast, and the spar-type platform of the Offshore code comparison collaboration (OC3) project was applied as a substructure. The target sea area for the installation was determined to be the sea with a 150-m-deep water level near the east sea gas field that is 58 km away from the Ulsan port. For a marine environment, the extreme marine design external force was estimated using the data of the Ulsan automatic ocean observation buoy managed by the meteorological office (KMA, 2020). The numerical analysis was performed under an extreme marine environmental condition and the failure condition considered in the floating offshore wind power generation system specified in the IEC61400-3-2 standard revised in April 2019. Based on the numerical analysis results, the six degree-of-freedom motion response and maximum load response were proposed, and the drift response of the floating structure in the one mooring chain fracture condition was identified.
2. Numerical Analysis Input
2.1 Floating Offshore Wind Power Systems
The 5-MW-Class wind power generator of the National Renewable Energy Laboratory (NREL) was utilized for the upper structure of the floating offshore wind power generation system in the numerical analysis. The NREL 5-MW-Class wind power generator is a model widely used in numerous studies worldwide (Jonkman et al, 2009). The properties of the upper turbine are summarized in Table 1. For the lower floating platform, the cylindrical floating platform used in the OC3 (offshore code comparison collaboration) project manufactured by IEA Wind Task 23 was utilized, the shape of which is shown in Fig. 1 (Jonkman, 2010). The OC3-Spar floating platform is shaped as a symmetrical cylinder, and its six degrees-of-freedom motion response is less sensitive to the different operating directions of hydraulic force compared with floating platforms of different shapes.
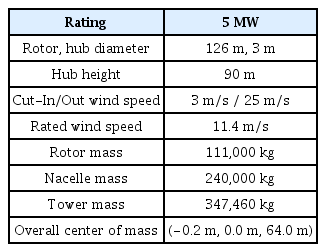
NREL 5-MW baseline wind turbine properties

OC3 Spar platform general arrangement
The specifications of the floating platform are summarized in Table 2, and because the mooring system designed in the OC3 project reflects the water depth of 320 m, a mooring system was redesigned based on the 150-m water depth of the sea near the east sea gas field in this study. During this process, the angle of the mooring chain connected at the fairlead and the pretension was maintained identical, and the touchdown length at the sea bottom was designed to be longer to prevent lift up at the anchor. Information regarding the mooring system of the OC3-spar floating platform and the redesigned mooring system is summarized in Table 3.
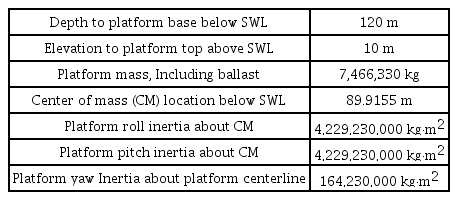
OC3 spar floating platform properties

OC3 spar mooring system arrangement
2.2 Environmental Conditions
In this study, the environmental conditions of the sea near the east sea gas field that is 58 km away from the Ulsan offshore were utilized as input data to design the external force. The gas production in the east sea gas field platform is scheduled to be halted in June 2021, and it is planned to be used to develop a floating offshore wind power generation complex thereafter. The depth of water in this sea is approximately 150 m, and because actual measurement data of the east sea gas field are currently unavailable, the analysis was conducted using the measurement data of the Ulsan automatic ocean observation buoy managed by the meteorological office. The Ulsan automatic ocean observation buoy is located approximately 17 km away from the east sea gas field platform, and it has been measuring marine physics from October 2015 until the present day. To estimate the offshore design external force, the measurement data from 3 years (from 2016 to 2018) were used, and the meta information of the analyzed data are provided in Table 4. The wind speed at a height of 4.3 m measured at the buoy was converted to the wind speed at 100 m height by applying the power law wind shear expressed in Eq. (1) based on the IEC61400-3-1 standard. For the extreme statistical analysis for estimating the extreme marine design external force, the Gumbel method presented in Eq. (2) was utilized, and 36 standard datasets were used by extracting 12 peak values from one year.
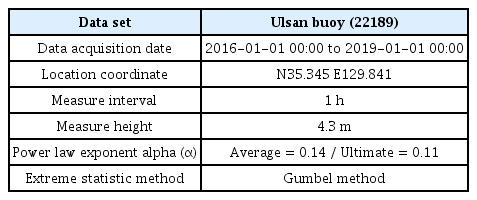
Meta information of Ulsan meteorological buoy data
Based on the extreme statistical analysis results, the extreme wind speed for the 50-year cycle was estimated to be 39.83 m/s, and for the regression analysis coefficient of the Gumbel function, a scale parameter (β) of 1.802 and a mode parameter (μ) of 19.798 were applied. The 50-year cycle extreme significant wave height value was calculated to be 11.117 m, and a β of 1.206 and μ of 6.411 were applied. Moreover, the correlation between the wave period and wind speed of the target sea along with the selection of extreme current were determined based on a paper published by the coauthor of this study (Shin et al, 2019). Table 5 presents the waves, current velocity, and tide level at different wind speeds used as input data for the numerical analysis. The main directions of the measured wind were Northeast, Southwest, and South–Southwest, whereas the main directions of the wave were North, Northeast, and South.

Marine environmental condition of East Sea gas field
2.3 Design Load Cases
In the IEC61400-3-2 newly revised in April 2019, the analysis conditions that must be considered in the floating system are specified, i.e., DLC9.x is a fault condition at the normal operation status, and DLC10.x is a fault condition under extreme marine environment. The fault condition of the floating offshore wind power generation system defines the fracture of the one mooring chain and a leakage condition due to the damage to the floating platform. In this study, to investigate the response characteristics of the floating platform in an extreme marine condition, DLC1.6 and DLC6.1 were selected by referring to the IEC61400-3-1 standard. Furthermore, to analyze the drifting response of a floating platform due to the fracture of a mooring chain specified in the IEC61400-3-2 standard, the DLC9.2 and DLC10.2 conditions were selected (IEC, 2019a; IEC, 2019b). The design load cases for which the numerical analysis was performed are tabulated in Table 6. DLC1.6 is a normal operation status, where the wind power generator produces electricity and the severe sea state was applied for the marine condition. The most severe marine state in the power production condition is a cut-out wind speed of 25 m/s, and the corresponding significant wave height is 8.88 m. DLC6.1 is a condition that considers the extreme marine condition with a 50-year duration of the design life, and it is a parked state where the wind power generator does not produce electricity. The extreme design wind speed for the 50-year duration for the east sea gas field is 39.83 m/s, and the corresponding significant wave height is 11.12 m. DLC9.2 is a normal sea state condition at a power production condition and the external force at a rated wind speed of 11.4 m/s, where the maximum thrust of the upper turbine is produced, is applied. To investigate the maximum response characteristics based on the direction of the environmental load, the environmental external force of nine directions was applied in DLC6.1 by combining the main directions of wind and wave, as shown in Fig. 2. The multidirection and misalignment conditions of the environmental load must be considered in DLC9.2 and DLC10.2. However, in this study, the numerical analysis was performed using only the design external force of the single direction to investigate the maximum response characteristics. The load response results at each analytical condition were suggested using the safety factor tabulated in Table 7.

Design load cases for numerical simulation

Configurations of DLC1.6 and DLC6.1
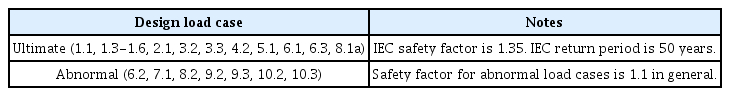
IEC61400-3-2 safety factor recommendation
2.4 Numerical Analysis Tool
For the numerical analysis, Fast v8, a complex coupled analysis tool developed at the NREL (USA), was used (Jonkman and Buhl, 2005). The hydrodynamic force applied at the OC3 Spar floating platform was calculated using the University of Ulsan in-house code and was inserted in the Hydrodyn as an input value. The wind turbulence, which comprised three random seeds, was generated using Turbism. The wave comprised two random seeds with Jonswap spectrum irregular waves applied for 1 h. Therefore, each analysis condition comprised six simulations with a duration of 1 h. For the numerical analysis results, the maximum value of the time series was extracted using Mextremes, a post-processing program, and the first 200 s of the analysis initial stage, which was a transient response region, was disregarded. Fig. 3 shows the flow diagram of the numerical analysis simulation.
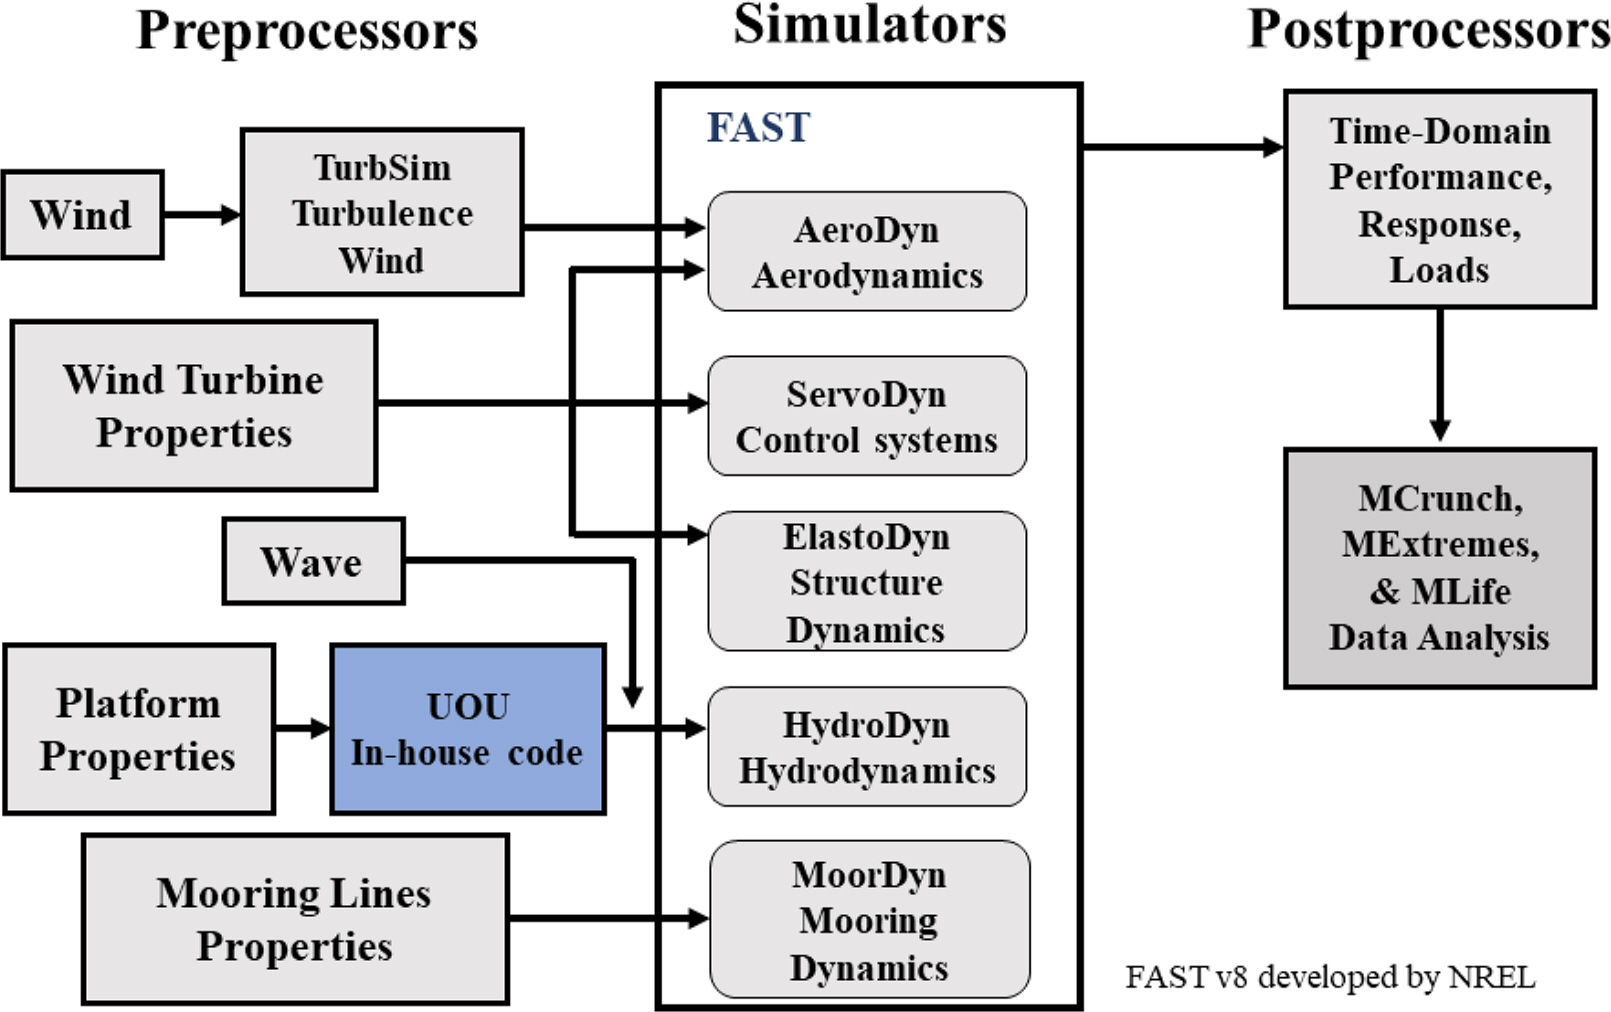
FAST simulation flow chart
3. Numerical Analysis Result
3.1 Ultimate Response Verification
Table 8 presents the maximum six degree-of-freedom motion response that occurred in DLC1.6 and DLC6.1. The straight-line motion of the floating platform in the sea was governed by the hydraulic force; hence, the surge and heave responses were greater at DLC6.1 with a larger significant wave height applied. Yaw motions of 4° and 9.5° occurred in DLC1.6 and DLC6.1, respectively. The yaw motion in DLC6.1 was higher due to the environmental external force was in misalignment and the multi-directions. Table 9 lists the maximum bending moment occurring at the connected part of the blade and tower. The moment that occurred at the blade connected part was approximately 1.6 times larger in the stationary DLC6.1, whereas the moment that occurred at the tower base was approximately 1.1 times larger than that in DLC1.6. Table 10 presents the maximum tension response applied to the mooring chain in the fairlead. Line 1 of the mooring chain was placed in the (+) surge direction of the floating platform, whereas lines 2 and 3 were installed diagonally to the (−) surge direction. Because lines 2 and 3 are applied to restore tension when surge motion occurs in the floating platform, the maximum tension of these lines was larger than that of line 1. To identify the fracture of the mooring chain in the extreme marine environmental condition, the breaking load of the mooring chain was calculated using Eq. (3) (DNV GL, 2015). For the mooring chain of studless chain class R3 the MBL was calculated to be 10574 kN when the diameter was set at 117 mm. Because the maximum tension that occurred in DLC6.1 was 5625 kN, the mooring chain did not fracture.
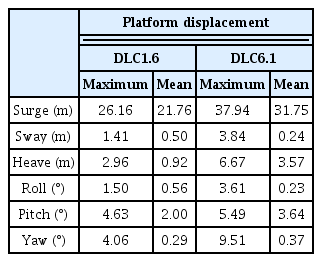
Platform displacement of DLC1.6 and DLC6.1

Maximum bending moment of DLC1.6 and DLC6.1

Maximum fairlead tension of DLC1.6 and DLC6.1
3.2 Redundancy Verification
Table 11 lists the maximum six degree-of-freedom motion response observed in DLC9.2 and DLC10.2. DLC9.2 assumes the mooring chain fracture condition at a normal operating condition. To identify the response when the maximum thrust occurs at a rotating rotor, a wind speed of 11.4 m/s, i.e., the rated wind speed, was applied and the corresponding significant wave height was 2.5 m. In this study, for redundancy verification, two mooring chain fracture scenarios were assumed (Fig. 4). Case 1 is a fracture scenario involving a mooring chain placed parallel to the operating direction of the environmental load, and case 2 is one involving a mooring chain placed diagonally to the applied load. DLC10.2 considers the mooring chain fracture in the extreme marine environment condition and the fracture condition is the same as that of DLC9.2. Fig. 5 shows the new mean position of the floating platform, the drift motion of which was stopped after the mooring chain fractured. First, in DLC9.2 case 1, a maximum surge motion of 565.8 m occurred and for the case of mooring chain fracture, the floating platform drifted 554 m in a straight displacement and then stopped. A similar surge motion was observed in DLC10.2 case 1, where the floating platform drifted 558 m in a straight displacement and then stopped. In DLC9.2 case 2, a maximum surge motion of 281.7 m and a sway motion of 427.8 m occurred simultaneously. For case 2 of both DLC9.2 and DLC10.2, it was discovered that the floating platform drifted 510 m in a straight displacement in the diagonal direction then stopped. Because the movement displacement difference of the floating platform was not significantly affected by the environmental external force condition, it was confirmed that the new average location of the floating platform was governed primarily by the mooring tension than by the environmental load. In terms of the rotating movement, yaw motion almost did not occur in DLC9.2 because the control system operated normally and corrected the yaw error. On the contrary, a maximum pitch angle of approximately 13° was achieved because the maximum thrust occurred at the rotor at the rated wind speed and the mooring chain fractured; hence, the angular motion of the floating platform could not be maintained.

Platform displacement of DLC9.2 and DLC10.2
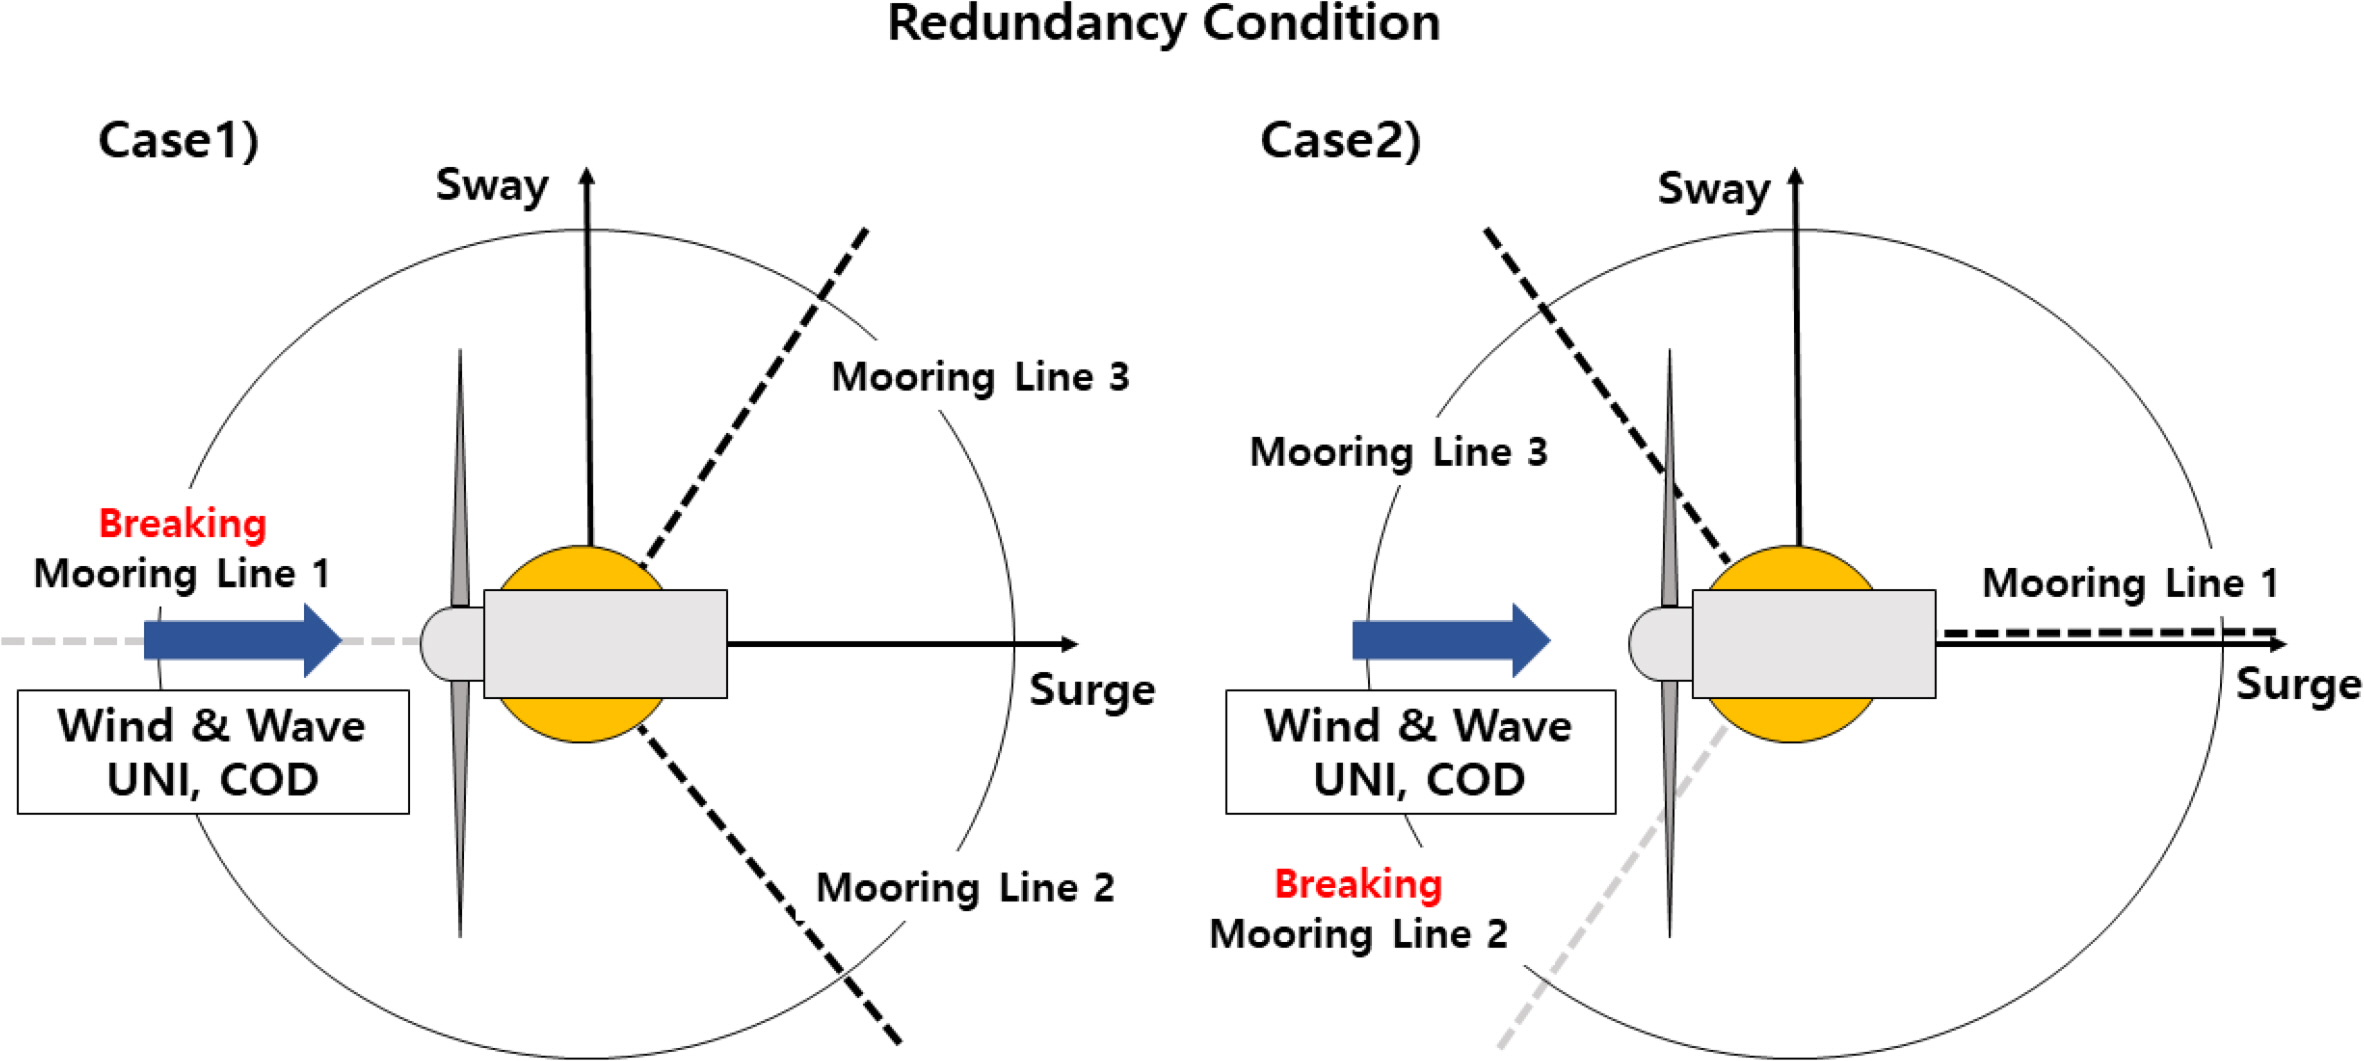
Mooring line breaking configuration
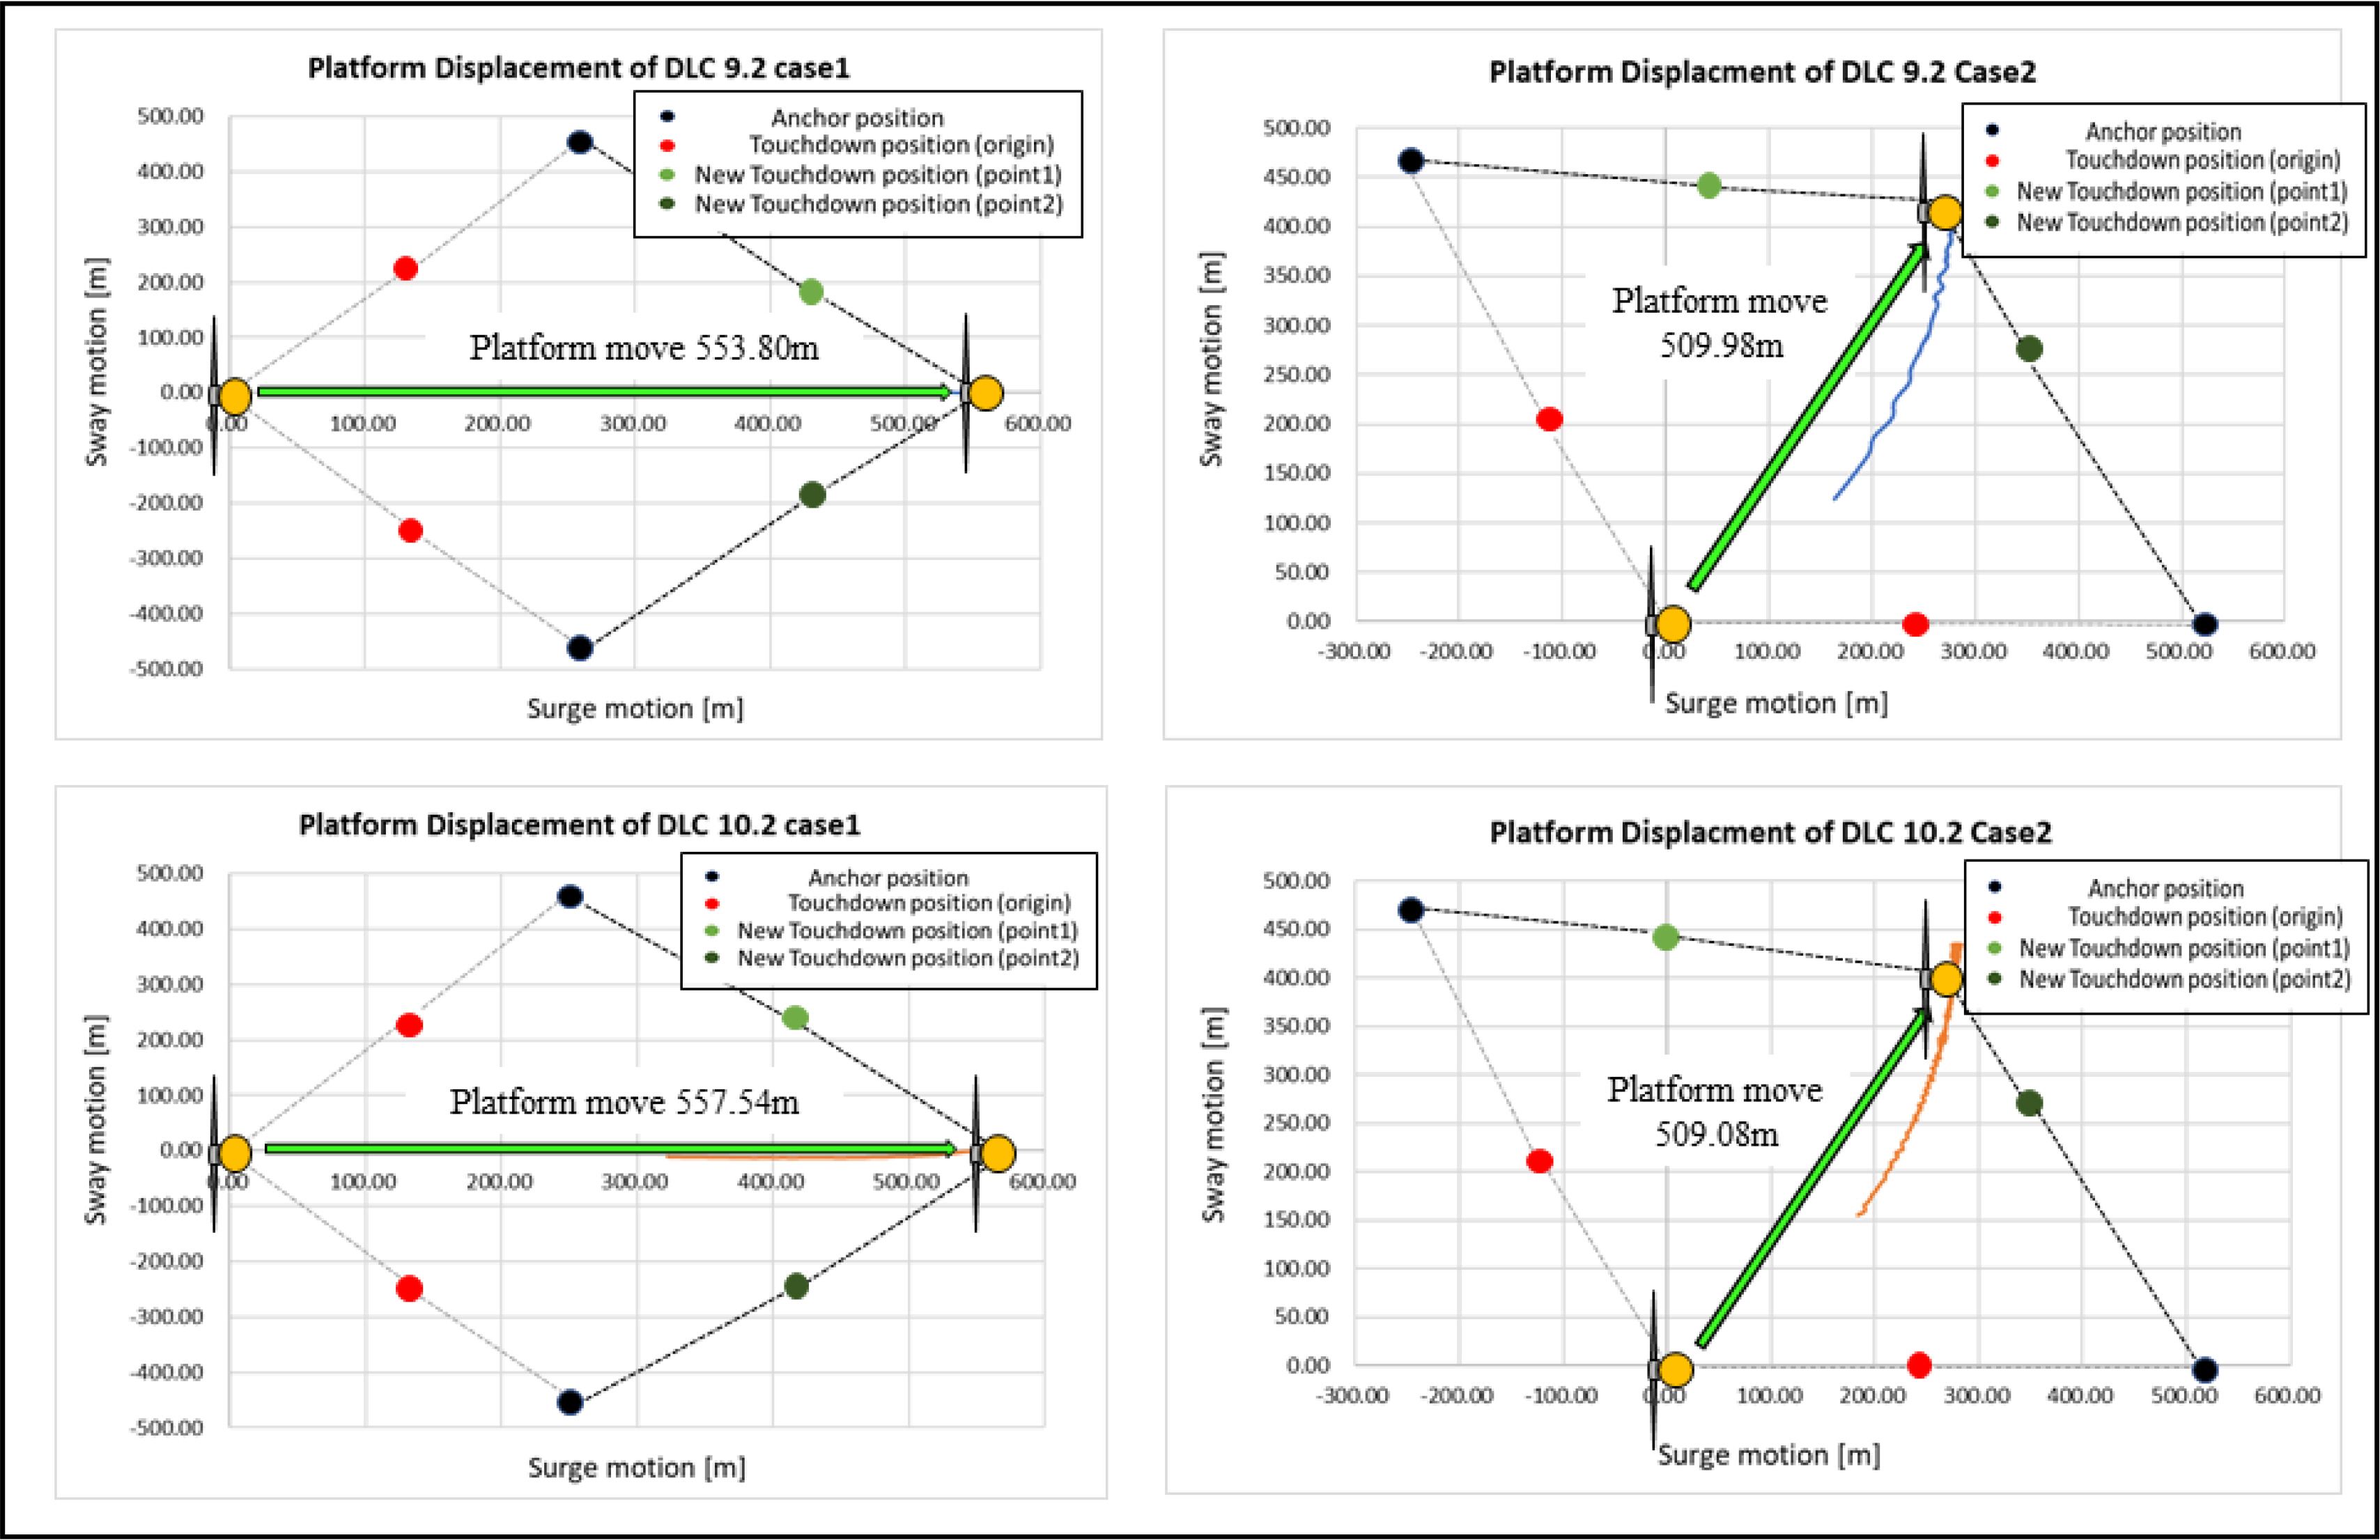
Platform new mean position of DLC9.2 and DLC10.2
Table 12 lists the maximum load response results of DLC9.2 and DLC10.2, which were abnormal scenarios; hence, a low safety factor of 1.1 was applied, whereas the maximum bending moment that occurred at the tower base of DLC9.2 was approximately 205 MN·m, which was the highest among all the conditions analyzed. Therefore, this abnormal condition must be partially considered during structural analysis, along with redundancy verification. It was discovered that the bending moment at the blade root part of case 1 in DLC10.2 differed significantly from that of case 2 in DLC10.2. Based on the time history results of the analysis, a transient response was observed at the out-of-plane and in-plane of the blade tip up to 800 s after 200 s; consequently, the bending moment appeared to be high. The results showed that under the same analysis condition, the load response occurred differently depending on the mooring chain fracture characteristics.
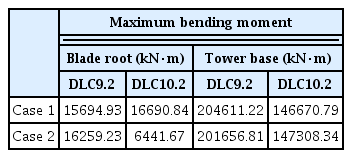
Maximum bending moments of DLC9.2 and DLC10.2
Table 13 lists the tension of the mooring chain. As the maximum tension that occurred was lower than that of the three-point mooring, no additional mooring chain fracture was anticipated.
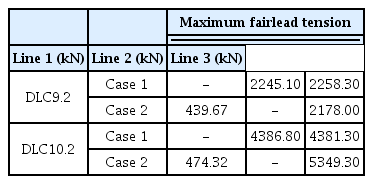
Maximum fairlead tension of DLC9.2 and DLC10.2
4. Conclusions
In this study, the numerical analysis of a megawatt-level floating offshore wind power generation system was performed by applying the internal standard of the International Electronical Commission. The 5-MW-level wind power turbine of the NREL and the OC3-Spar-type floating platform were used for the numerical analysis. Subsequently, the response analysis was performed in an extreme marine environmental condition and a failure condition. Based on the results of the extreme marine environment, the maximum movement radius of the floating platform was 39 m for three-point mooring, whereas it was 565 m for two-point mooring owing to the fracture of the mooring chain. Based on these results, the redundancy verification condition specified in IEC61400-3-2 must be requisitely reviewed to secure a safe separation distance of the wind power generator when constructing a large-scale floating offshore wind power complex. Moreover, the moving displacement difference of the floating platform in DLC9.2 and DLC10.2 was less than 1%, suggesting that the movement radius for the two-point mooring was governed by the mooring tension instead of the environmental external force. The maximum bending moment at the connected part of the blade appeared in DLC 6.1 where the output was halted, whereas the maximum bending moment of the tower and the connected part of the platform occurred in DLC9.2 during the normal operation. Although DLC9.2 is an abnormal status wherein the mooring chain is fractured, the maximum load response was observed; hence, it is an analysis condition that must be considered during structure analysis. The maximum tension applied at the mooring chain did not result in fracture when a diameter of 117 mm was employed for the mooring chain redesigned in this study. However, the redundancy verification indicated that the touchdown point of the mooring chain moved with a drift in the floating platform; hence, it must be analyzed to prevent fracture due to interference among mooring chains for the wind farm design. In future studies, a comparative investigation pertaining to cylindrical and semisubmersible floating platforms as well as an analysis of leakage, i.e., a failure condition specified in IEC61400-3-2, will be performed to investigate the movement performance and load response of each floating platform.
Nomenclature
α
Power exponent alpha
ECM
Extreme current model
ESS
Extreme sea state
EWM
Extreme wind speed model
EWLR
Extreme water level range
MBL
Minimum breaking load (kN)
MSL
Mean sea level
NCM
Normal current model
NSS
Normal sea state
NTM
Normal turbulence model
NWLR
Normal water level range
SSS
Severe sea state
SWL
Sea water level
zh
Hub height above sea water level (m)
zr
Reference height above sea water level (m)
Acknowledgements
This research was supported by the Korea Institute of Energy Technology Evaluation and Planning (KETEP) grant funded by the Korean government (MOTIE) (20184030202280) and the Korea Electric Power Corporation (R18XA03).