Discussions on Availability of Weather Information Data and Painting Effect of Existing 8,600 TEU Container Ship Using Ship Performance Analysis Program
Article information

Abstract
This paper discusses the effectiveness of onboard measurements and data extracted from weather information for speed-power analysis. Furthermore, validation results of hull and propeller cleaning and painting during dry-docking are discussed. Wind and wave information can be obtained from onboard measurements or weather information from the National Oceanic and Atmospheric Administration (NOAA). The weather information of a specified position and time is extracted from NOAA weather data and compared with onboard measurements. In addition, to validate the effects of hull cleaning and painting during dry-docking, speed-power analysis results of before and after dry-docking are compared. The results show that both onboard measurements and weather information show acceptable reliability when added resistance and speed-power analysis results are compared with each other. Moreover, the ship performance analysis (SPA) software clearly shows the effects of hull cleaning and painting, and it can provide reliable analysis results with either onboard measurements or weather information. In conclusion, it is confirmed that the analysis method and SPA software used in this study are effective in analyzing the ship’s speed-power performance.
1. Introduction
Global warming by greenhouse gases (GHGs) is a critical issue, and the International Maritime Organization (IMO) has been continuously discussing regulations to reduce GHG emissions. The energy efficiency design index (EEDI) has been applied to new ships, whereas the energy efficiency existing ship index (EEXI) for regulating existing ships is under discussion (IMO, 2014; IMO, 2019).
To reduce GHG emissions from new ships, many technologies have been developed, primarily for shipyards. To reduce GHG emissions from existing ships and improve their operating efficiency, shipping companies are focusing on securing eco-friendly operating technology with fuel-saving benefits, such as low-speed operations, partial modifications of ship hull, and installation of energy-saving devices (ESDs).
Existing ships are periodically docked for the sanding, cleaning, and painting of the hull and propeller. These restore their resistance and propulsion performance. Recently, divers or robots also clean the hull and propeller of ships while they are moored in ports (Lysklett, 2018; Noordstrand, 2018). However, no precise method were available for verifying the fuel-saving effect of such activities.
To verify such activities, technology that can accurately identify the fuel consumption which emits GHGs during operation is necessary. The fuel consumption of an existing ship is the sum of the fuel for sailing at the speed through water (VS) on a calm sea, and the additional fuel to respond to the added resistance due to wind and waves, and the resistance increase due to water temperature deviation caused by the marine environment. If the fuel consumption of each item can be identified, then the eco-friendly operating technologies applicable to shipping companies can be evaluated precisely; hence, plans for eco-friendly operations can be established.
European shipping companies are attempting to measure the thrust at propeller shaft in addition to the torque in order to evaluate the resistance and propulsion performance of existing ships. Once highly accurate thrust measurements are available, then the aging effect of the hull can be estimated separately from the aging degree of the propeller. In addition, the verification of the effect of the retrofitting of bulbous bow and the modification of propeller boss cap fin has been attempted; however, it was difficult to obtain quantitative and clear results. (Paereli et al., 2016; Ballegooijen et al., 2017).
The authors of this study developed a ship performance analysis (SPA) software program for operating ships based on the calculation procedure of the International Organization for Standardization (ISO) standard (ISO15016:2015)(ISO, 2015), which calculate the reference speed in calm seas included in the EEDI regulated by the IMO.
The analysis method and the software have been described by Park et al. (2019). Lee et al. (2019). Shin et al. (2020) verified the validity of the SPA software program and analysis method by conducting the speed-power analysis of a 176 K bulk carrier and an 8,600 TEU container ship in operation. The authors constructed the mean stowage diagram of containers by analyzing the operating condition and obtained onboard measurement data by improving the data transmission system owned by the shipping company. The authors confirmed that a comparison between the speed-power line in calm seas obtained as the analysis result and the model test speed-power line clearly showed an increase in the delivered horse power (DHP) due to hull and propeller fouling and aging.
For the speed-power analysis of an existing ship, the location, speed, weight of cargo, and DHP of the ship as well as ocean climate environments information such as wind, wave, and sea water temperature are required. The ocean climate environments can be obtained through onboard measurements or by extracting data based on the time and position of the ship from the weather information of the National Oceanic and Atmospheric Administration (NOAA). In particular, for the analysis of added resistance due to wave, the values of the wave height, direction, and period are required for the sea wave and swell. These values can be obtained onboard from the observation of sailors or measurements using wave radar. However, it is extremely difficult for sailors to continuously observe waves, and wave radar is rarely installed on existing ships. Therefore, it is practical to extract data from weather information; however, studies that validate the accuracy of the information are nearly absent.
To verify the weather information in this study, the onboard measurements of the wave height, direction, and period obtained by installing wave radar in an existing ship were compared with data extracted from the weather information. In addition, the added resistance due to waves analyzed using the values obtained by each method were compared along with the speed-power analysis result applying each method. Furthermore, a study on wind speed and direction were also conducted with the same principle and the results were compared. Consequently, it was confirmed that both data obtaining method showed valid analysis results.
Existing ships are typically dry-docked every five years for inspection and maintenance. During dry-docking, the hull surface and propeller are cleaned and painted, and the verification of the effect of such activities is critical to shipping companies. In this study, the docking effect was quantitatively verified by analyzing the powering performance before and after docking using SPA software.
The results of this study show that the precise powering performance of an existing ship as well as the added DHP due to the resistance increase from wind and waves, as well as sea water temperature deviations can be calculated. In addition, this study on the effects of hull and propeller cleaning and painting performed during dry-docking and the GHG reduction by retrofitted ESDs is expected to be applied for green shipping.
2. 8,600 TEU Container Ship Overview
The target ship of this study is an 8,600 TEU container ship. Fig. 1 shows a photograph of the target ship, and Table 1 lists its principal particulars. The ship is identical to the target ship of Shin et al. (2020), and its main route includes South Korea, China, Singapore, the Middle East, and Europe. The standard operating conditions were determined by analyzing the operating profile of the shipping company and summarized in Table 1.
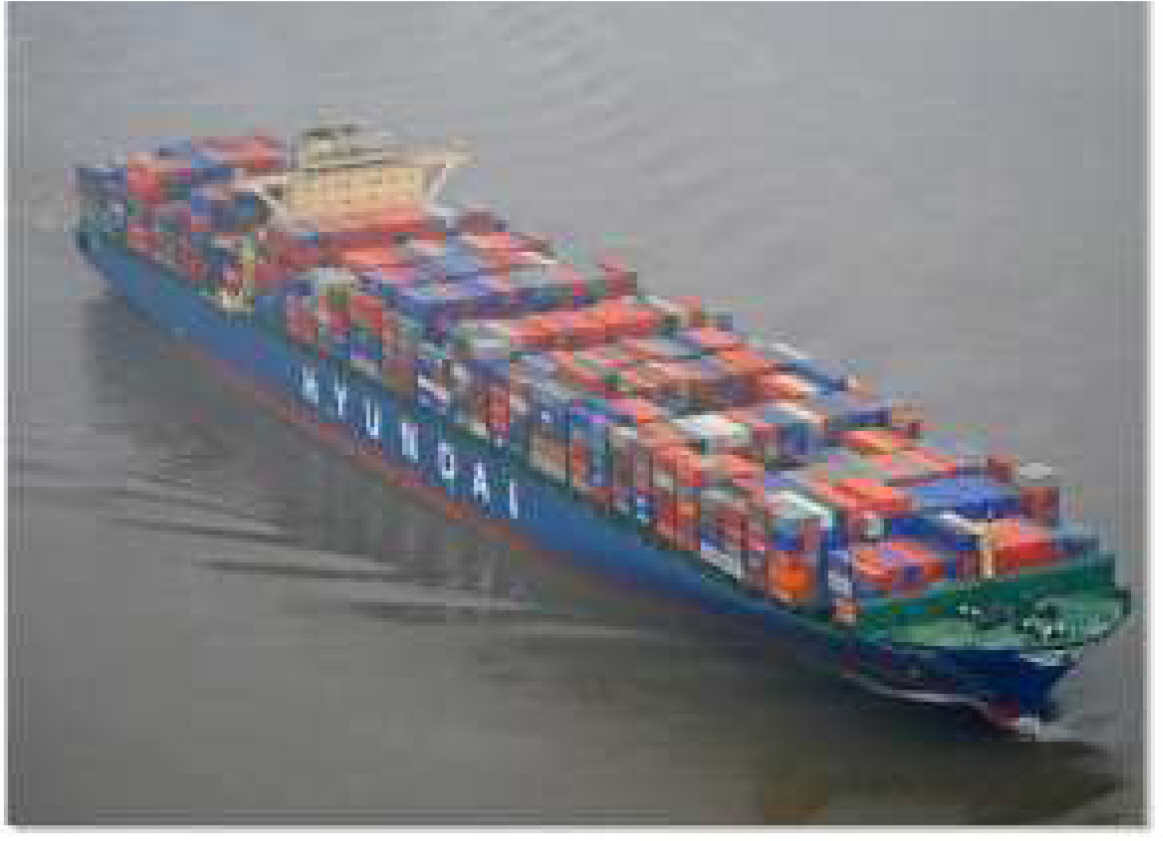
Photograph of 8,600 TEU container ship (Shin et al., 2020)
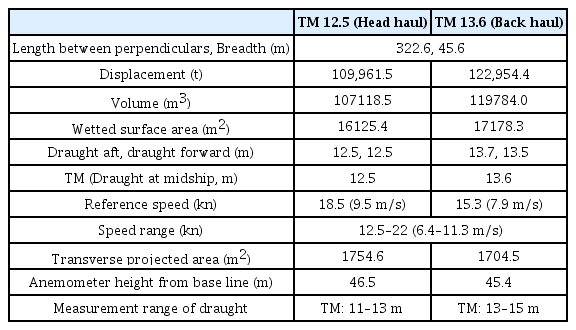
Standard operating condition for the speed-power analysis Shin et al. (2020)
The target ship is equipped with an energy efficiency monitoring system. This system collects various operating data in real time and transmits them to land. It collects more than 80 types of data, such as the DHP, fuel consumption, water temperature, wind speed, and wind direction, which further include more than 40 types of data, such as course, heading, and ballast water (Shin et al., 2020).
3. Wind and Wave Data Extraction from Weather Information
As for the ocean weather information used in this study, the values are calculated using a high-performance computer based on numerical weather prediction models. For the numerical weather prediction models, the meteorological modeling of the Earth’s weather system was performed using physical equations that governed the state and motion of the atmosphere.
For the speed-power analysis, the weather information of wind, waves, tidal currents, water temperature, air temperature, and atmospheric pressure in the waters of the ship operation was required as input data. Such information was collected from various numerical weather prediction models, as shown in Table 2.

Ocean weather information for ship performance analysis
The global ocean weather information was provided by the NOAA and the European Centre for Medium Range Weather Forecasts. In this study, weather information from the NOAA, which has been widely used for oceanic studies, was adopted.
The NOAA provides ocean weather information every three hours, eight times a day. The information is provided in a data format referred to as gridded binary (Grib). Because Grib files are not in a format that can be directly used for data analysis, the files must be stored in a database after they are decoded; subsequently, the data are to be extracted for the desired position and date. Weather data are provided at 0.5° latitude and longitude intervals eight times a day. The amount of data is approximately 30 million, a size that is difficult to process in a typical relational database. To secure fast performance, the data were stored and processed in a distributed database.
The ocean weather information was prepared in the form of predefined latitude and longitude grids. Fig. 2 shows an example of such information on waves in grid form. To obtain accurate weather information for a specific ship position based on this form, the weather information must be interpolated.
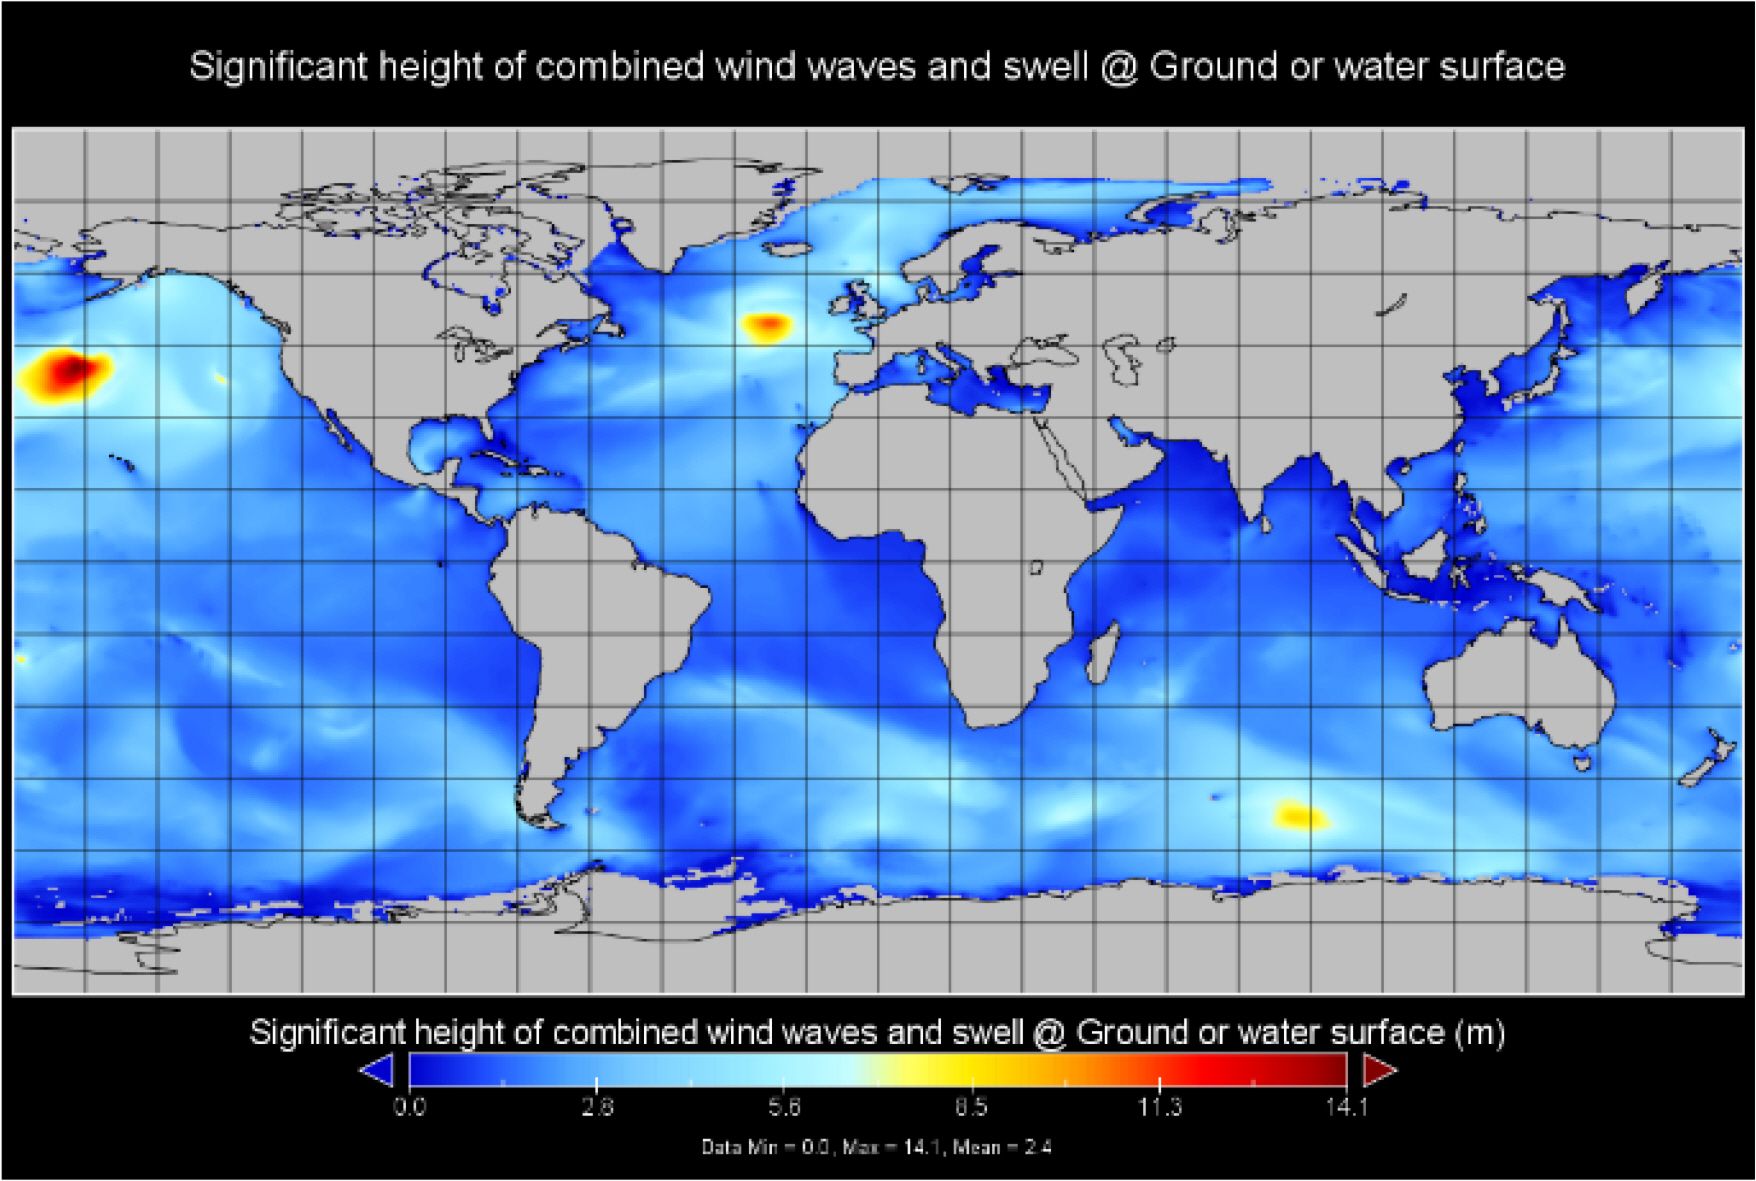
Visualization of wave height information using NWW3 (NOAA Wave Watch 3) model.
Because the weather information used in this study was provided at 0.5° latitude and longitude intervals every three hours, spatio–temporal interpolation was required. Hence, the data values were interpolated for the sides and for an arbitrary internal point of a hexahedron with eight vertices in a three-dimensional (3D) space. Trilinear interpolation, a 3D interpolation method, was applied under the assumption that the values on each side were linear. In the trilinear interpolation method, the interpolated values at M and N were obtained first, and the value at R was interpolated from them to obtain P, which is the value of the current position and time of the ship, as shown in Fig. 3. The value at S was interpolated using the same method, and the final P value was obtained from S and R.
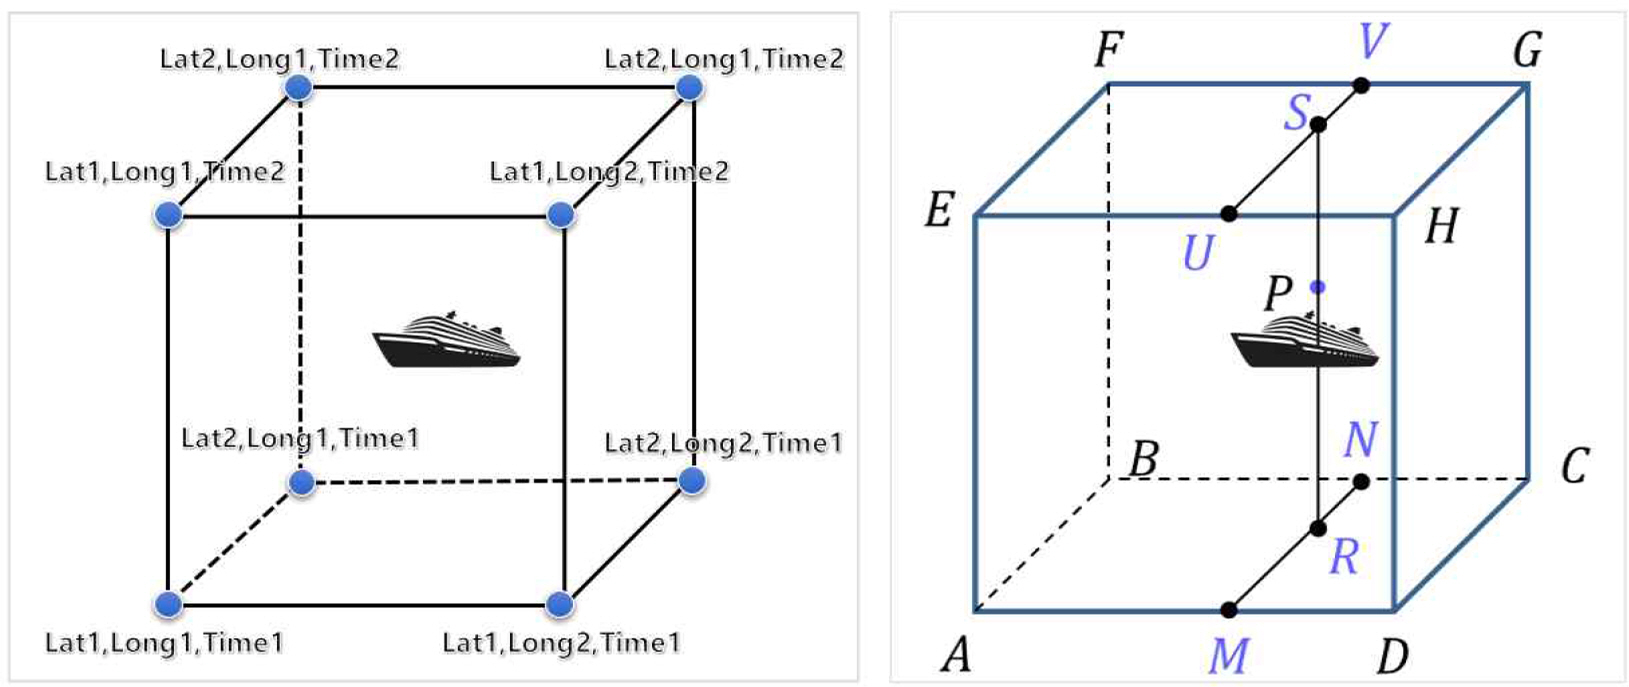
Trilinear interpolation diagram based on ship position and time
4. Speed-Power Analysis Results
4.1 Comparison of Wind Resistance between Onboard Measurements and Weather Information
To calculate the added resistance due to the ocean environment for the speed-power analysis of an existing ship, the accuracy and reliability of the input data must be reviewed first. In this section, the analysis results obtained based on onboard measurements (Shin et al., 2020) using an ultrasonic anemometer installed for accuracy improvement are compared with those obtained using the data extracted from the NOAA weather information based on the ship position and time to discuss the accuracy and availability of the data.
The onboard measurements of the relative wind speed and direction were converted to true wind speeds and directions using Eqs. (1) and (2). Here, the relative wind direction is the clockwise angle from the head, and the head wind is 0°.
The converted wind speed (VWT) and wind direction (ψWT) are the true wind speed and true wind direction at the anemometer height, respectively. According to ISO15016:2015, wind blowing toward a ship can be classified into two categories. One is the wind resistance due to the speed of advance of the ship. This wind is the head wind and is a uniform flow. This resistance is not treated as added resistance due to wind. The other is natural wind, which is a shear flow whose speed increases with altitude. As the true wind speed obtained using Eqs. (1) and (2) is the speed at the height of the anemometer installed on the ship, it is converted to the true wind speed at the reference height using Eq. (3).
In Eq. (3), it is assumed that the shear flow profile based on the height from the ground follows the 1/7-squared profile, which is adopted by ISO15016:2015. In this study, a typical reference height value of 10 m was used, which is consistent with the weather information. The wind speed and direction measured using the anemometer installed on the ship were converted to the true wind velocity (VWTref) and true wind direction (ψWRef) at the reference height using Eqs. (1), (2), and (3). These values were converted to the relative wind speed (VWRef) and relative wind direction (ψWRef) using Eqs. (4) and (5), respectively, and the added resistance due to wind was calculated using Eq. (6).
Because the values extracted from the aforementioned weather information were the absolute wind speed (VWTref) and absolute wind direction (ψWT) at the reference height of 10 m, they were directly converted to the relative wind speed and direction at the reference height using Eqs. (4) and (5) without using Eqs. (1), (2), and (3); furthermore, the added resistance due to wind was calculated using Eq. (6). The resistance due to the uniform flow caused by speed of advance (VG) was not considered as added resistance, and only the added resistance caused by the speed and direction of natural wind was considered.
Fig. 4 shows comparisons of the wind data and analysis results between onboard measured and weather information data. The operating route was from Singapore to China in August 2018. The displacement condition of the ship was standard operating condition TM 12.5 m in Table 1. In Figs. 4(a) and (b), the x-axis is UTC+9 (Korean local time) and the y-axes are the relative wind speed and relative wind direction at the reference height, respectively. As for the relative wind speed, the measured wind speed was generally lower compared with the weather information, except for some sections on August 7th. The relative wind direction results were consistent within the range of ±20°. The wind resistance calculated using the Fujiwara regression formula of ISO15016:2015 (as shown in Fig. 4(c)) was generally low, similar to the wind speed. Fig. 4(d) shows the speed-power analysis results obtained by analyzing the wave resistance using the empirical correction method with frequency response function (hereafter, STAWAVE-2) of ISO15016:2015. The y-axis represents the normalized DHP based on the tank test results of 18.5 kn (9.5 m/s), which is the reference speed of TM 12.5 m in Table 1. The aforementioned tendency was reflected; however, a significant difference was not observed.
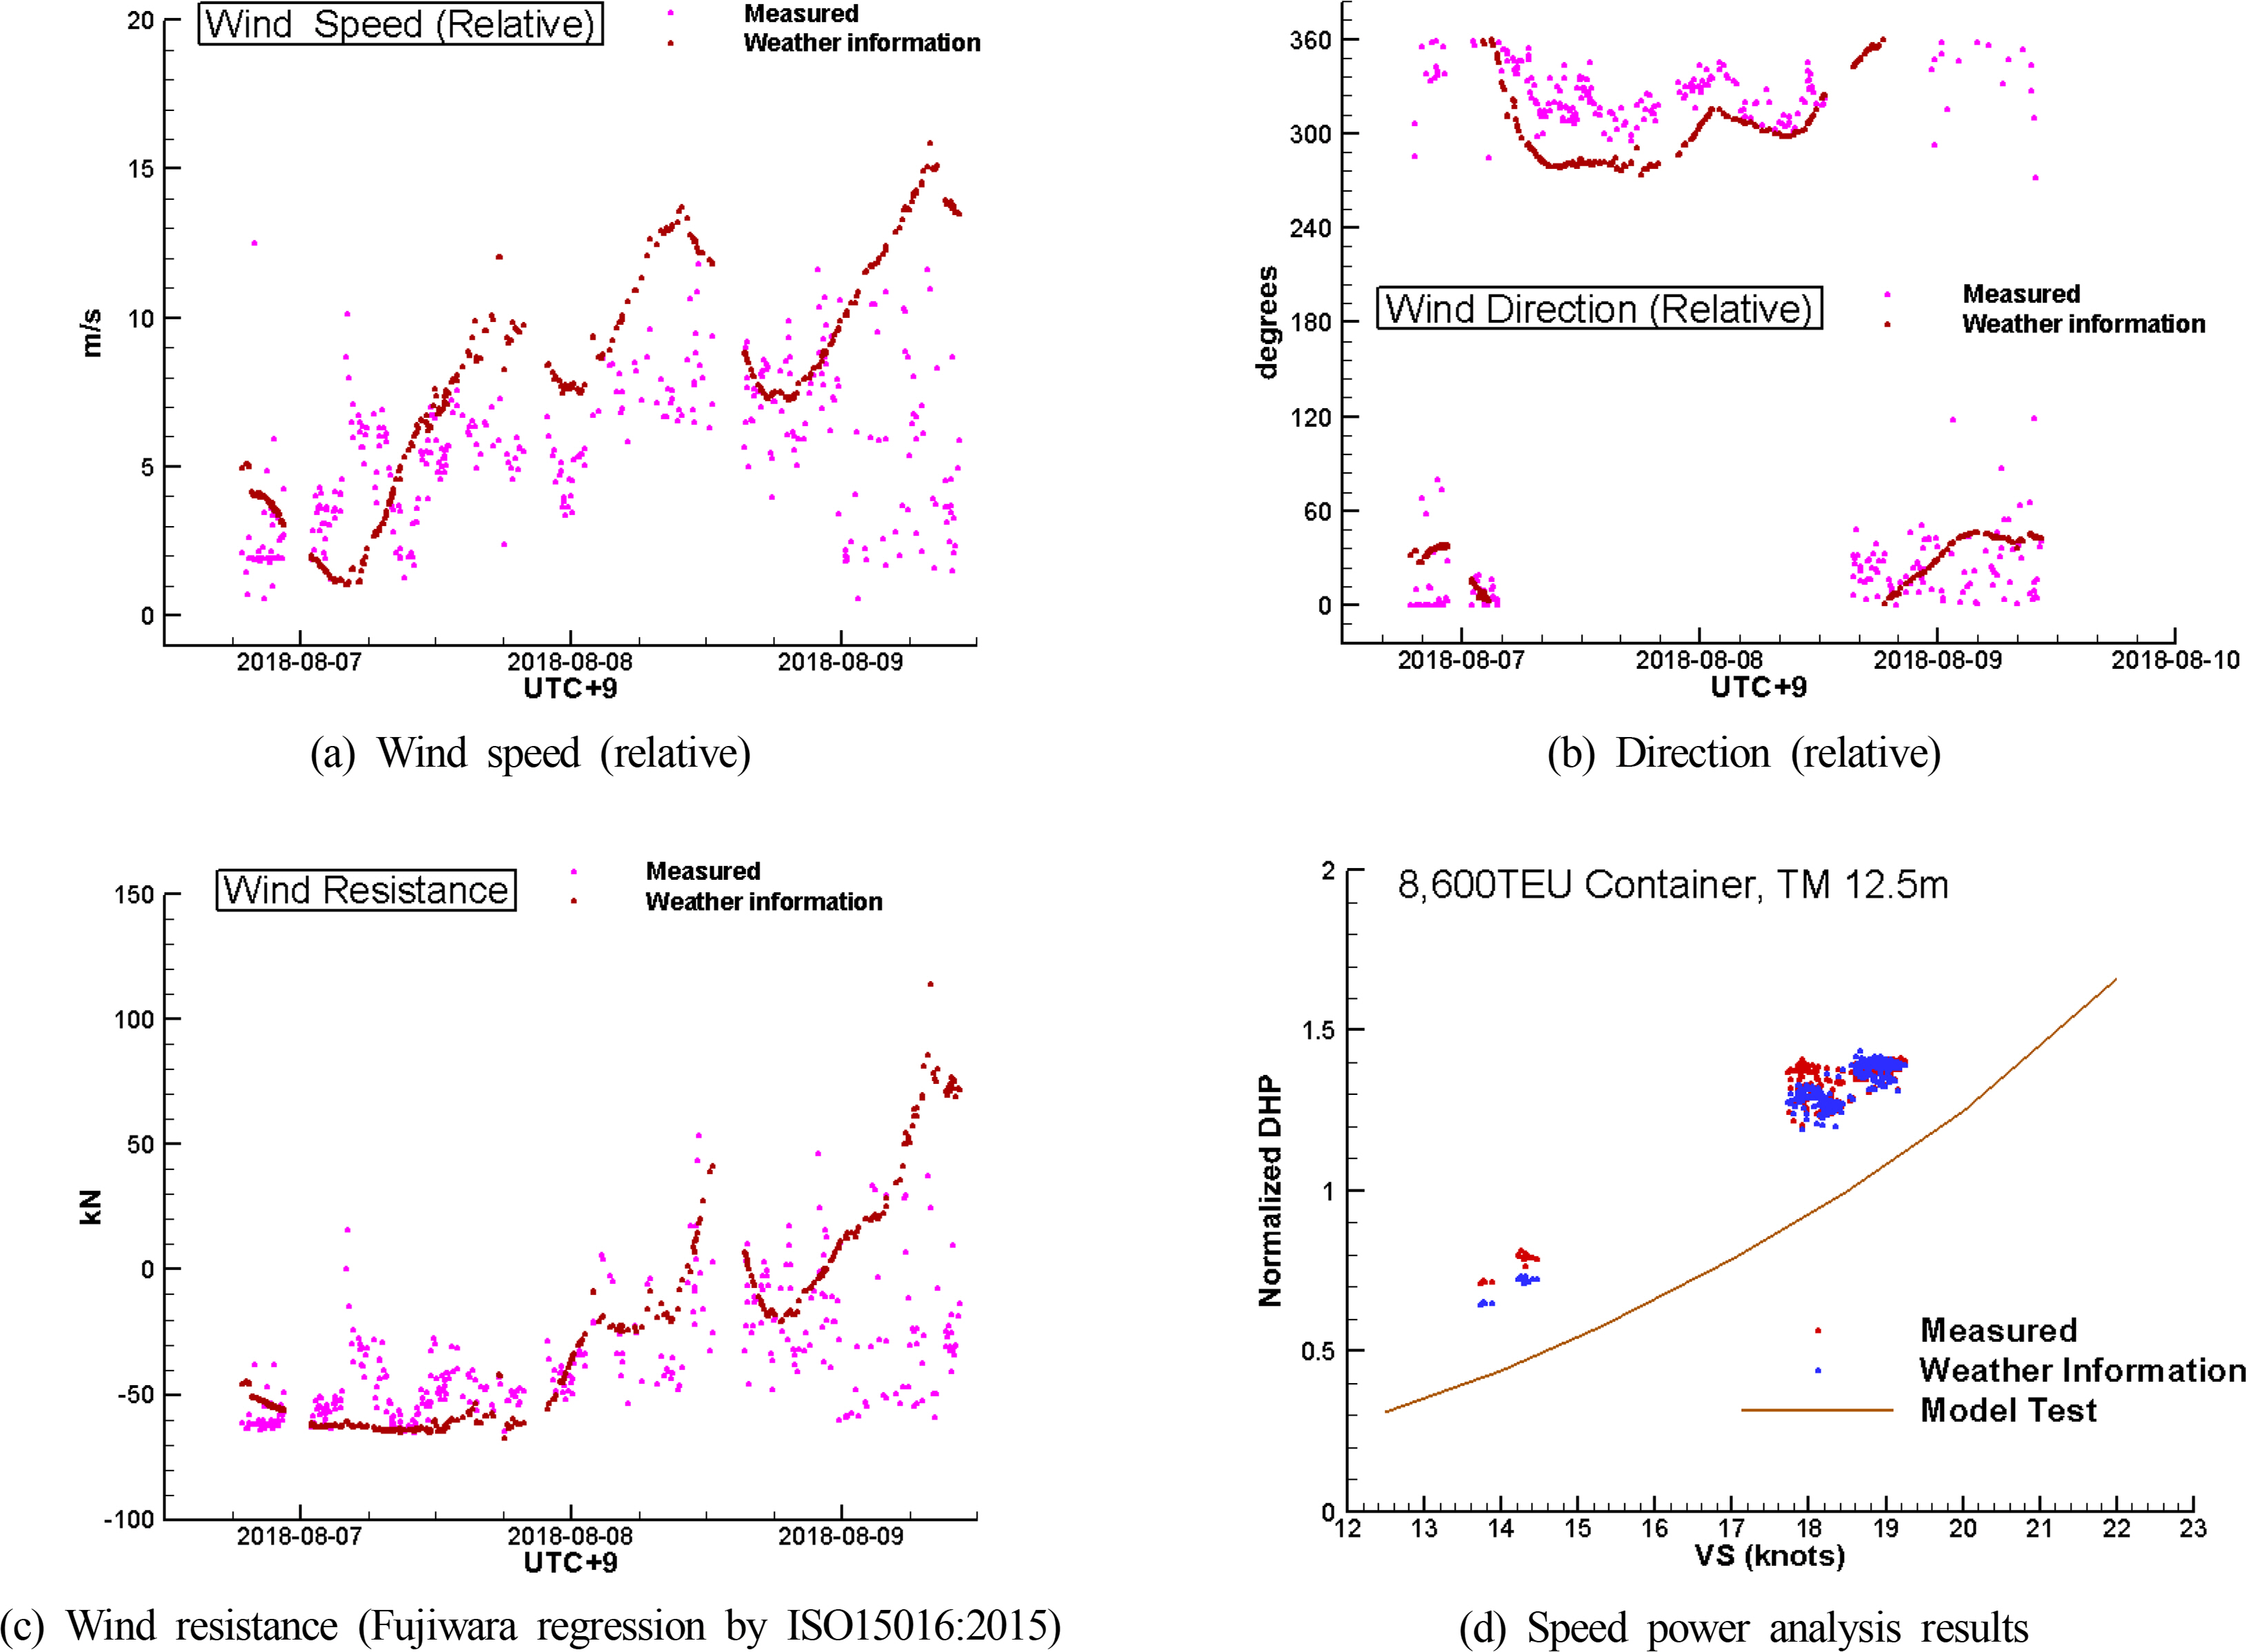
Comparisons of wind speed, direction at reference height, resistance, and analysis results between onboard measured and weather information data (TM 12.5 m, Singapore → China)
Fig. 5 shows comparisons of the wind data and analysis results between onboard measured and weather information data. Ship operating route was from Malaysia to India in September 2018. Standard operating condition TM 13.6 m in Table 1 was applied. Figs. 5(a) and 5(b) show that the measured wind speed was generally lower compared with the weather information, except for some sections, as shown in Figs. 4(a) and 4(b); additionally, the relative wind direction results agreed well. As shown in Fig. 5(c), the wind resistance was generally low, similar to the wind speed. The speed-power analysis results in Fig. 5(d), however, exhibited no significant difference. The DHP was analyzed and normalized using the same methods as those used to obtain Fig. 4.
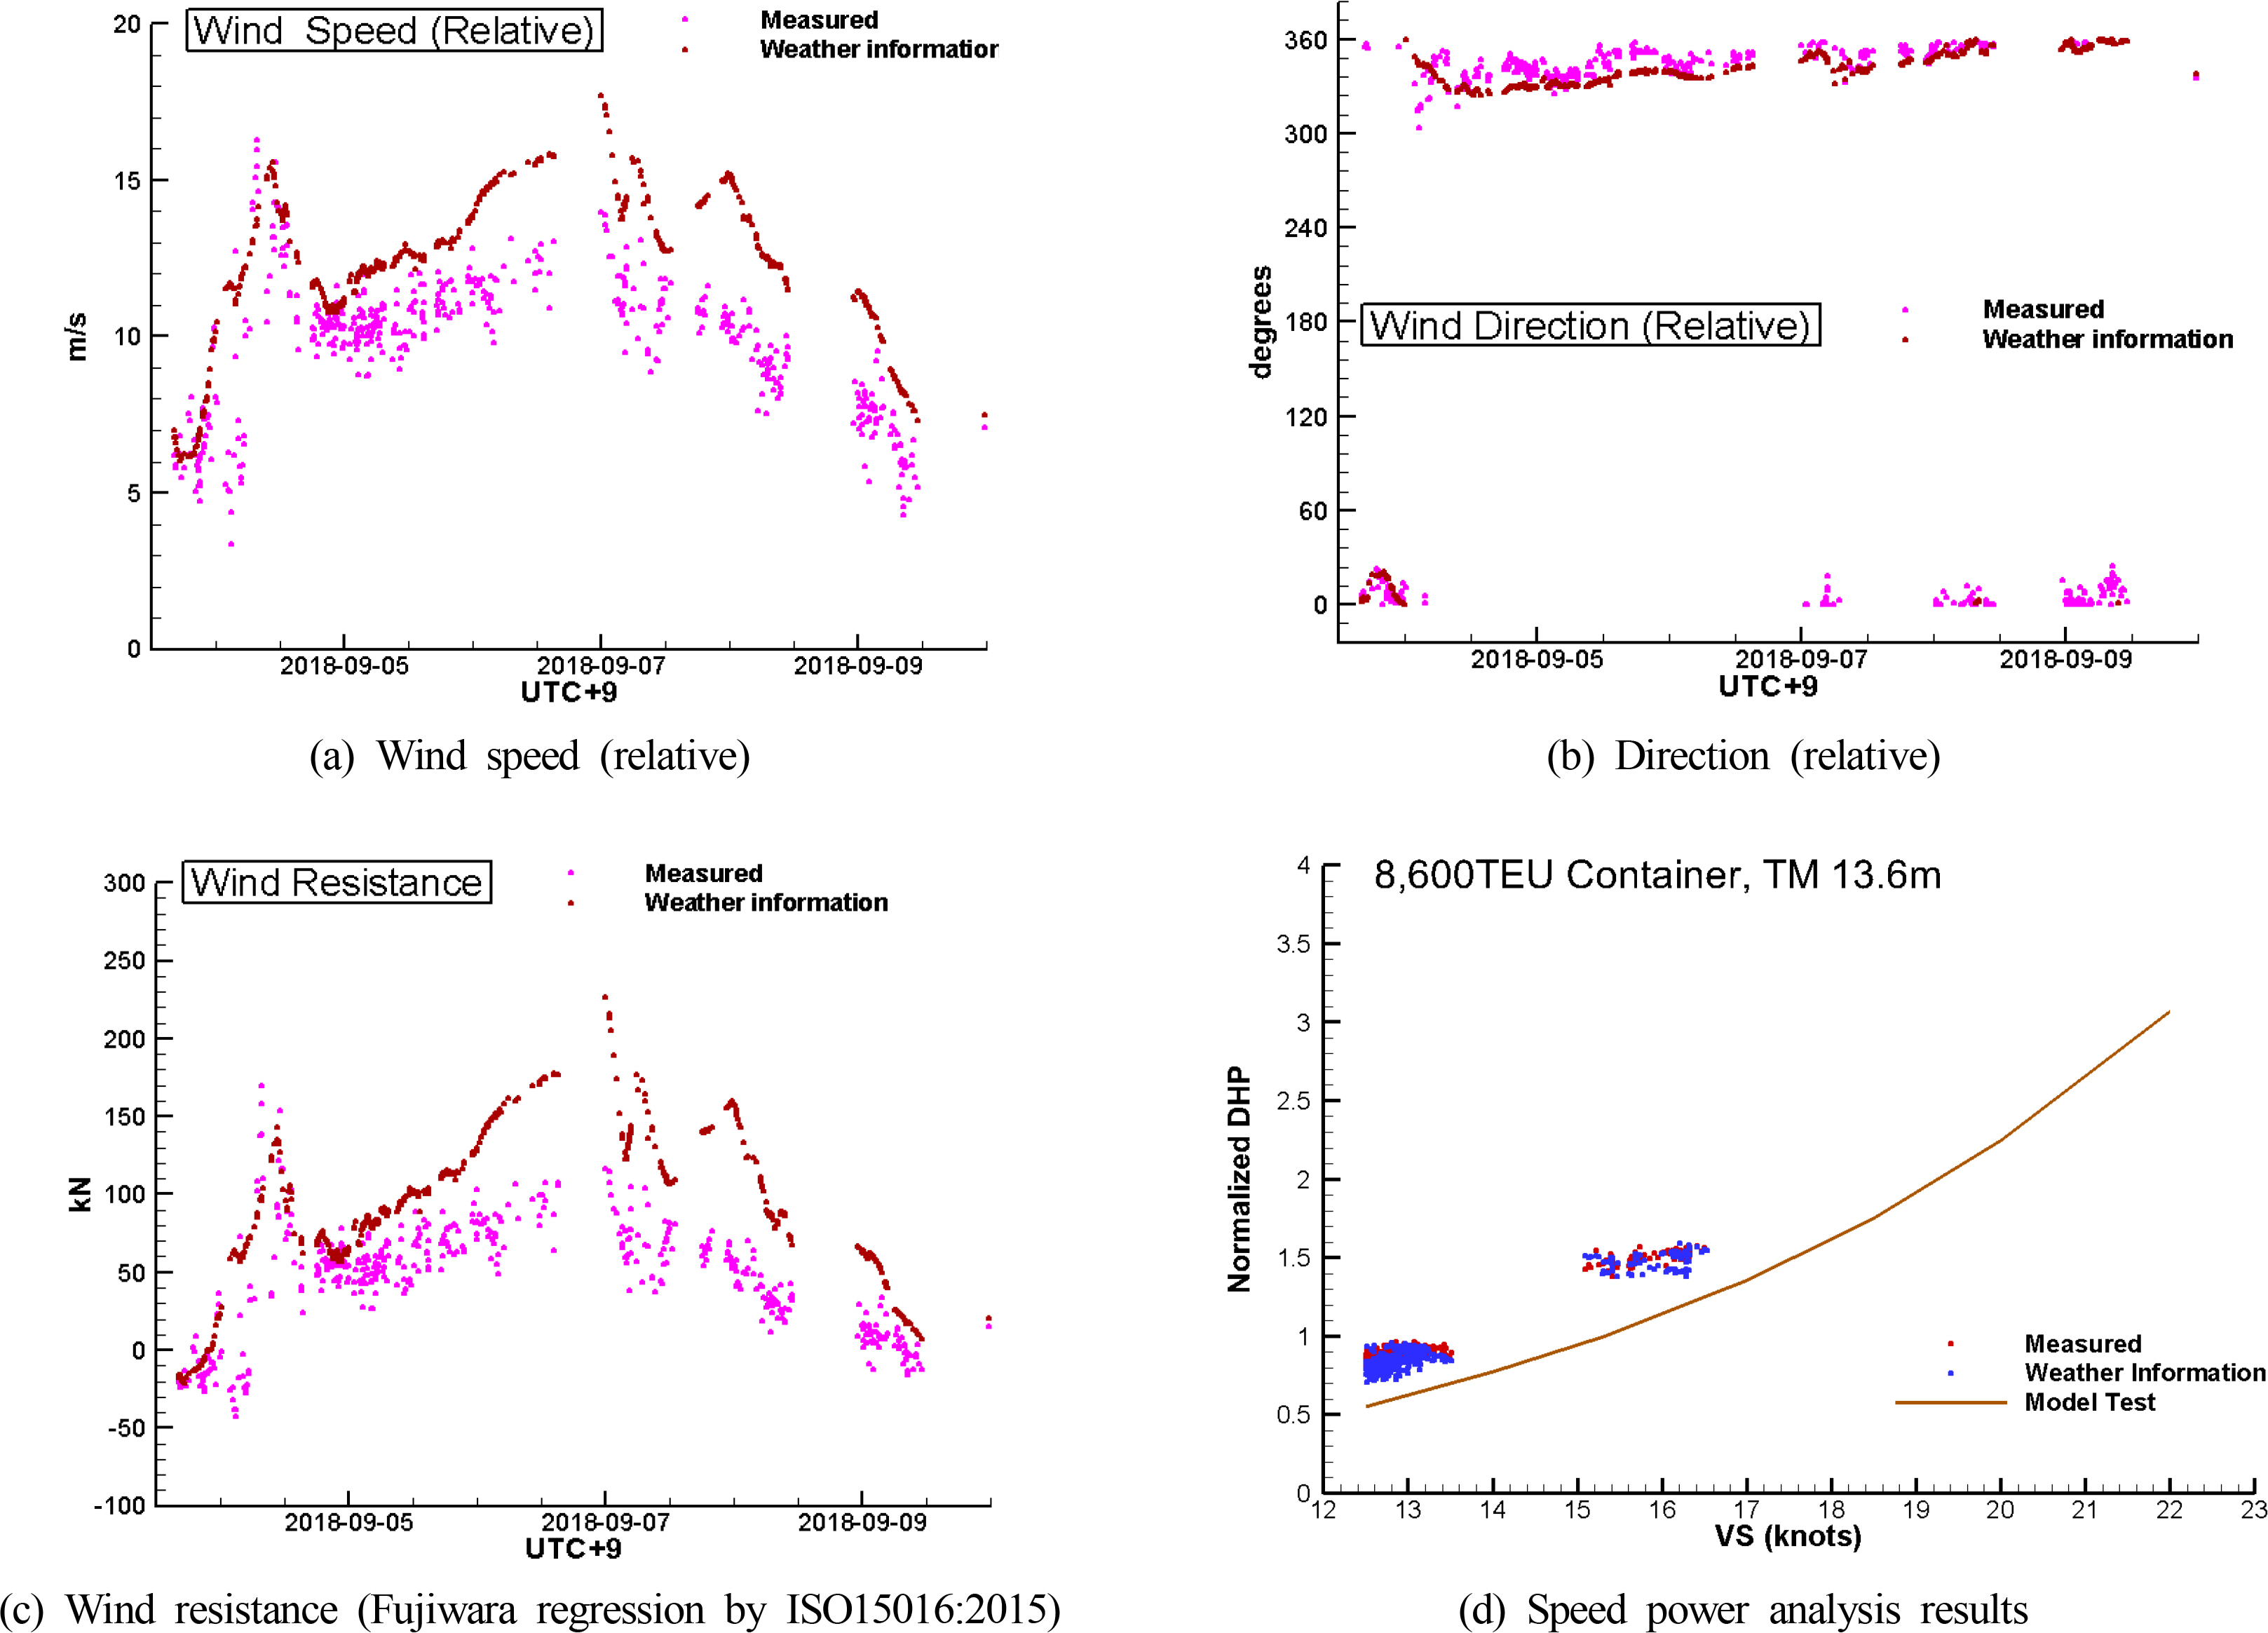
Comparisons of wind speed, direction at reference height, resistance, and analysis results between onboard measured and weather information data (TM 13.6 m, Malaysia → India)
In this section, the onboard measurements and the values of the NOAA weather information that were used as input data as well as the wind resistance and speed-power analysis results of the existing ship are compared. The wind direction results indicated good agreement. As for the wind speed, the onboard measurements tended to be lower compared with the weather information. The wind resistance showed the same tendency, and the wind resistance from the measured data was lower. However, the speed-power analysis results exhibited no significant difference. Both the added resistance due to wind by the onboard anemometer measurements and that by the wind speed and direction values extracted from the weather information provided reliable accuracy, indicating that any of the two methods can be used for the practical speed-power analysis of existing ships.
4.2 Comparison of Added Resistance Due to Waves Between Onboard Measurements by Wave Radar and Weather Information
In this section, the added resistance due to waves and speed-power analysis results obtained from the wave data measured using wave radar are compared with those obtained from weather information. The wave radar is a device that analyzes the significant wave height, wave direction, and wave period from the images obtained using the standard marine X-band radar, and it can be used for the speed trial of new ships (ISO 15016:2015). Table 3 shows the system specifications of the wave radar installed on the 8,600 TEU container ship of this study, and Fig. 6 shows its photograph. The error range for the significant wave height of 3 m or less was 0.5 m, and that for higher waves, wave direction and period was ±10%.
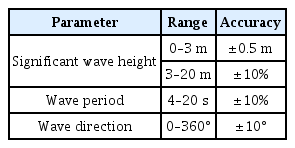
System specifications of wave radar (Shindong Digitech, 2020)
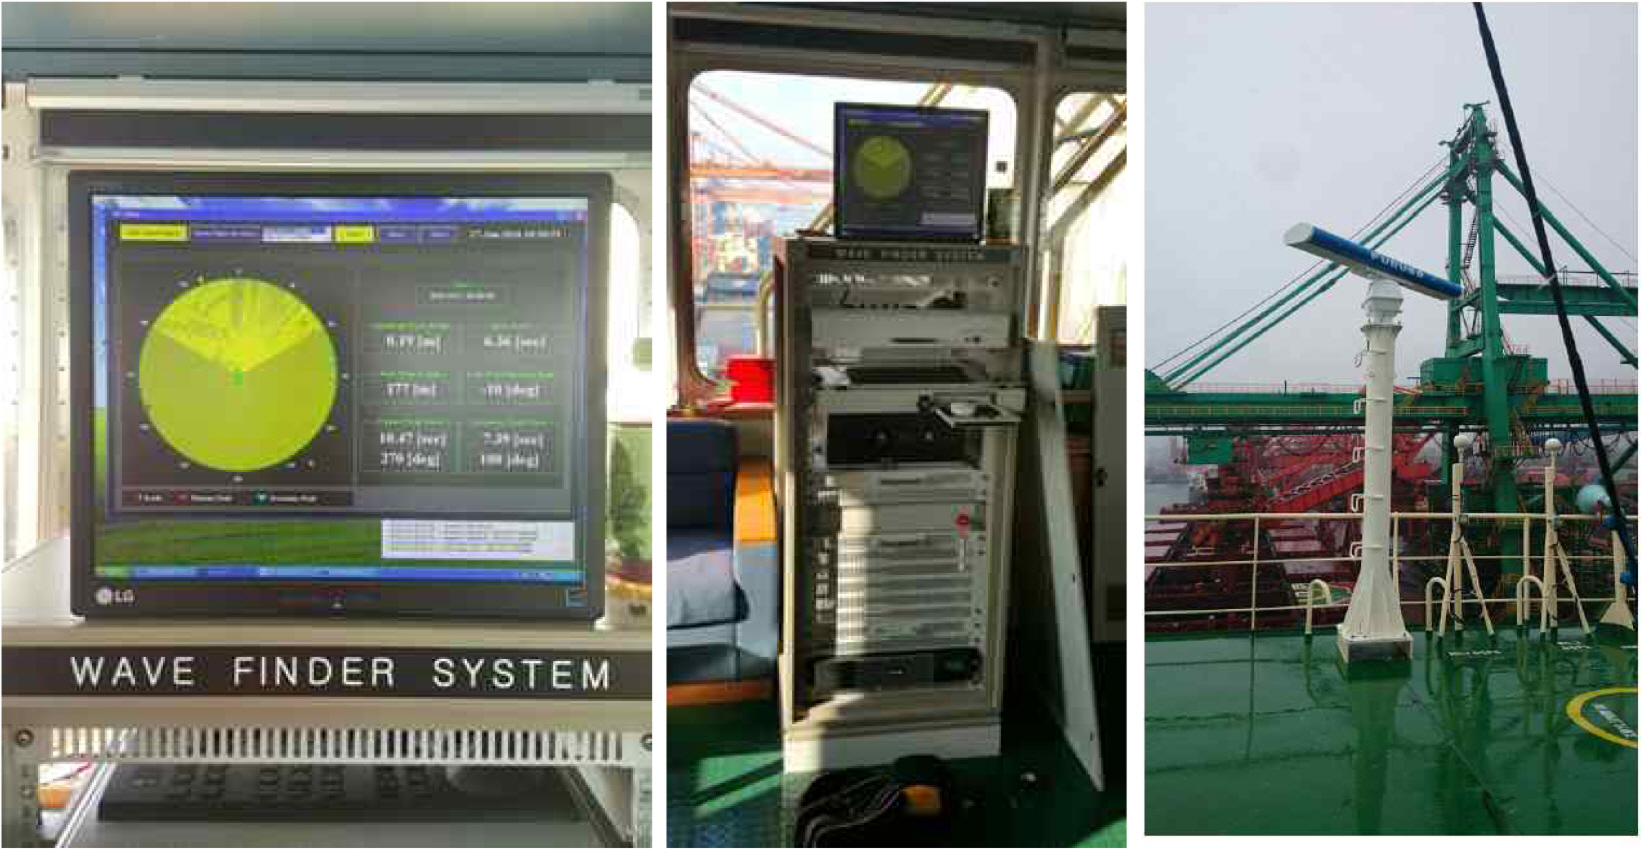
Photographs of wave radar on 8,600 TEU container ship
Fig. 7 shows a comparison of the wave radar measurements with the wave height, wave direction, and wave period extracted from weather information using the method presented in Section 3. The corresponding route was from Malaysia to Dubai in September 2016, and standard operating condition TM 13.6 m in Table 1 was applied. The x-axis is UTC+9 (Korean local time) and the y-axes are the wave height, wave direction, and wave period. For the analysis of added resistance due to waves, the relative wave direction is required. The wave direction measured by the wave radar is the relative direction, so the measured value can be applied directly to the analysis. As the wind direction extracted from the weather information is the true direction, it must be converted to the relative direction considering the heading of the ship. The relative wave direction is the clockwise angle from the head, and the head wave is 0°. As shown in Fig. 7(a), the wave heights measured by the wave radar and the sea wave height of weather information exhibited similar tendencies. In the route, the waves were not relatively high, and the wave height around September 23rd was approximately 2 m according to the weather information. Fig. 7(b) shows that the measured wave direction agreed well with the sea wave direction of the weather information. In addition, Fig. 7(c) shows that the measured wave period was consistent with the sea wave period of the weather information.
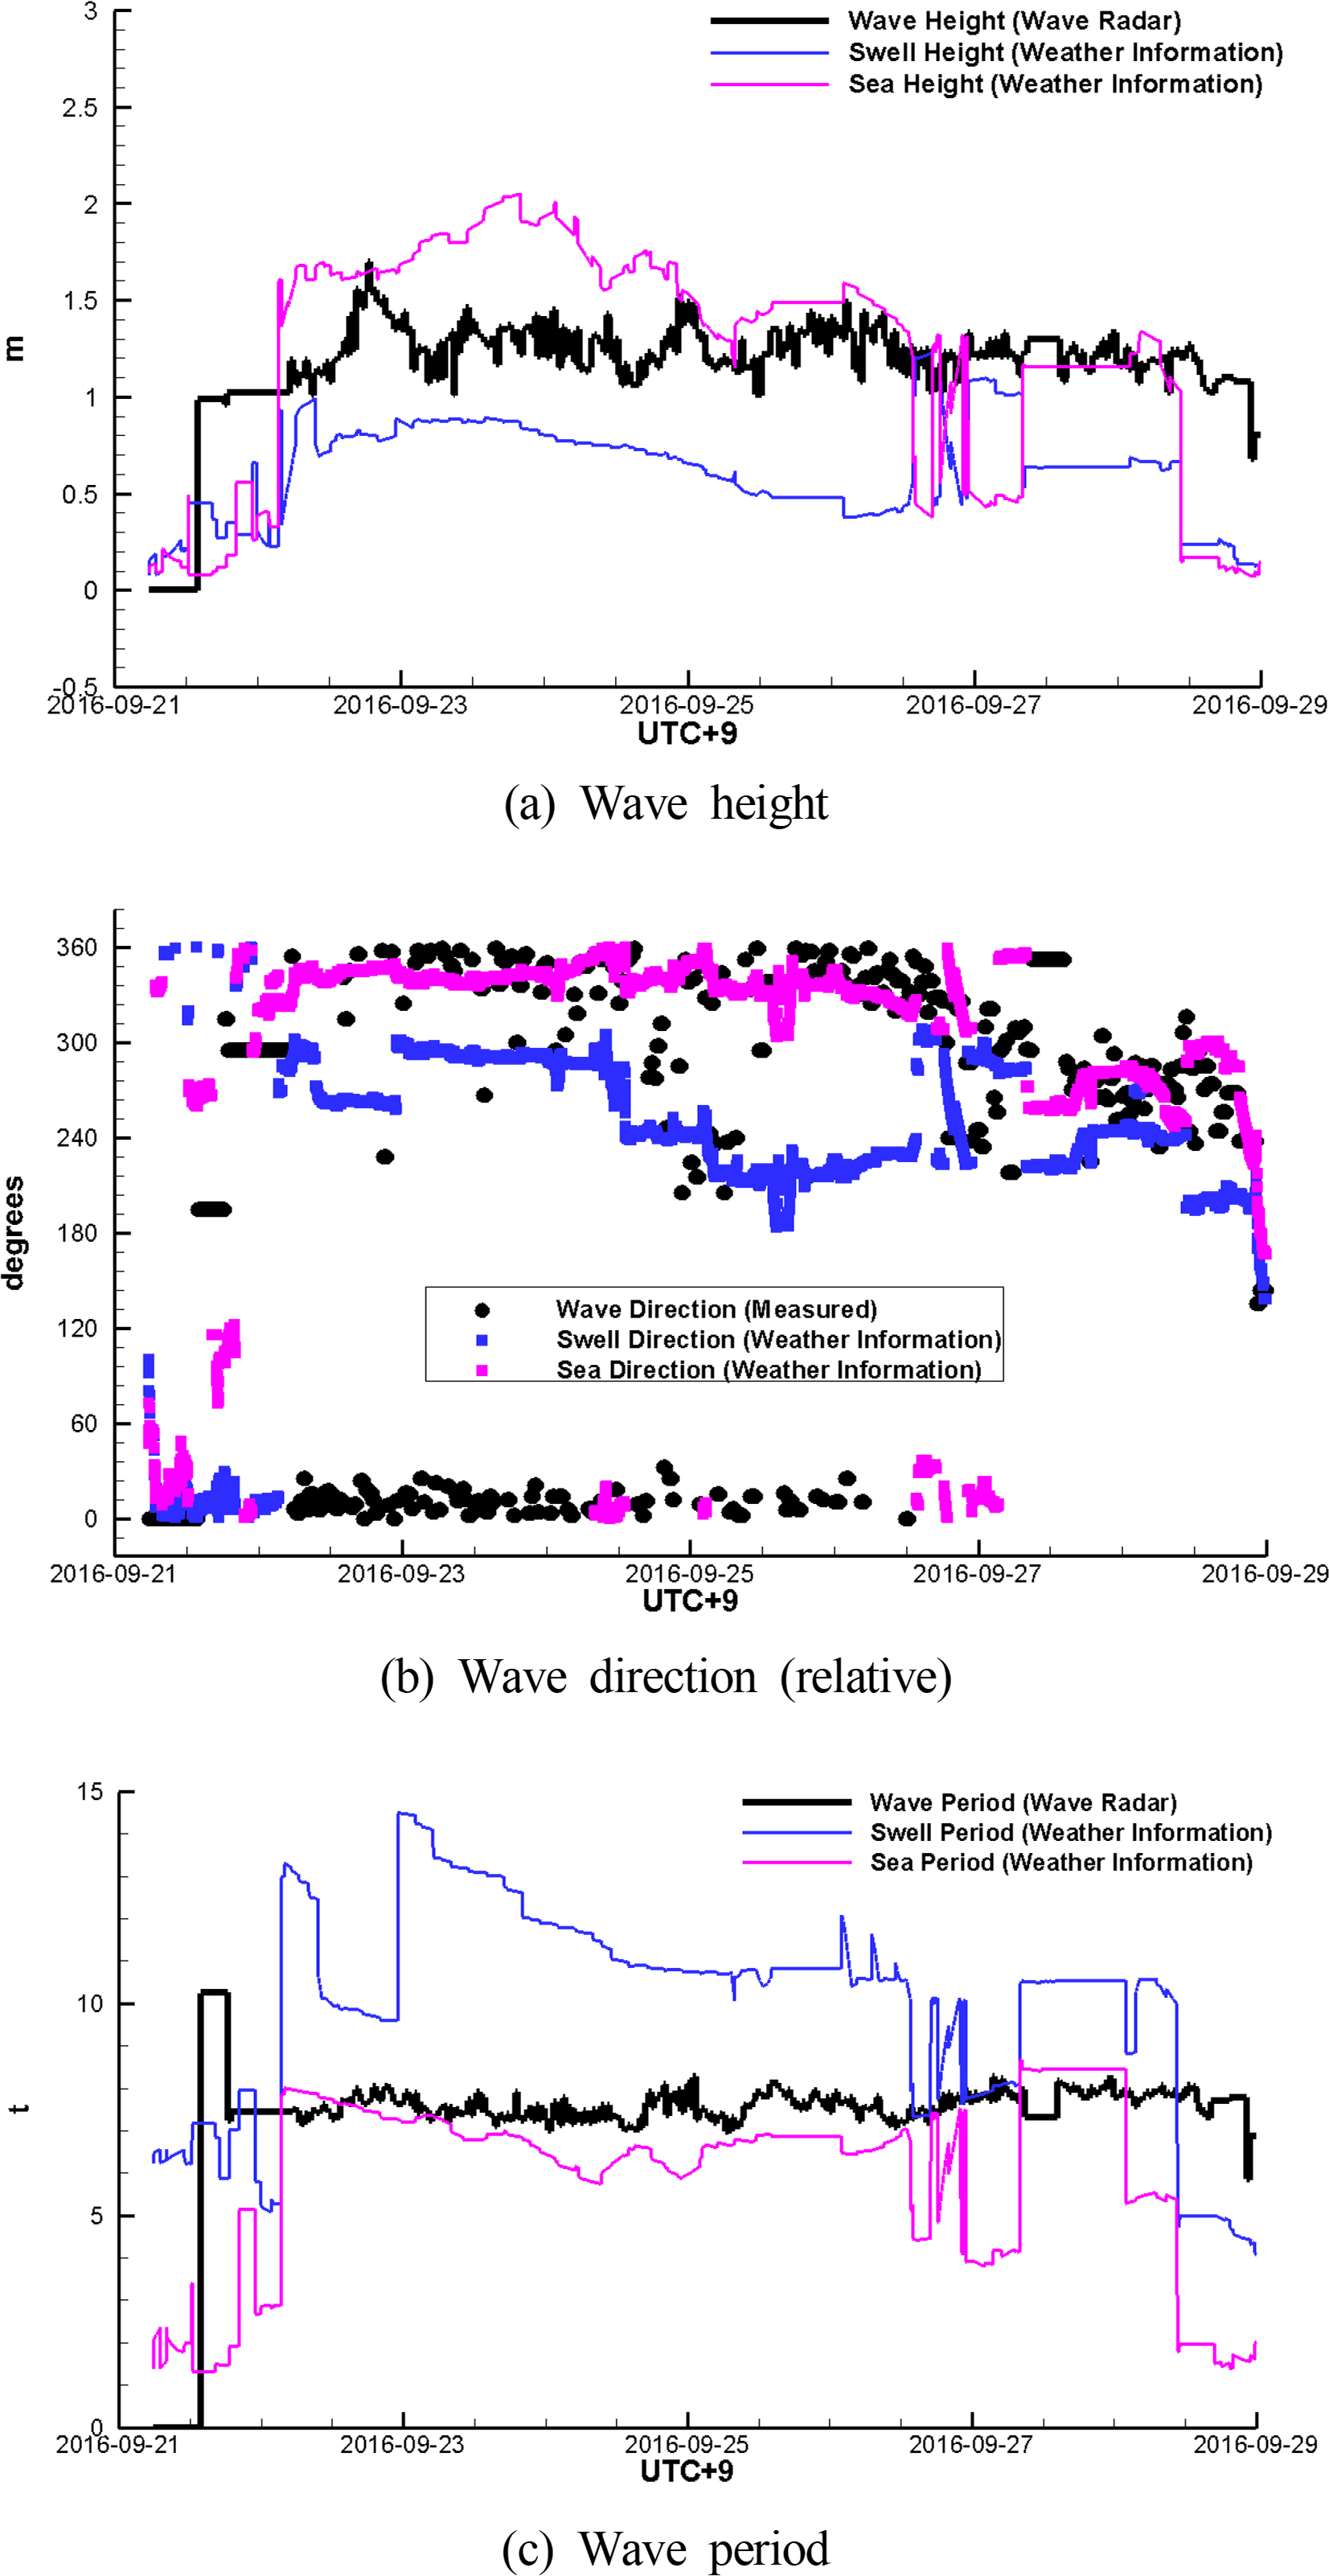
Comparisons of wave height, relative direction, and period between onboard data measured by wave radar and weather information
Fig. 8 shows the added resistance due to waves calculated using the STAWAVE-2 method. The x-axis is UTC+9 and the y-axis is the resistance value (kN). This STAWAVE-2 is the most frequently used method to calculate added resistance due to waves during the speed trial of new ships. It is an empirical formula to estimate the added resistance due to bow waves, and the added resistance due to the waves out of the ±45° range from the bow is treated as zero.
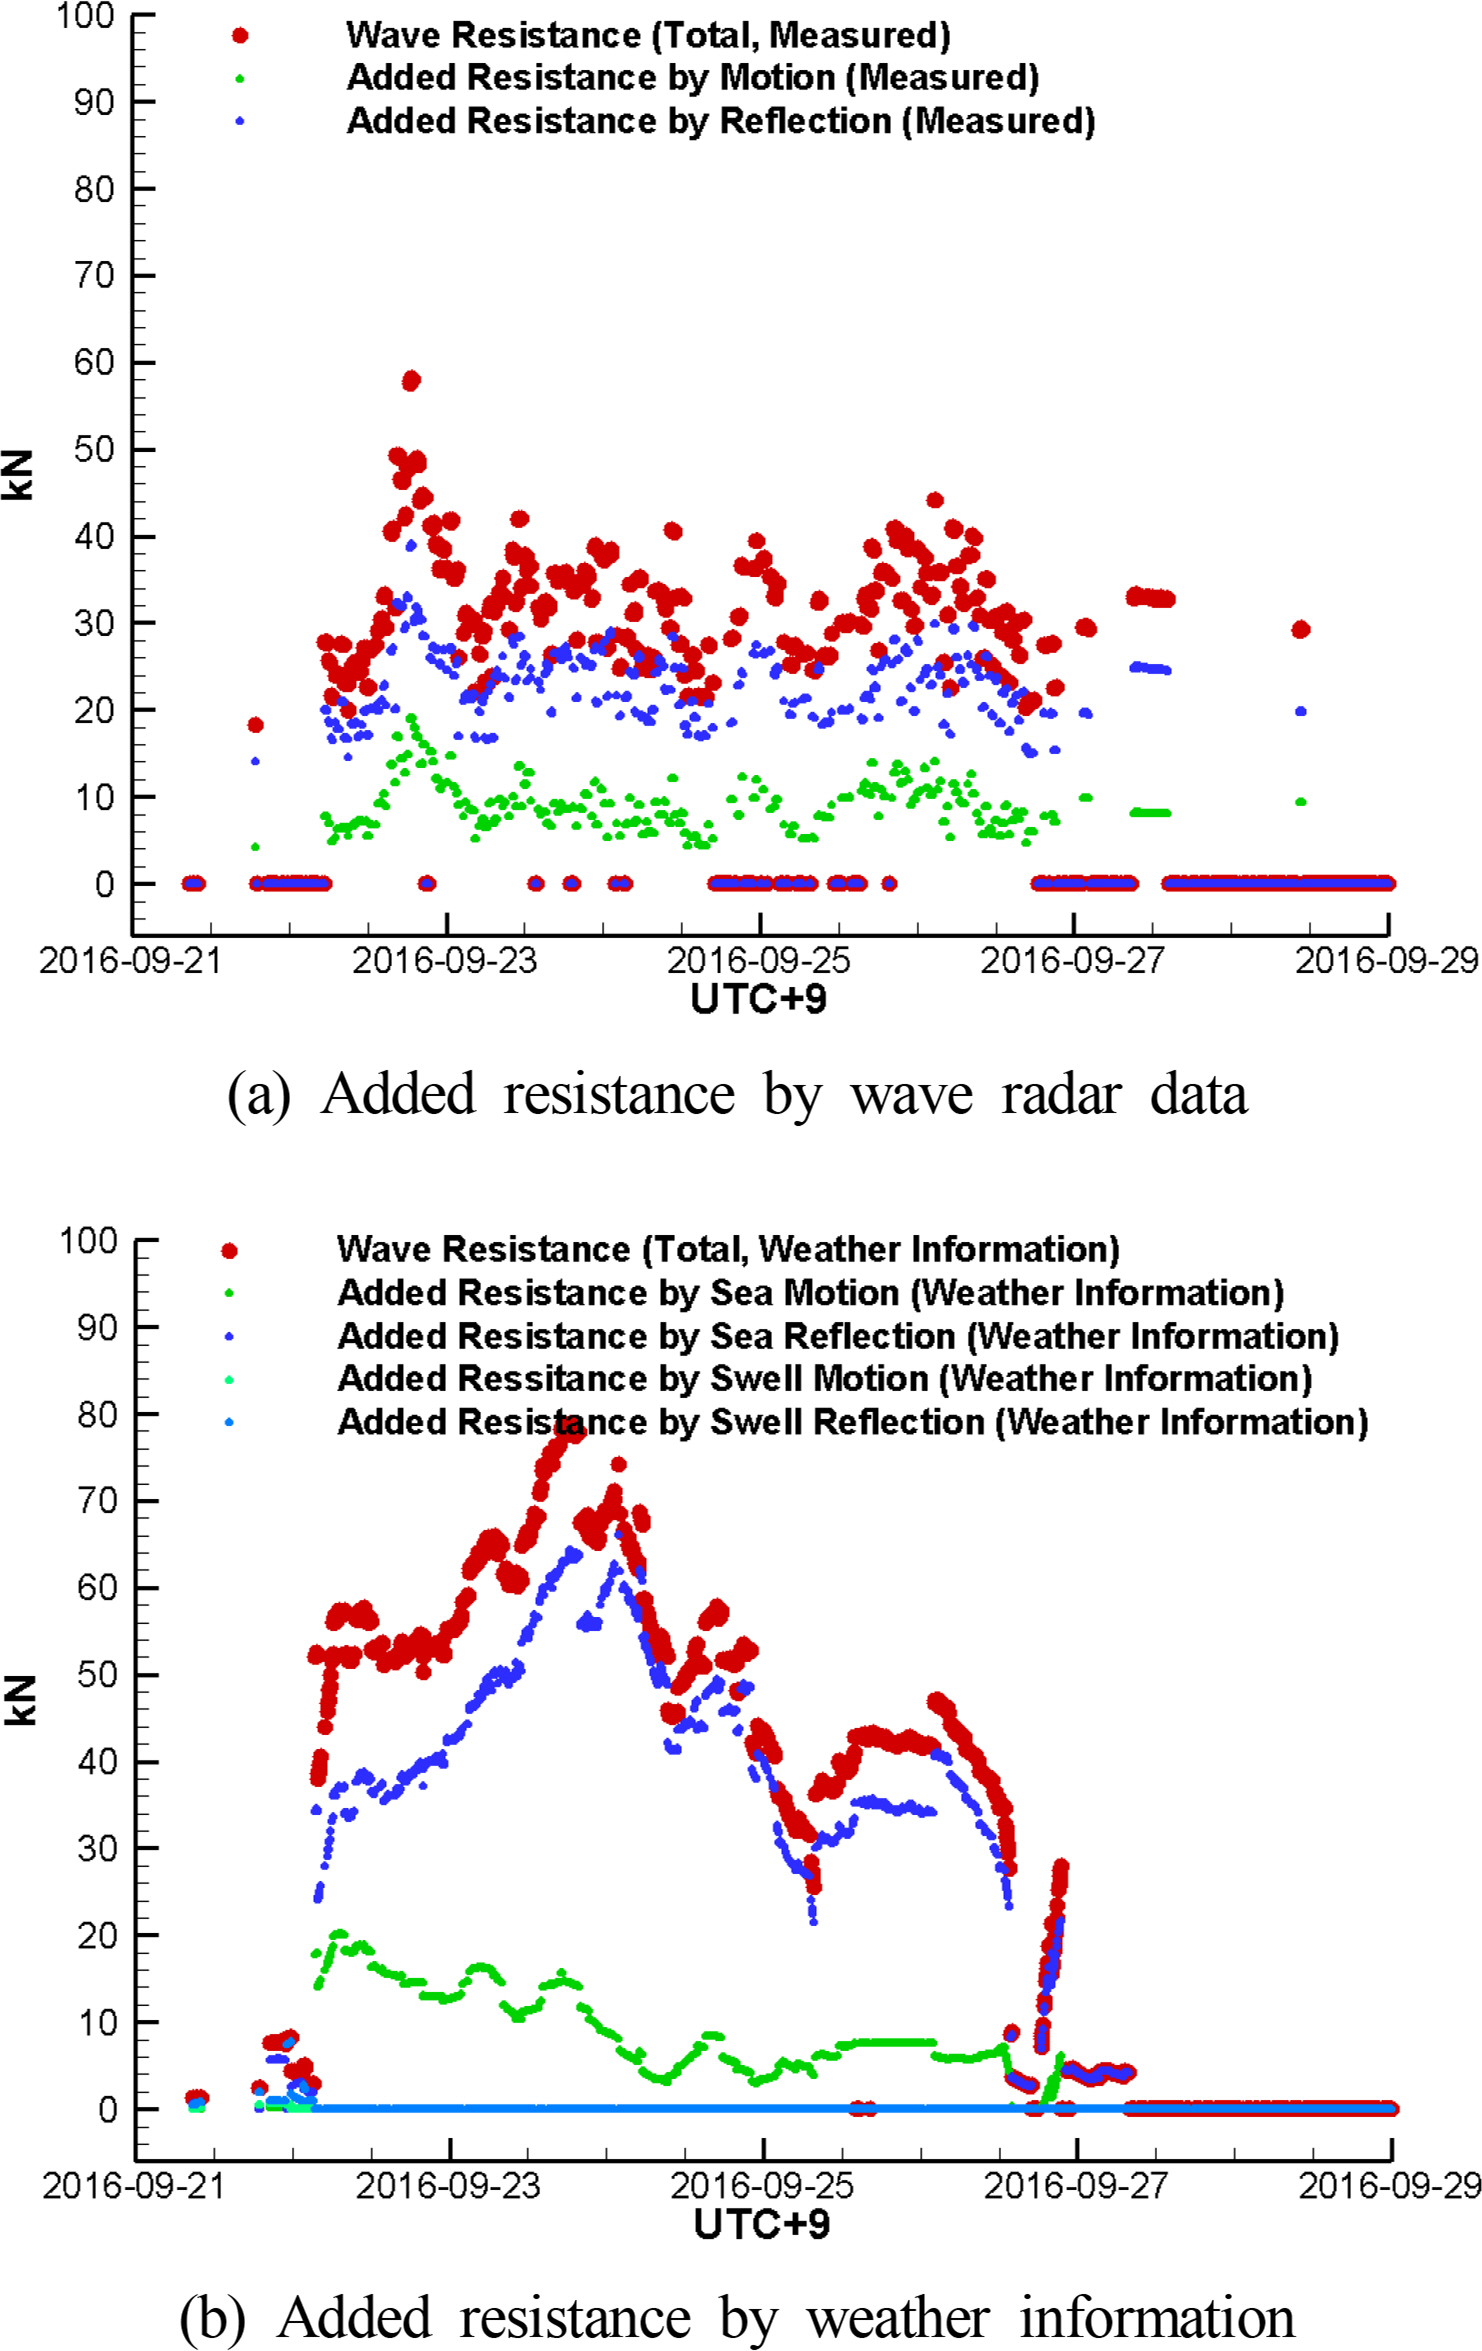
Comparisons of added resistance due to waves between data measured by wave radar and weather information (STAWAVE-2 by ISO15016:2015)
The added resistance due to waves is the sum of the motion-induced resistance and the resistance increase due to wave reflection. Fig. 8(a) shows the added resistance from the wave radar measurements. A maximum value of 60 kN was observed around September 23rd, and the resistance was primarily caused by reflection. Fig. 7(b) shows that the added resistance was zero after September 27th because the wave direction was in the 240°–300° range.
The waves of the weather information were divided into swell and sea, and the added resistance was the sum of both. In addition, the added resistance due to each of the swell and sea was the sum of its motion and reflection. Fig. 8(b) shows the calculated added resistance due to waves. The resistance was primarily caused by sea reflection, and the added resistance on September 24th was calculated to be approximately 80 kN, which was higher than the wave radar value. This is because the wave height of the weather information was relatively high. For the wave radar, the added resistance due to sea was zero after September 27th because the wave direction was in the 180°–300° range. In addition, the wave direction of the swell ranged from 180° to 300° during the entire voyage period, as shown in Fig. 7(b); hence, the added resistance due to swell was zero.
Fig. 9 shows the speed-power analysis results for the same operating data with Figs. 7 and 8. The y-axis represents the normalized DHP based on the tank test results of 18.5 kn (9.5 m/s), which is the reference speed of TM 12.5 m in Table 1. The wind was measured on board the ship, and the added resistance due to wind was analyzed using the Fujiwara regression formula of ISO15016:2015. The waves were analyzed using the STAWAVE-2 method of ISO15016:2015. The waves during operation were approximately 1.5 m, and the maximum difference in added resistance was approximately 20 kN; however, the speed-power analysis results in Fig. 9 exhibited no significant difference. The analysis results from the measurements of the wave radar, which was difficult to install and costly, did not differ significantly from those of the weather information.
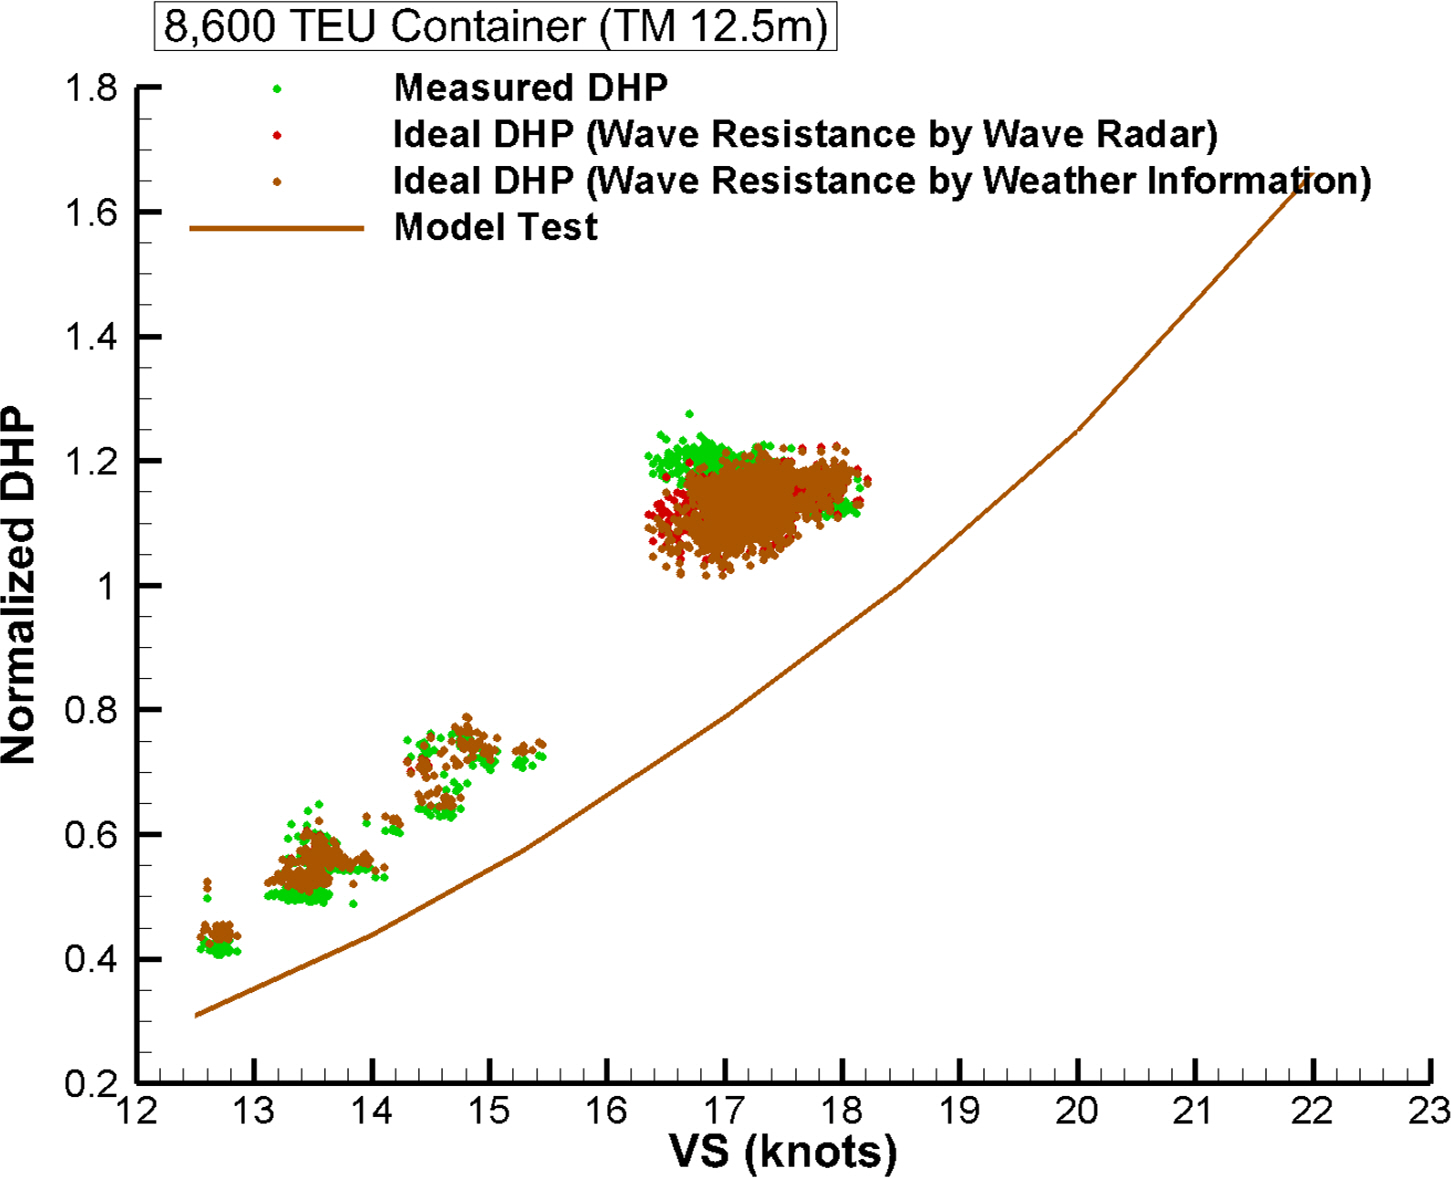
Comparison of speed-power analysis results between wave measured by wave radar and weather information (TM 12.5 m)
Analyzing the speed-power performance of an existing container ship using SPA software (Park et al., 2019), both the data measured using the wave radar and the data extracted from the weather information can be used as input data for added resistance due to waves. Hence, it can be concluded that both two data sets provide reliable results.
4.3 Verification of Effects of Hull and Propeller Cleaning and Painting
Ships are docked after a certain period of operation for ship inspection and maintenance. The target ship of this study was docked in November 2017. Subsequently, cleaning and maintenance were performed for the propeller, and sand blasting and painting for the hull. Fig. 10 shows the photographs before and after docking.
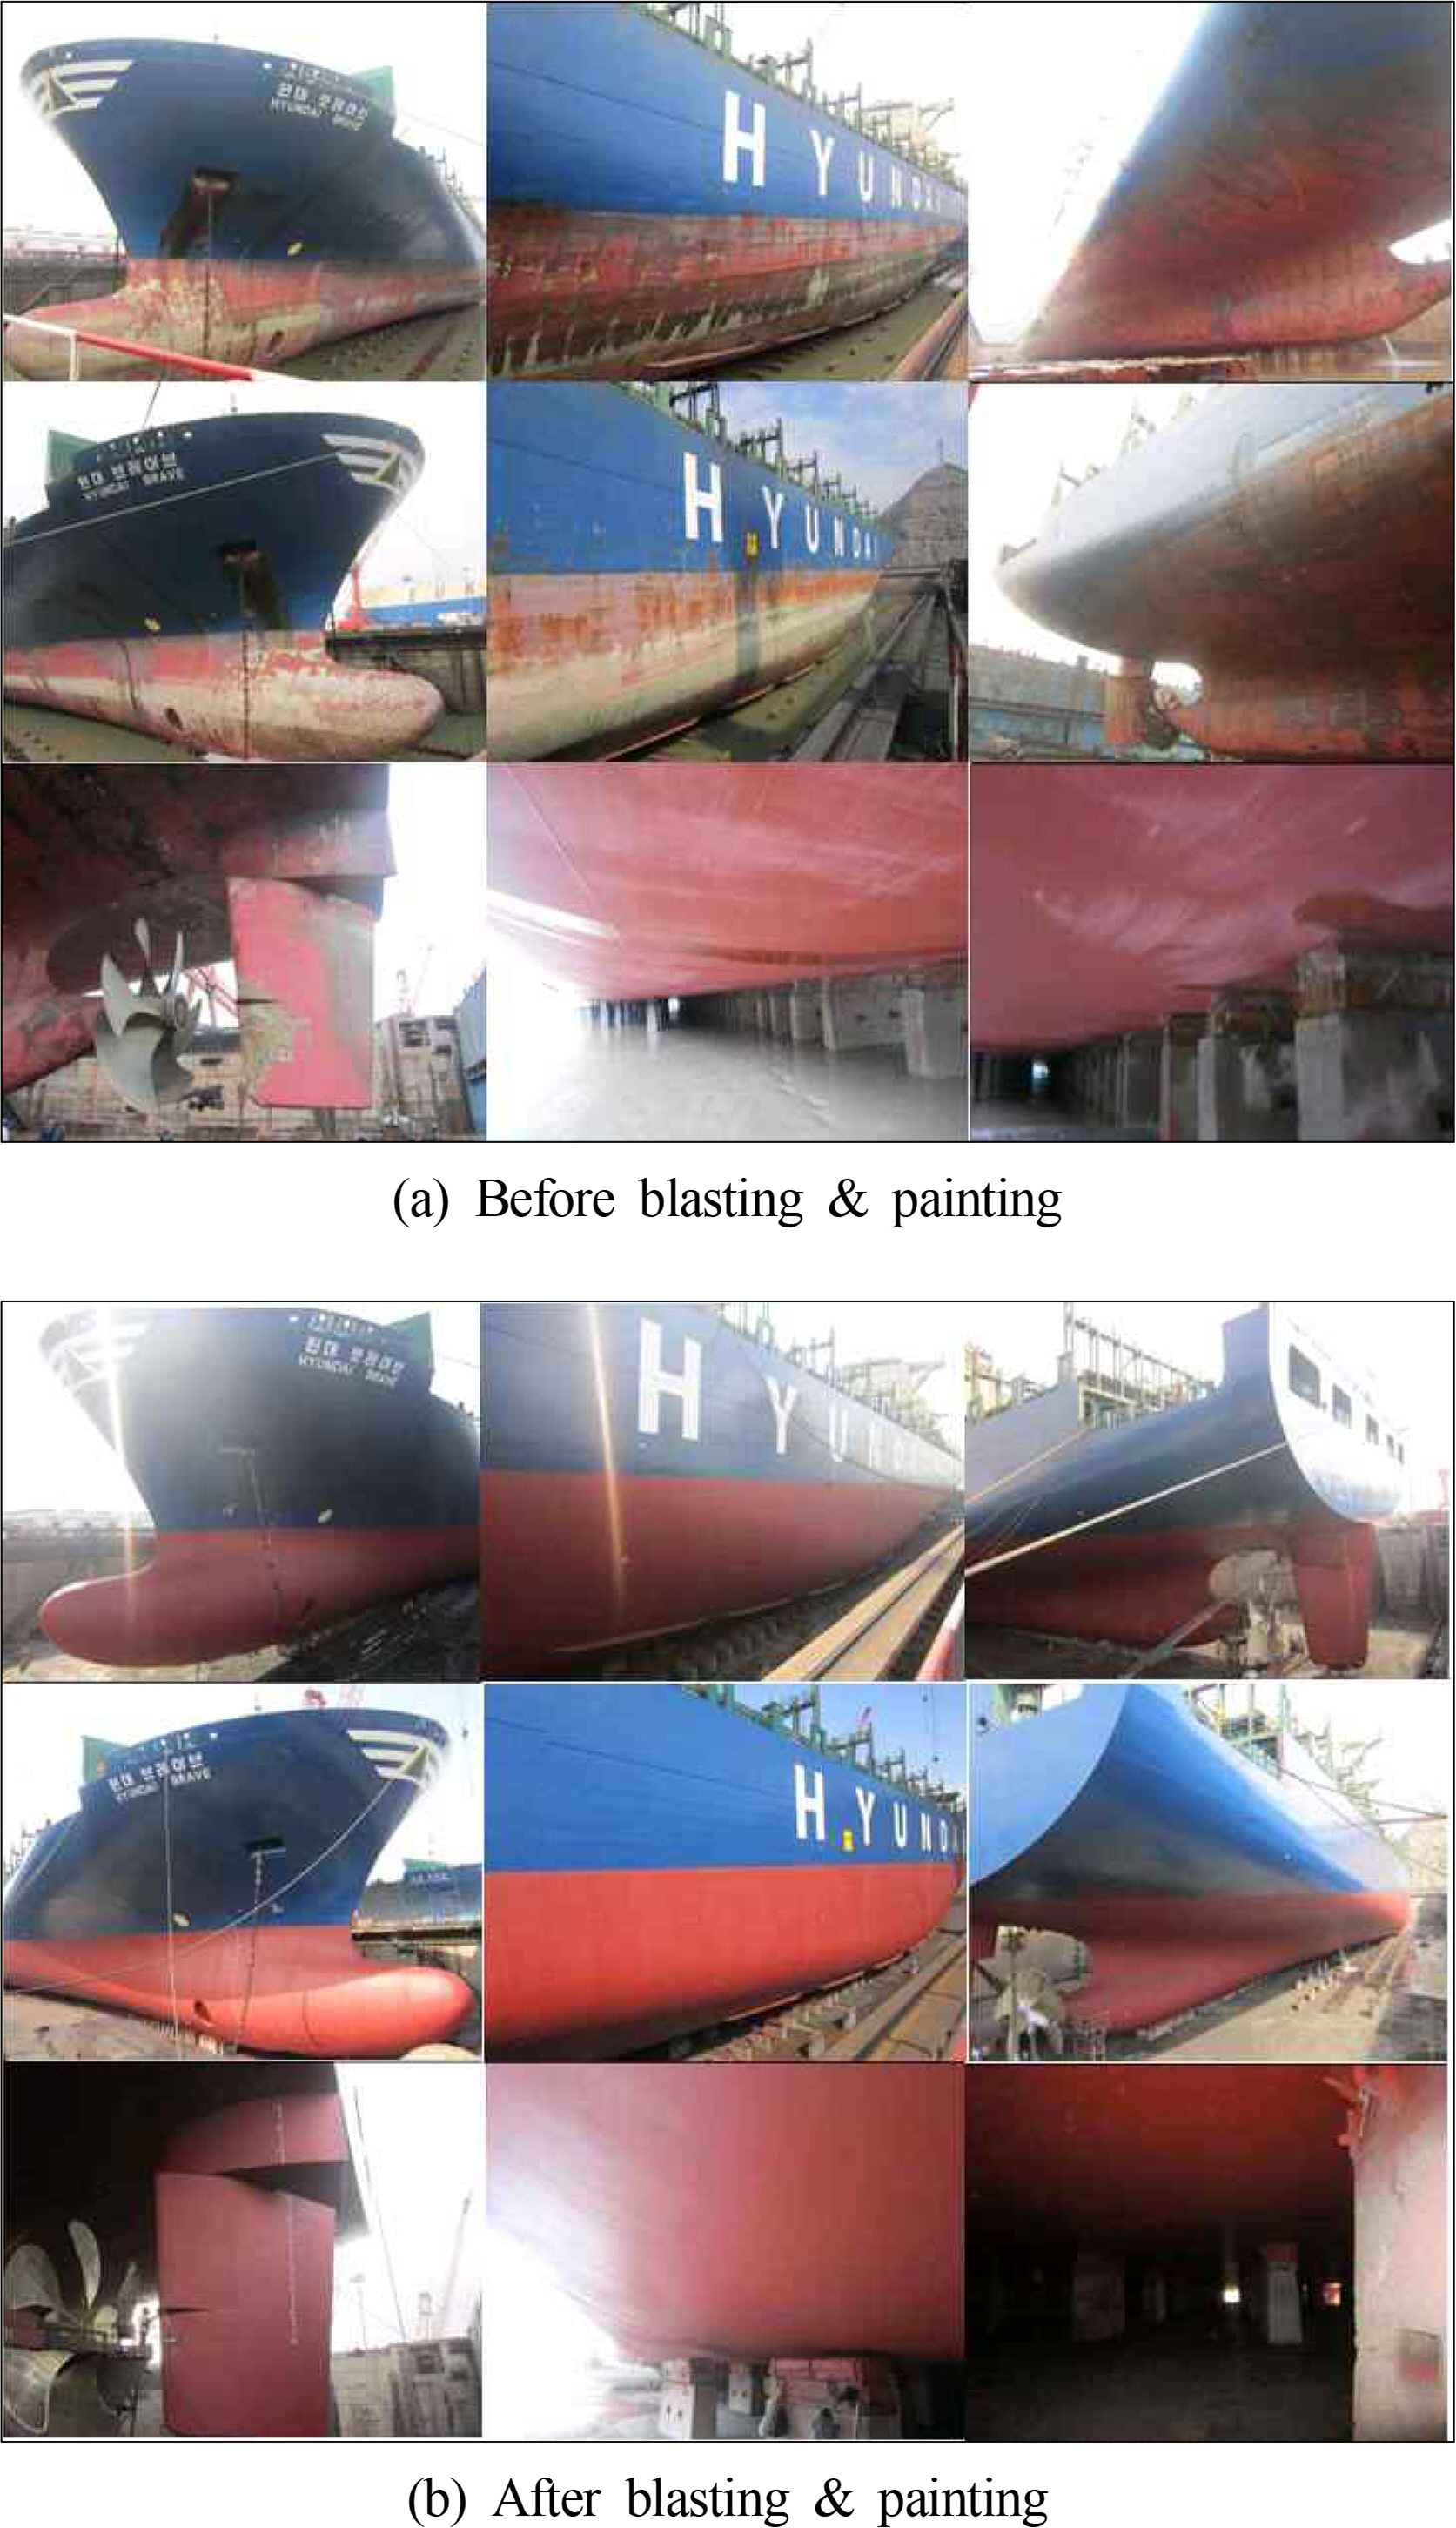
Photographs of 8,600 TEU container during docking (dated November 2017).
Fouling is known to be the main cause of increased resistance for aged ships. Based on the hull inspection results after docking, moderate slime and seagrass were attached to 11%–30% of the vertical bottom. Slight slime was attached to 1%–10% of the flat bottom and boot top, and local damage to the coating caused by mechanical damage was found. Painting was performed using silyl-type, self-polishing, antifouling, low-friction paint. Based on the inspection results upon the completion of painting, the hull roughness was 123 µm on average (maximum: 133 µm; minimum: 89 µm), which satisfied the paint supplier’s criterion of 150 µm or less.
Fig. 11 shows the speed-power results before and after docking for an analysis of the docking effect of the target ship. The legends in the figure indicate the port departure dates before and after docking, and the operating route included China, Taiwan, Hong Kong, Singapore, Malaysia, and the United Arab Emirates. The DHP was normalized as in Fig. 9. An analysis of before and after docking shows that the results of TM 12.5 m were similar. The TM 13.6 m analysis results improved by 10%–12% near 20–22 kn (10.3–11.3 m/s) and by approximately 5% at the reference speed of 15.3 kn (7.87 m/s). The friction resistance reduction effect by hull blasting and painting was evident in the high-speed range for TM 13.6 m owing to its deep draft.
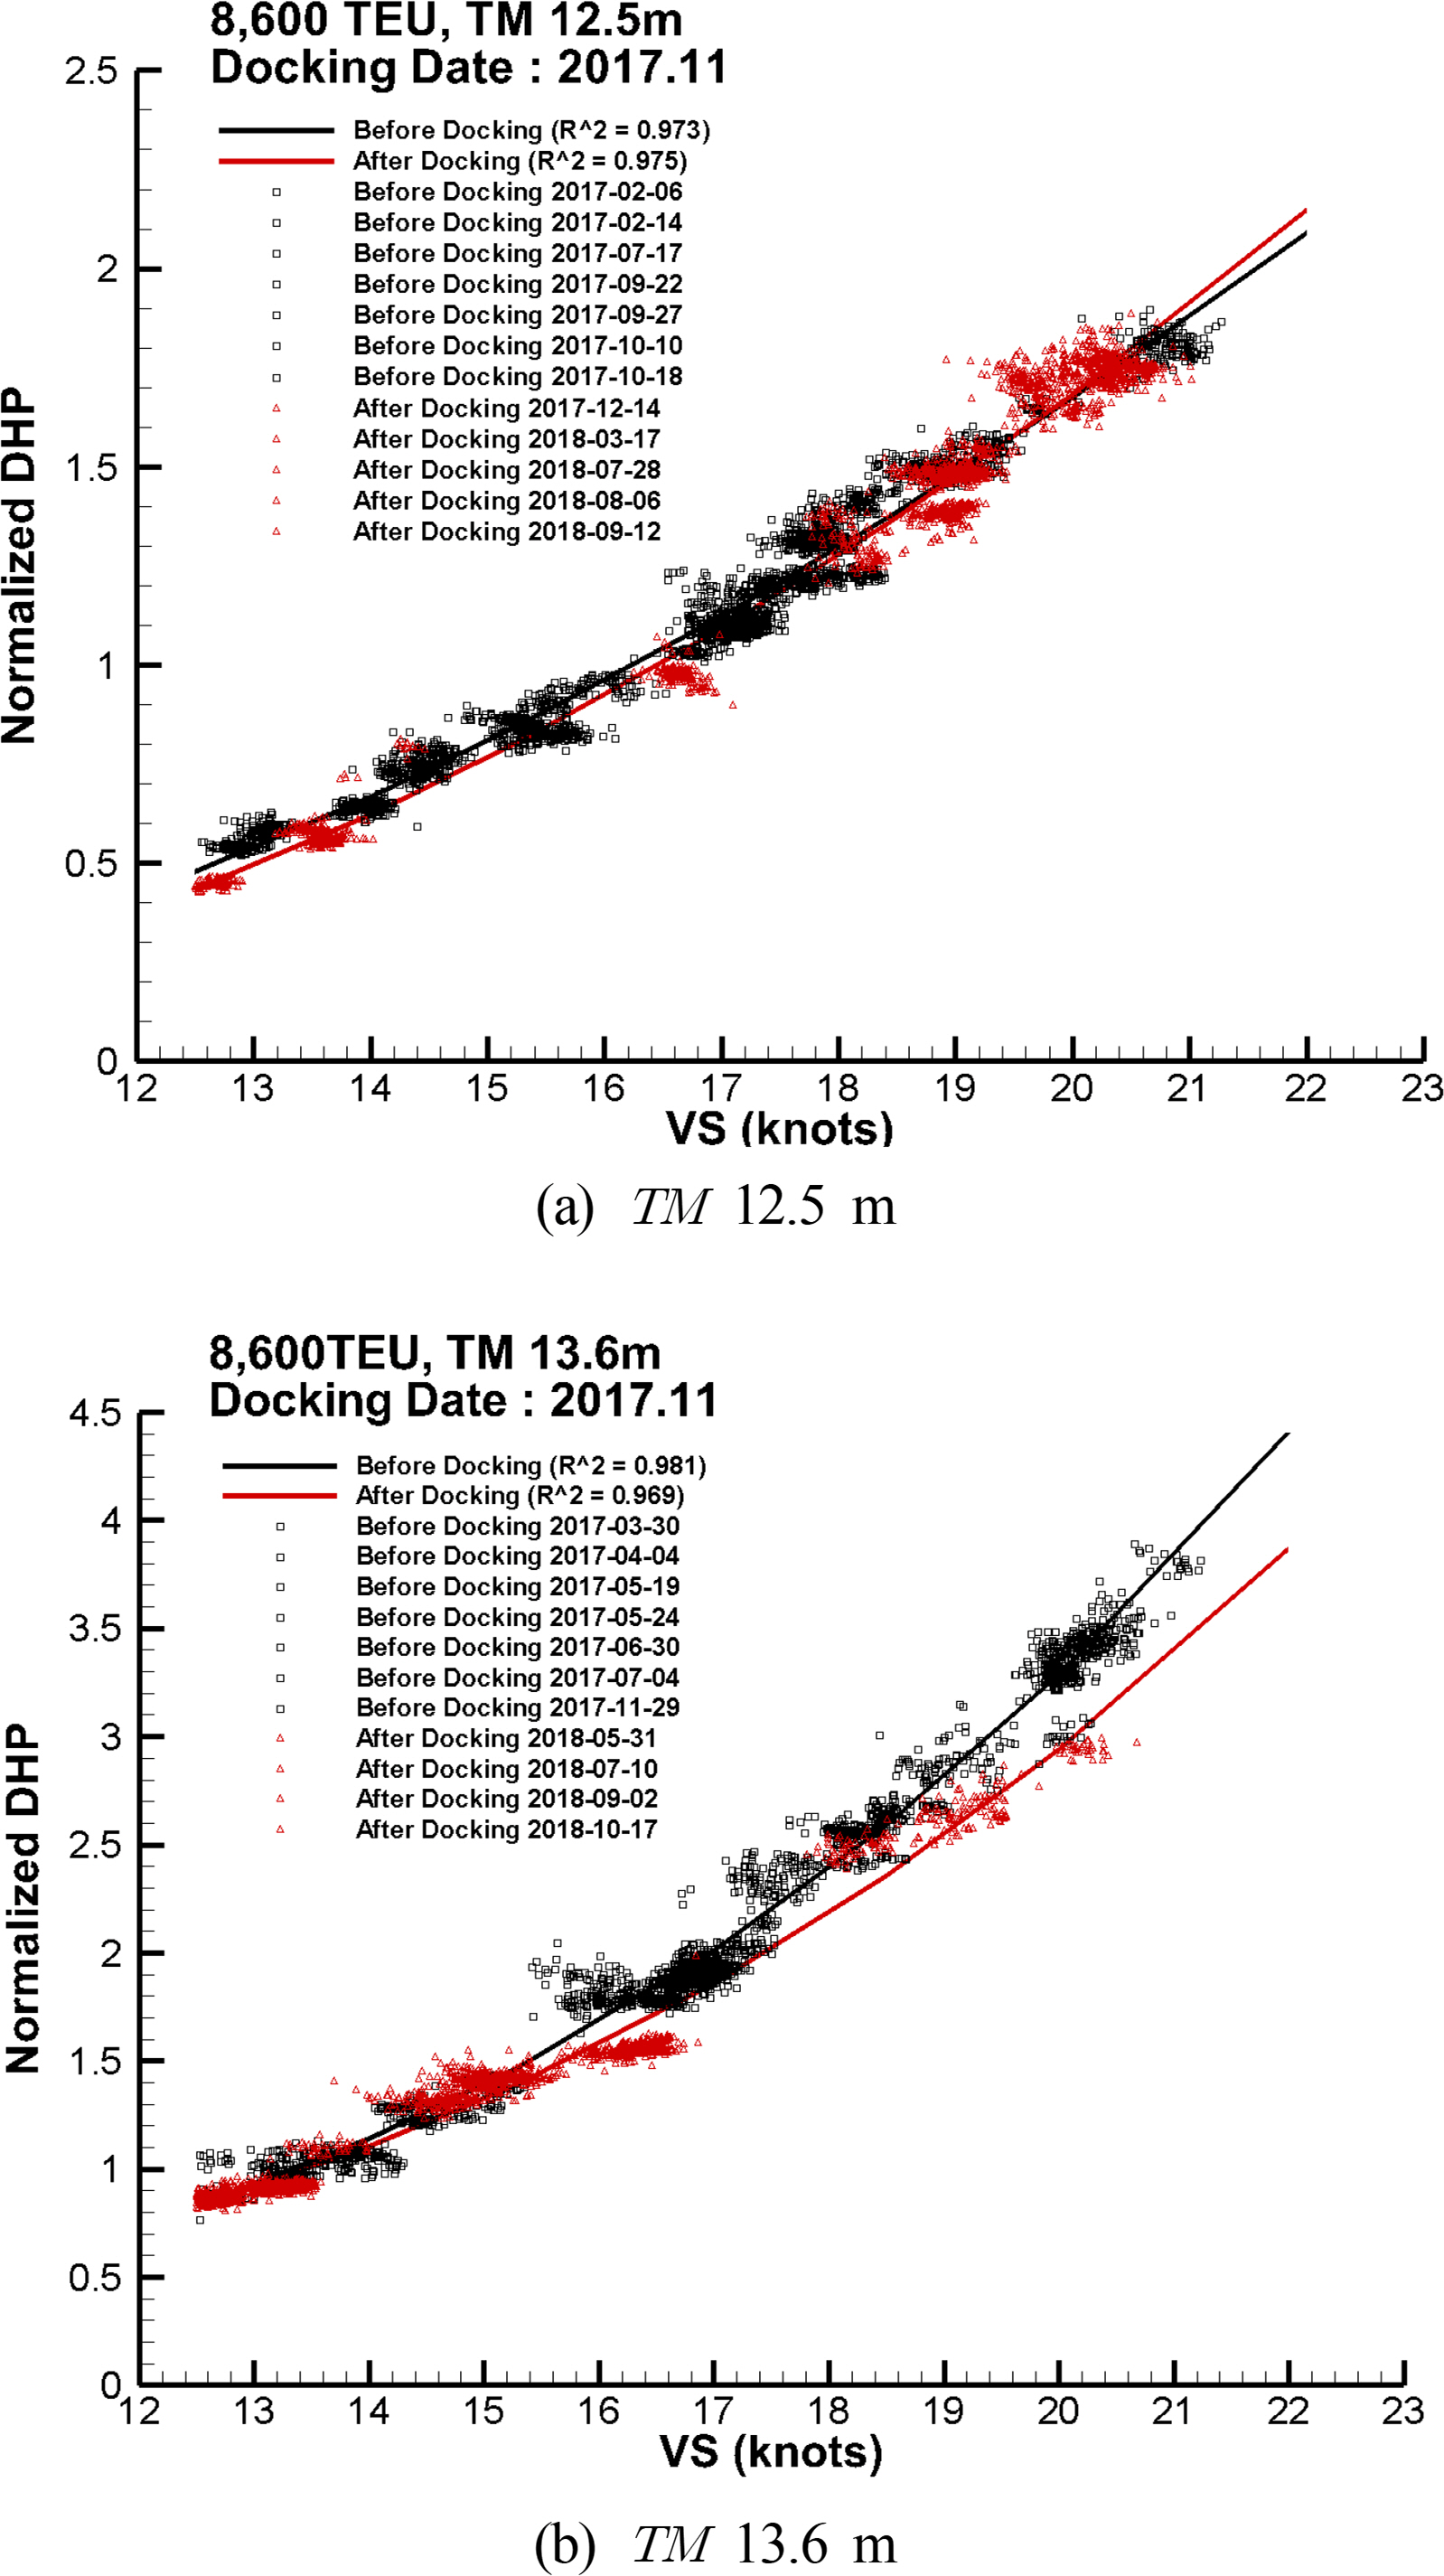
Comparison of speed-power analysis result between before and after docking in November 2017.
The wind resistance was calculated using the Fujiwara regression formula of ISO15016:2015 based on the onboard measurements. The wave resistance was calculated using STAWAVE-2 based on the wave values extracted from the weather information. The added resistance due to sea water temperature deviation was analyzed based on the onboard measurements (ISO 2015, Shin et al, 2020).
5. Conclusion
To reduce GHG emissions from existing ships operated by shipping companies, it is very important to identify accurate speed-power performance due to additional resistance from marine environment and aging effects.
In this study, onboard measurements and weather information data were compared using SPA software, and the docking effect was verified. The conclusions of this study are as follows:
In estimating the added resistance due to wind for an existing ship, the onboard measurements obtained using an anemometer were compared with the values provided by the NOAA. The wind resistance and speed-power analysis results were compared. The wind direction showed good agreement. For the wind speed, the weather information tended to be higher. The wind resistance has the same tendency, but the speed-power analysis results showed no significant difference, indicating that both methods are practically usable.
The wave height, wave direction, and wave period measured using wave radar and those obtained from the NOAA were compared. In addition, the added resistance due to waves was calculated and a speed-power analysis was conducted. It can be concluded that both the data from the wave radar and those from the weather information provided reliable results for analyzing the speed-power performance of an existing ship.
All of the data extracted from the weather information provided are valid and reliable results, confirming the reliability of trilinear interpolation adopted in this study.
The speed-power analysis results before and after docking showed that the results of TM 12.5 m were similar; however, in case of the TM 13.6 m, analysis results improved by 10%–12% near 20–22 kn (10.3–11.3 m/s) and by approximately 5% at the reference speed of 15.3 kn (7.87 m/s). This confirmed that the effects of cleaning and painting the antifouling low-friction paint on the hull and propeller during dry-docking can be quantitatively verified.
The speed-power analysis technique and SPA software were validated in this study. To obtain highly accurate analysis results, the accuracy of the measurement data must be improved and analysis methods must be continuously verified and developed.
Nomenclature
AXV
Transverse projected area above the waterline
CAA
Wind resistance coef. (CAA(0) means head wind)
TM
Draught at midships (m)
RAA
Resistance increase due to relative wind in newtons
RAW
Resistance increase in short crested irregular waves
RWAVE
Resistance increase in regular waves
UTC
Coordinated Universal Time
VG
Ship’s speed over ground
VS
Ship’s speed through the water
VWR
Relative wind velocity at the height of anemometer
VWRef
Relative wind velocity at the reference height
VWT
True wind velocity at the height of anemometer
VWTref
True wind velocity at the reference height
Za
Vertical height of anemometer
Zref
Reference height for the wind resistance
α
Angle between ship’s heading and component waves
ΔR
Total resistance increase
ρA
Mass density of air (kg/m3)
ψ
Ship’s heading in degrees
ψWR
Relative wind direction at the height of anemometer
ψWRef
Relative wind direction at reference height
ψWT
True wind direction at the height of anemometer
Acknowledgements
The authors would like to express their gratitude to Dr. Tae-Il Lee of Hyundai Heavy Industries Co., Ltd. for his assistance in preparing and analyzing the data used in this study.
This research was funded by the Ministry of Trade, Industry & Energy (Korea Government), grant number PNS3650, under the project “Optimal hull cleaning and propeller polishing scheduling for minimal ship operating cost using operating performance analysis.”