Investigation of Hydrate Inhibition System for Shallow Water Gas Field: Experimental Evaluation of KHI and Simulation of MEG Regeneration Process
Article information

Abstract
In this study, a hydrate inhibition system is investigated for shallow water gas fields. Mono-ethylene glycol (MEG) injection has been used as a typical method for inhibiting hydrate formation in gas fields; therefore, most offshore platforms are equipped with MEG injection and regeneration processes. A recent application of a kinetic hydrate inhibitor (KHI) has reduced the total volume of MEG injection and hence reduce the operating cost. Experiments are designed and performed to evaluate and verify the KHI performance for inhibiting hydrate formation under shallow water conditions. However, the shut-in and restart operation may require the injection and regeneration of MEG. For this operation, the MEG concentration must be optimized while considering the cost of MEG regeneration. The obtained results suggest that decreasing MEG concentration from 80 wt% to 70 wt% can reduce the life cycle cost (LCC) of MEG regeneration process by approximately 5.98 million USD owing to reduced distillation column cost. These results suggest that the hydrate inhibition system must be evaluated through well-designed experiments and process simulations involving LCC analysis.
1. Introduction
A system for the regeneration, storage, and injection of monoethylene glycol (MEG) is installed in gas field production platforms, and the purpose of injecting MEG into subsea pipelines is to inhibit hydrate formation (Kim et al., 2017). Lean MEG (MEG concentration 70–90 wt%) injected into subsea pipelines is mixed with water produced in a reservoir to maintain a certain MEG concentration level. When it reaches the platform, it is separated at the inlet separator to proceed to the regeneration process as rich MEG (MEG regeneration concentration of 20–50 wt%) (Kim et al., 2018a). The MEG regeneration process converts rich MEG into lean MEG through pre-treatment and distillation, constituting a large portion of the upstream of a gas field platform and requiring separate spaces for an MEG injection pump and a storage tank. Therefore, to reduce the production cost of a gas field platform, the design of injection, regeneration, and storage systems for MEG must be optimized during the design process, during which the flow assurance should be sufficiently tested through multiphase flow analysis and hydrate-phase equilibrium simulation (Kim et al., 2020). In particular, There have been attempts to minimize the MEG regeneration process in production platforms for shallow water gas fields in Southeast Asia, Middle East, and the North Sea, which requires a large volume and a high cost owing to the recent decrease in oil prices. A kinetic hydrate inhibitor (KHI) contains functional groups connected in a polymer chain structure; it can inhibit hydrate nucleation as well as suppress hydrate growth for a certain period of time at 0.5–3 wt%, unlike MEG (Park et al., 2019). When KHI is used, hydrate formation can be suppressed while water produced in a reservoir passes through subsea pipelines in a normal operation, thereby eliminating the need of injecting MEG.
Hydrate formation occurs in low-temperature and high-pressure conditions, and the hydrate formation conditions can be predicted thermodynamically. At a certain pressure, the difference between the minimum temperature of subsea pipelines and the phase equilibrium temperature of hydrates becomes the driving force of hydrate formation. The rate of hydrate formation decreases with the difference in the temperatures. Hence, it is likely that the rate of hydrate formation at production platforms for shallow water gas fields is slow, which is optimal for applying a KHI. A KHI inhibits the cluster formation process through the ring-structure connected in chains, during which water molecules convert to the hydrate crystal structure, while simultaneously decelerating the growth of hydrates by adhering to growth points after hydrates are formed (Kim et al., 2018b).
Accordingly, a KHI can demonstrate outstanding performances in shallow water gas fields where the driving force of hydrate formation is relatively low.
However, MEG regeneration is inevitable even at production platforms for shallow water gas fields because MEG injection is required for transient operations, such as for halting and resuming the production of subsea pipelines for a long period of time (Brustad et al., 2005). Hence, a flexible strategy in which a KHI is applied in a normal operation while applying MEG in a transient operation can be considered for reducing the operation cost of a production platform. The performance of a KHI must be assessed accurately, and the optimization of MEG injection and regeneration concentrations for transient operations must be investigated. Therefore, the risk of hydrate formation in shallow water gas fields was investigated in this study using a high-pressure stirred-tank reactor, and the hydrate inhibition performance in the presence of KHI was investigated experimentally. The MEG regeneration process was designed to obtain the appropriate lean MEG concentration by evaluating the economic feasibility of such processes for shallow water gas fields. The experimental and simulation results can be utilized as basic information for designing a production platform.
2. Experimental Apparatus and Simulation Model
2.1 Experiment for Evaluating Risk of Hydrate Formation
The formation of hydrates in subsea pipelines must be prevented. In other words, a sufficient amount of MEG must be injected to minimize the possibility of hydrate formation. Therefore, the temperature and pressure conditions for which hydrates can be formed were predicted thermodynamically, and the required MEG concentration was calculated. However, a thermodynamic simulation could not be performed for cases where a KHI was applied; therefore, the risk of hydrate formation was evaluated experimentally. Experiments regarding formation and dissociation were conducted using a high-pressure stirred-tank reactor since a hydrate is formed in a low-temperature and high-pressure condition. Fig. 1 shows the schematic diagram of the experimental apparatus used for the hydrate formation experiment. The high-pressure stirred-tank reactor was designed to apply a pressure of up to 15 MPa, and the fluid inside the reactor can be mixed at 0–800 rpm using a magnetic stirrer. For simulating subsea pipelines, 80 mL of water was injected to a 360 mL reactor (material: (SUS 316) and then pressurized to 12 MPa using natural gas. The natural gas comprising 90.0% CH4, 6.0% C2H6, 3.0% C3H8, and 1.0% n-C4H10 was supplied by Alpha Gas S.A. The reactor was positioned in a water bath such that it was submerged in a sufficient amount of ethanol solution; furthermore, it was connected to an external heater/refrigerator (Jeiotech RW2025G) to maintain the desired temperature. The temperatures of both the gas and liquid were measured using a platinum resistance thermometer that was accurate to 0.15 °C; the pressure was measured using a pressure transducer that was accurate to 0.01 MPa. The temperature of the solution was maintained at 20 °C at the initial stage of the experiment. Once the pressure inside the reactor stabilized, the temperature decreased to 10 °C, which is the operation condition of subsea pipelines at shallow water gas fields. The reactor was stirred at 600 rpm as the experiment began, during which the torque applied to the impeller was measured using a torque sensor (TRD-10KC) with an accuracy of 0.3%. The temperature, pressure, and torque data obtained through primary sensors were saved in a data storage system every 10 s. Hydrate formation can be observed at a specific point in time when the temperature is below the phase equilibrium of the hydrate. The characteristics of hydrate formation using pure water were analyzed when MEG and KHI were not injected; furthermore, the time hydrate formation was delayed after KHI injection was measured.
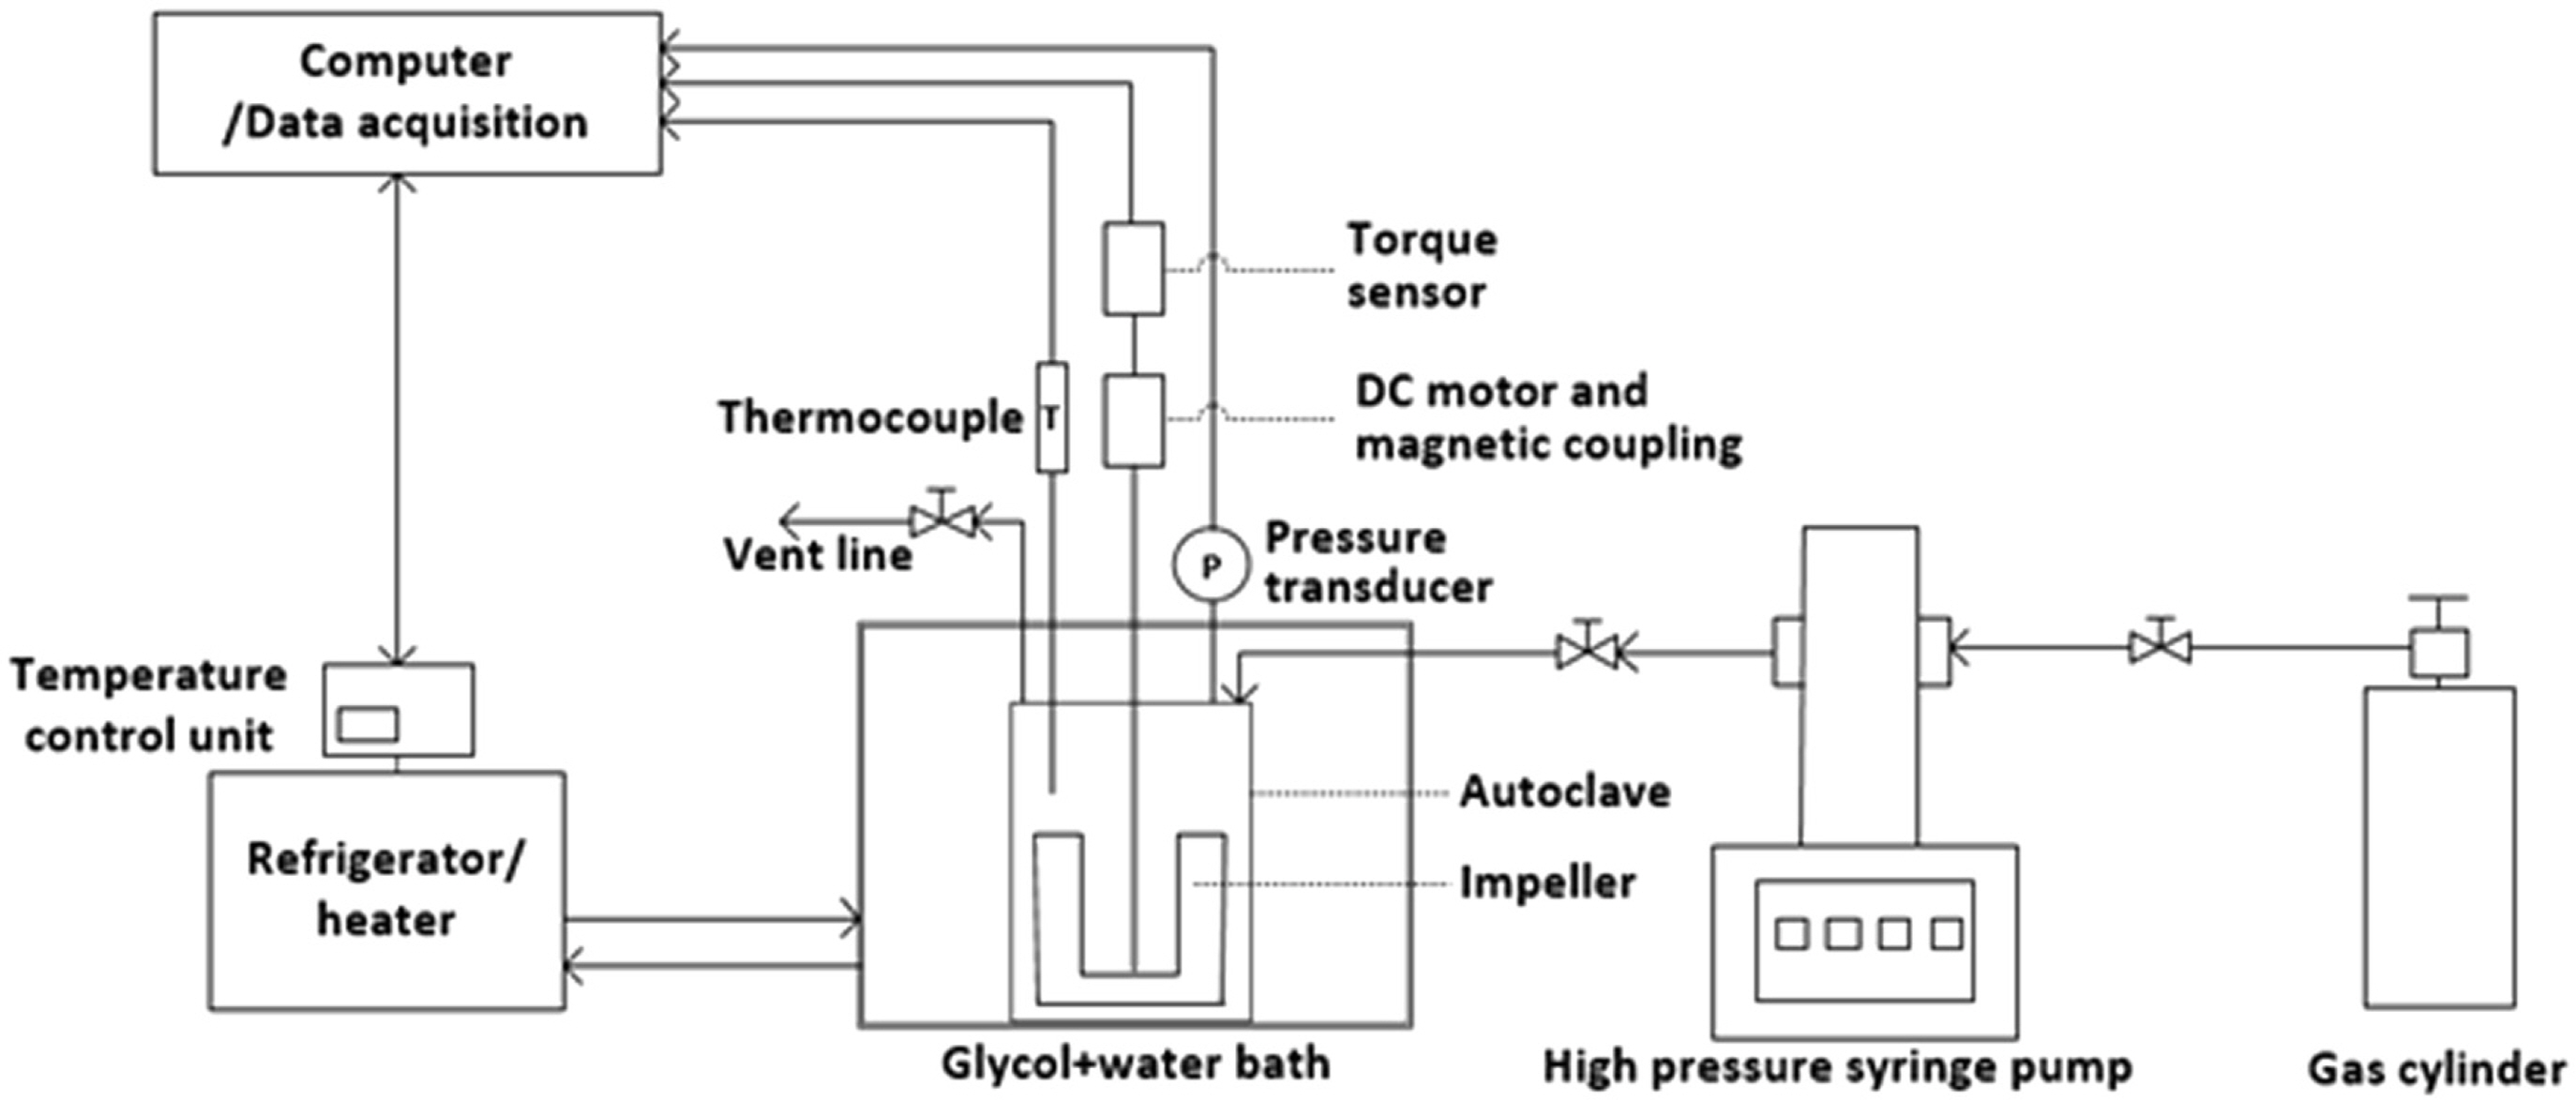
Schematic diagram of the experimental apparatus
2.2 Hysys Simulation Model for MEG Regeneration Process
The shallow water gas fields investigated in this study were assumed to be located at the depth of 60 m underwater. The gas fields in Southeast Asia and Middle East are primarily developed at the maximum depth of 100 m, and the water temperature remains at least 30 °C in the summer and 10 °C in the winter. The production pressure of a reservoir is at least 15 MPa, but subsea pipelines are operated at 10 MPa from the subsea tree to the platform. Considering the operation conditions of shallow water gas fields, the conditions for hydrate formation set in the thermodynamic simulation software (Multiflash, version 20) are shown in Fig. 2(a). If the sea water temperature is assumed to be 10 °C, then the hydrate is predicted to form when the pressure of the fluid flowing through the subsea pipelines exceeds 4 MPa. Hydrates may form depending on the season since the subsea pipelines in a typical gas field are operated at a pressure higher than 4 MPa. To prevent hydrate formation, the concentration must be maintained above 25 wt% by adding MEG to the water flowing through subsea pipelines, as shown in the phase equilibrium graph in Fig. 2(a). Therefore, the MEG regeneration process is required, through which MEG is injected into subsea pipelines and the concentration of the MEG solution is increased from 25 wt% to 70 wt% or greater. Fig. 2(b) shows the simulation model built using Aspen Plus version 9.0 for the MEG regeneration process of shallow water gas fields. It comprises two trains, which account for the production cycle of gas fields. The MEG solution having 25 wt% concentration retrieved from subsea pipelines was stored in the rich MEG storage tank and then increased to 70 wt% concentration or higher in the MEG flash drum and distillation column. The regenerated lean MEG was stored in the lean MEG storage tank and then injected into subsea pipelines using an injection pump. The operation condition of each unit was analyzed using the electrolyte non-random two liquid (ENRTL)-Redlich–Kwong (RK) models. The type, material, and size of the process were determined using the Aspen process economic analyzer. The ENRTL-RK model can be used to predict the major properties of a fluid based on vapor–liquid phase equilibrium. The RK model was used to calculate the fugacity of a vapor. The ENRTL model was used to calculate the activity coefficient of a liquid and can be applied to various systems containing electrolytes. The binary interaction parameters of the ENRTL model were revised using Aspen Plus version 9.0 and the vapor pressure data of MEG solution reported in the literature.
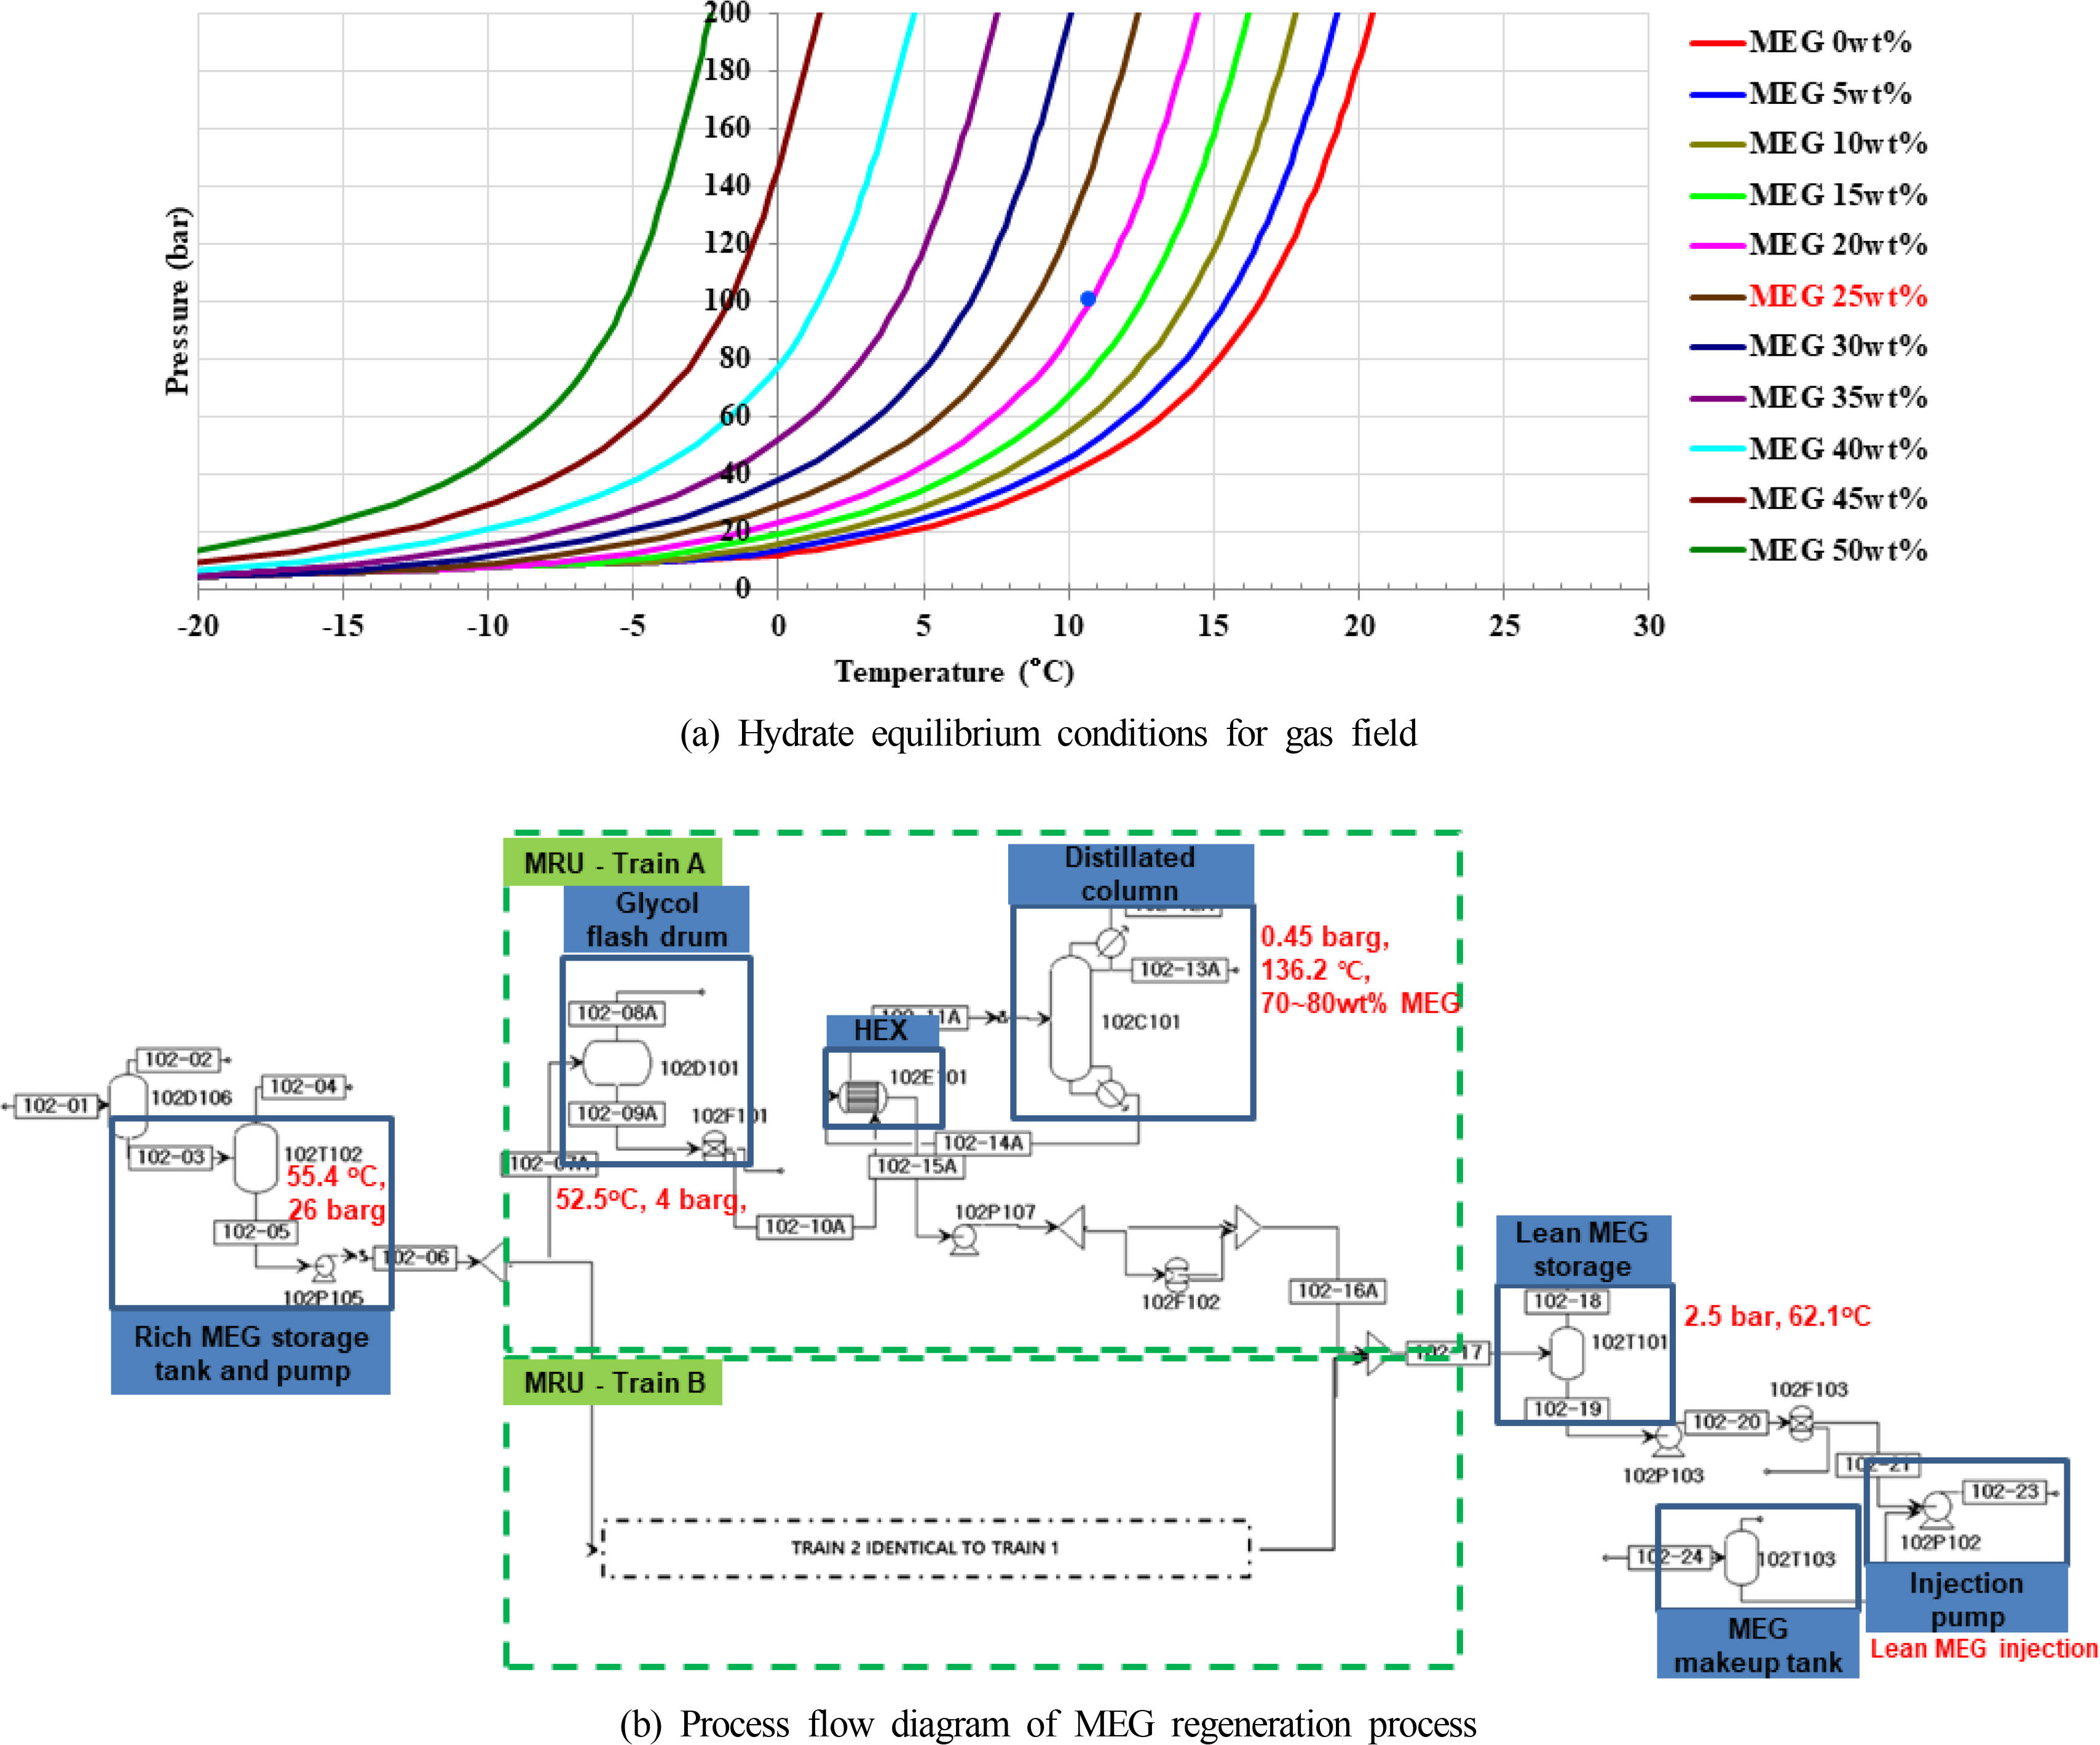
Hydrate equilibrium conditions to determine MEG concentration for subsea flowlines and detailed diagram of MEG regeneration process
To express the excess Gibbs energy (Gex ), the ENRTL model uses the Pitzer–Debye–Huckel equation (Gex,PDH ) and Born equation (Gex,Born) to calculate long-range ion interactions, as well as Gex, lc to calculate short-range ion, ion–molecule, and molecular interactions. The sum of interactions can be expressed as follows:
Therefore,
Here, T is the temperature, R the gas constant, γ the activity coefficient of a liquid, and i the ion type.
The Pitzer–Debye–Huckel equation for expressing long-range ion–ion interactions is as follows:
Here, A∅︀ is the Debye–Huckel constant, Ix the ionic strength, Z the charge of an ion, and ρ the density of the mixed solution. The Born equation is shown below.
Here, ∈o and ∈r are the dielectric constants of the solvent and water, respectively; γi is the Born radius of an ion particle i; NA is the Avogadro constant; zi is the charge of an ion; e is the elementary charge.
The short-range ion, ion–molecule, and molecular interactions can be expressed as follows:
Here, xi is the mole fraction of i; Ci is the absolute charge of an ion; αij is the non-randomness factor (= 0.2); i and j are the molecule and electrolyte, respectively; τij is the binary interaction energy parameter; Aij, Bij, and Cij are the temperature coefficients when Tref =298.15 K.
Once the design of the MEG regeneration process has been completed, the capital expenditures (CAPEX) were analyzed based on the equipment cost, whereas the operating expenditures (OPEX) were analyzed considering the fixed CAPEX, utility costs, and operation period. The life cycle cost (LCC) of the MEG regeneration process was calculated by summing the CAPEX and OPEX. In general, a lean MEG concentration of 70–90 wt% is selected to minimize the CAPEX and OPEX of a gas production platform. The platform for deep water gas fields is maintained at 80 wt% or above, but that of shallow water gas fields is maintained at 70 wt%. Hence, the operation adequacy and economic feasibility of the MEG regeneration process must be analyzed simultaneously to determine the optimal lean MEG concentration. In this study, the process design and economic feasibility were analyzed after increasing the MEG solution with 25 wt% concentration retrieved from subsea pipelines to concentrations of 70 wt% and 80 wt%.
3. Experimental Results of Hydrate Formation Risk Evaluation
3.1 Experimental Results of Hydrate Formation in Pure Water
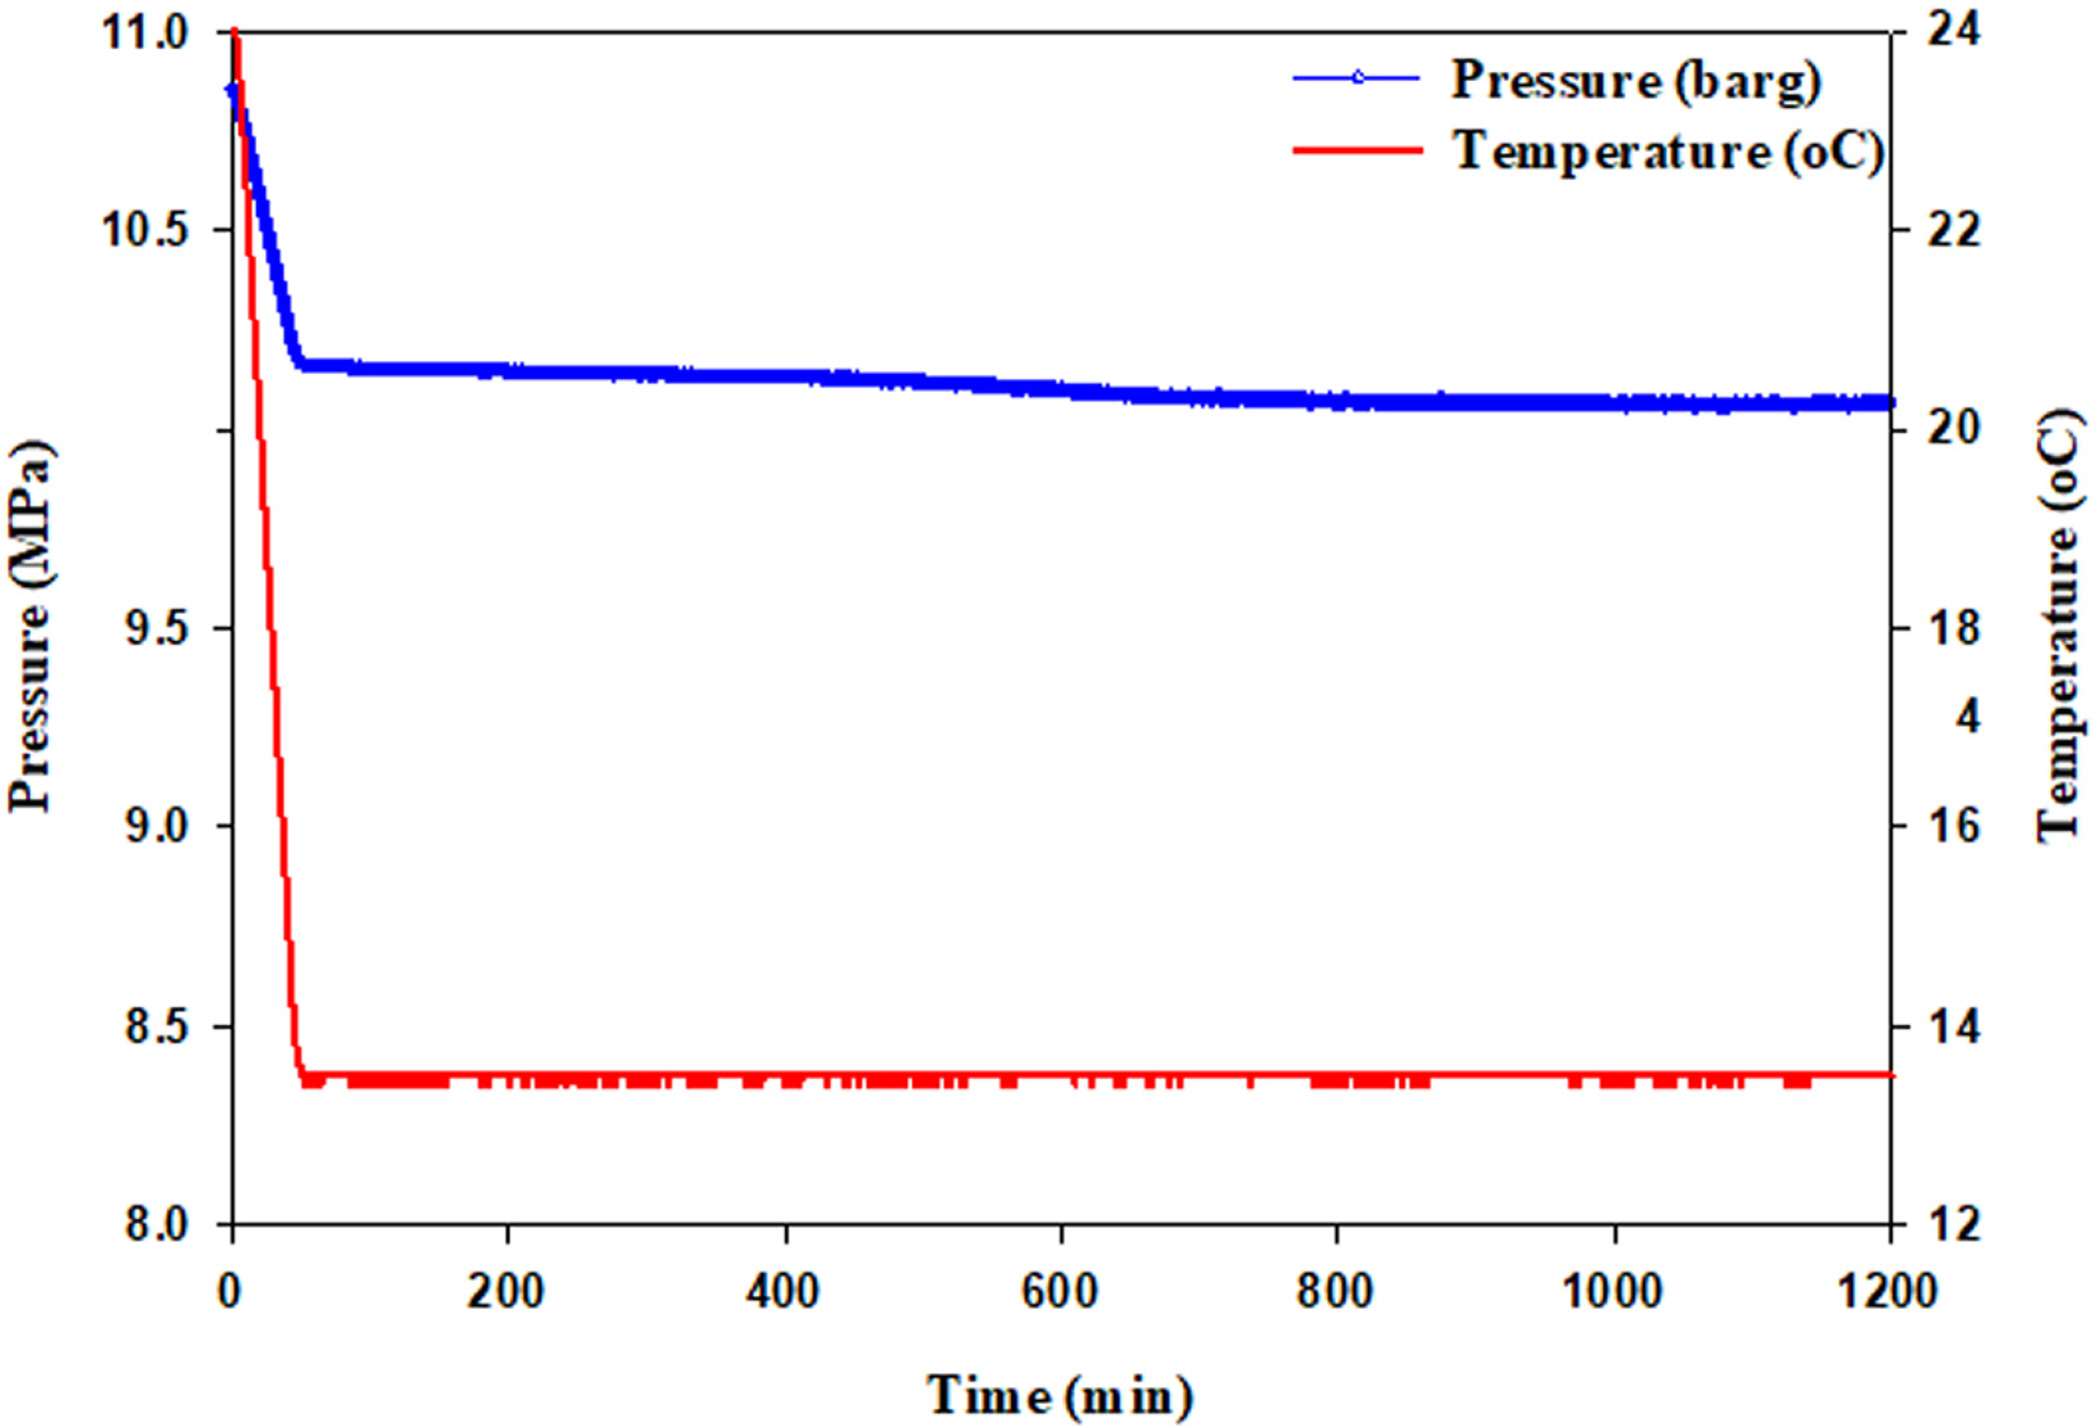
Hydrate formation in pure water was observed experimentally, in which hydrate inhibitors such as MEG and KHI were not injected. Fig. 3(a) illustrates the pressure–temperature diagram of hydrate formation in the operation conditions of subsea pipelines for shallow water gas fields. The starting temperature of the experiment was 23 °C and then reduced to 10 °C, which is the typical temperature of shallow water region in the winter, for over 1 h. The starting pressure of the experiment was 11 MPa, and hydrate formation occurred at a temperature lower than the hydrate formation temperature despite a decrease in the pressure within the reactor owing to a temperature decrease. Table 1 shows the hydrate formation temperature and pressure, which were measured thrice during the experiment; the delay time of hydrate formation was calculated accordingly. The average delay time of hydrate formation was 21.7 min, and the average water conversion rate was 46%. The experimental results show that water flowing in subsea pipelines can form hydrates after approximately 20 min even in shallow water regions. Fig. 3(b) shows the changes in torque observed during hydrate formation along with the hydrate volume fraction. The hydrate volume began increasing after a 20 min delay in formation time, whereas the torque, or the resistance against the flow, decreased simultaneously. The torque decreased after the volume fraction exceeded 0.3, but the change in torque exhibited several peaks rather than a continuous change after the volume fraction exceeded 0.4. Heterogeneous segregation occurred, in which water and hydrates became separated as the hydrate volume fraction increased beyond 0.4; additionally, a bedding was further developed, where hydrates were deposited on the walls of the stirred-tank reactor. Furthermore, 300 min after the hydrate had started to form, the relative torque reached a peak at 3.5 and showed a continuous fluctuation. The hydrates started to collide and constantly ground with the impeller as the amount of hydrates being deposited on the walls and floor of the reactor increased, thereby resulting in significant fluctuations in the relative torque.
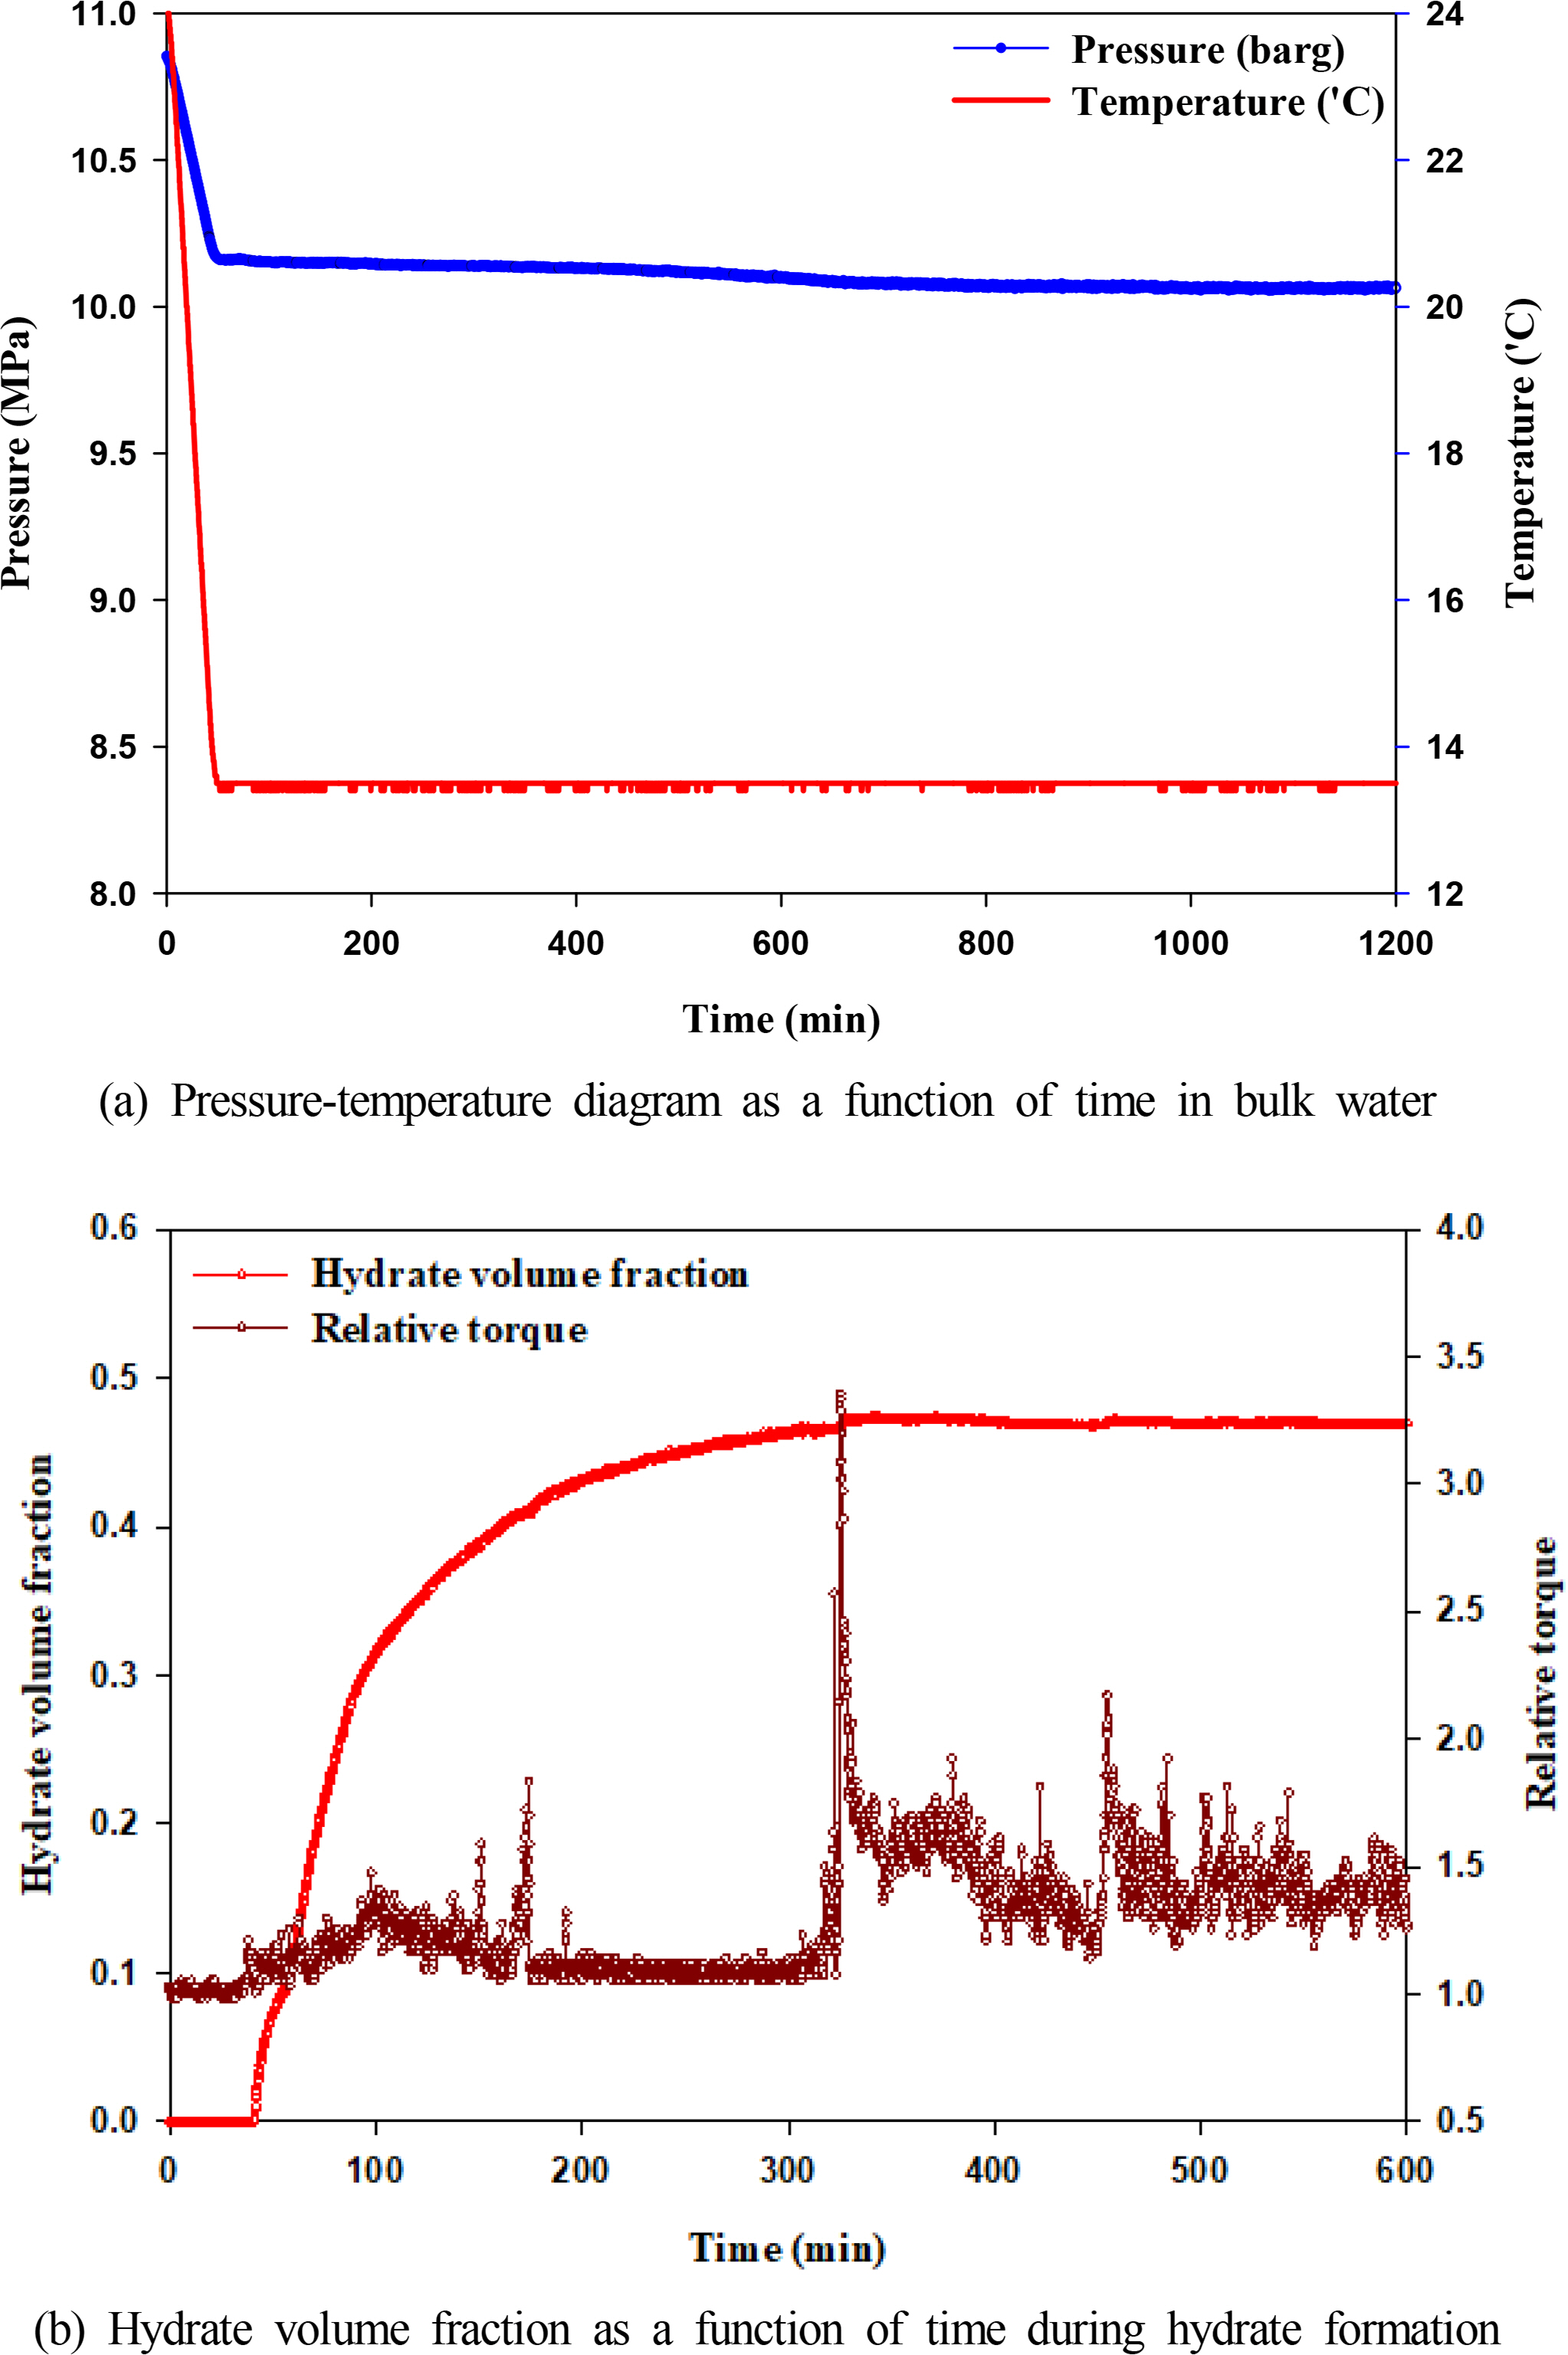
Hydrate formation characteristics in bulk water without adding hydrate inhibitors
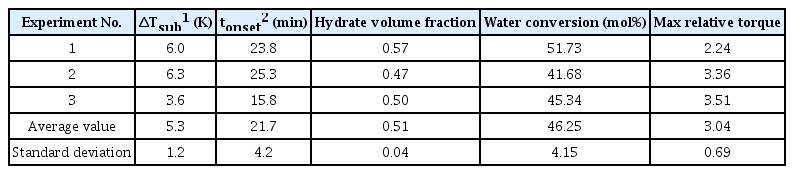
Quantitative analysis of hydrate formation characteristics
In subsea pipelines, hydrate formation begins as pure water flows through the pipes, and a constant flow can be maintained when the hydrate volume fraction is 0.3 or below. However, plugging occurs, i.e., the increased deposition of hydrate blocks the fluid flow when the hydrate volume fraction exceeds 0.4. The reactor used in the experiment was constantly applied with mixing energy using an external motor, which caused the hydrates to be ground. However, plugging will occur in subsea pipelines when the amount of energy of gas pushing water through the pipes is insufficient. Furthermore, plugging will occur more easily in subsea pipelines as bended points exist in pipes where the fluid velocity decreases.
3.2 Hydrate Inhibition Performance of KHI
Fig. 4 shows the hydrate experimental results when a KHI was injected. BASF’s Luvicap was used as a KHI, and the concentration was maintained at 2.4 wt% for this experiment. As shown in the figure, hydrate formation was not observed for 20 h, during which the concentration of Luvicap was maintained at 2.4 wt%. The experiment was repeated thrice using pure water, but hydrate formation was not observed for 20 h. The temperature and pressure were maintained at 10 °C and 10 MPa, respectively. This result indicates that hydrate formation was inhibited for 20 h when Luvicap was injected to maintain the concentration at 2.4 wt%. When the subsea pipelines in shallow water gas fields were assumed to be 40 km long, the time that water remained in the subsea pipelines was calculated to be 4.4 h at the maximum when the production output was low. Therefore, water can be prevented from converting to hydrates if a sufficient amount of Luvicap is injected as a hydrate inhibitor to maintain the concentration of water flowing in the subsea pipelines, i.e., 2.4 wt% or higher. Accordingly, it is confirmed that Luvicap suffices as a KHI if the temperature of subsea pipelines in shallow water region can be maintained at 10 °C.
Pressure-temperature diagram as a function of time in 2.44 wt% Luvicap solution. No hydrate formation was observed.
However, as explained earlier, using a KHI alone is insufficient to prevent hydrate formation when an operation is halted for a long time, or for extended shut-ins. Therefore, MEG must be injected, and the injected MEG must be converted to lean MEG through the regeneration process on the offshore platform.
4. MEG Regeneration Process Simulation Results
The simulation results of the MEG regeneration process obtained from Aspen Plus version 9.0 are shown in Fig. 2(b) above. The rich MEG (concentration 25 wt%) injected into the subsea pipelines was stored in the storage tank at 2.6 MPa and then sent to the MEG regeneration process. The flow rate was 27,317.2 kg/h. Natural gas and condensates were removed in the MEG flash drum in advance and then supplied to the MEG distillation column through a filter and a heat exchanger. The MEG distillation column was operated at 0.15 MPa. To increase the MEG concentration from 25 wt% to 80 wt% and 70 wt%, the temperature must be maintained at 137.6 °C and 127.5 °C, respectively. Vapor was discharged through the top of the distillation column, and the lean MEG with increased concentration was retrieved through the bottom to be sent to the storage tank. The MEG concentration required for subsea pipelines was 25 wt%; hence, an injection at 13.03 MPa using an injection pump was required. The operating conditions of the main equipment constituting the process are shown in Table 2.
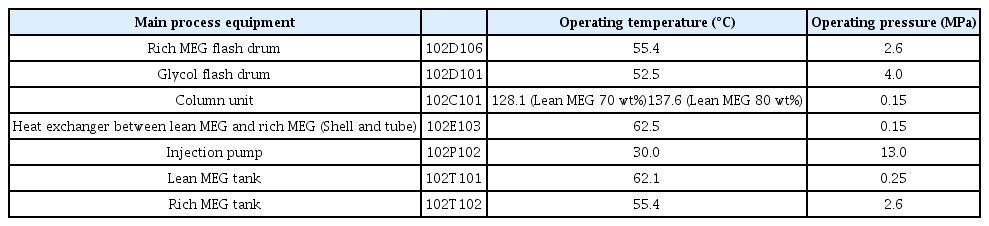
Description of operating conditions of main equipment
The boiling points of water and MEG are 100 °C and 197 °C, which differ significantly; therefore, rich MEG can be easily converted to lean MEG through the distillation column. However, the water produced from a reservoir flowing into subsea pipelines contains a large amount of salt substances such as NaCl, which can result in the deposition of salt in the reboiler during the distillation process. If the salt concentration of the produced water is assumed to be 30 g/L for the shallow water gas fields being studied, salt deposition will not occur because the allowable NaCl concentration of lean MEG is 76 g/L when the MEG concentration is increased to 80 wt%. A separate study is being conducted to investigate the risk of salt deposition, which will be presented in the near future.
The MEG regeneration process using a distillation column consumes a large amount of energy; therefore, technical implementations are necessitated to reduce the CAPEX and OPEX. More specifically, the distillation column temperature can be maintained at 137.6 °C while increasing the lean MEG concentration to 80 wt%, or the distillation column temperature can be maintained at 128.1 °C while increasing the lean MEG concentration to only 70 wt%. The lean MEG concentration can be increased up to 90 wt% for deep water gas fields, but the economic feasibility of increasing the lean MEG concentration to 80 wt% by applying a significant amount of heat energy for shallow water gas fields must be investigated. In this study, an LCC analysis was performed for both the CAPEX and OPEX required for the operation and performing the MEG regeneration process. The LCC analysis was conducted to determine the size of major equipment based on the results of simulating the MEG regeneration process, which was performed previously, and to calculate the equipment cost using the Aspen economic analyzer. The CAPEX were calculated based on the cost of each piece of equipment (Peters et al., 1968), whereas the OPEX were predicted based on the CAPEX (Turton et al., 2008). The following were assumed for assessing economic feasibility. First, only the electricity, steam, and coolant costs were considered for the OPEX. The process reliability and annual operation hours were assumed to be 91.3%/y and 8,000 h/y, respectively, for the MEG regeneration process. The pump efficiency was 70%, and the reserved pump and heater were not considered. Low-pressure and high-pressure steams were used for heating, whereas a coolant was used for cooling. The heating and cooling capacities calculated from the process simulation were used. The operation cost including utilities might vary depending on the region and corresponding year; hence, the calculation performed in this study was based on the Southeast Asia region in 2018. The LCC was calculated as the sum of the total CAPEX and OPEX that will be input for 20 years, or the total operation time of the MEG regeneration process. The discount rate was assumed to be 8%. The factors affecting the CAPEX included the operation conditions, equipment type, and materials. The CAPEX were mainly affected by the large MEG storage tank, distillation column, and injection pump of the MEG regeneration process. The CAPEX increased due to an increase in the height of the distillation column when the lean MEG concentration was set to 80 wt%. By contrast, the MEG injection pump capacity as well as the CAPEX decreased when the flow rate of MEG being injected into the subsea pipelines decreased. Table 3 shows the analysis results of the CAPEX for the MEG regeneration process when the lean MEG concentrations were set to 70 wt% and 80 wt%.
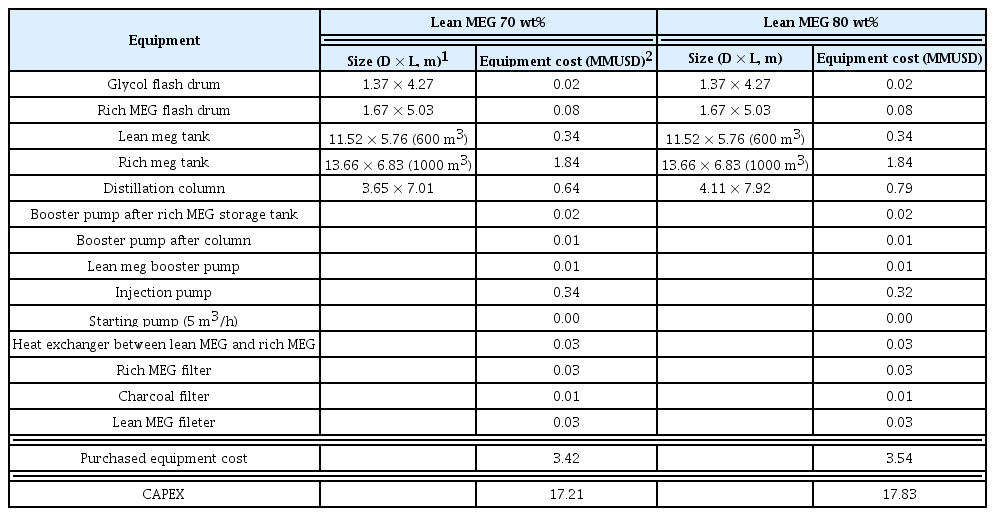
Total capital investment for MEG regeneration package in case of regenerating up to 70 wt% and 80 wt% lean MEG
The factors affecting the OPEX included utility and maintenance/repair costs. The MEG injection flow rate and pump capacity both decreased when the lean MEG concentration was 80 wt%, thereby lowering the electricity cost of the injection equipment. However, the energy cost increased with the amount of low-pressure steam usage owing to the temperature increase in the distillation column. The maintenance/repair costs of the major equipment were affected significantly by the initial equipment price and the equipment size. Table 4 shows the OPEX when the lean MEG concentrations were set to 70 wt% and 80 wt%. The initial cost of the raw material included the initial MEG cost and operation cost. The initial MEG injection amount was determined based on the assumption that MEG was injected to the subsea pipelines for 12 h.
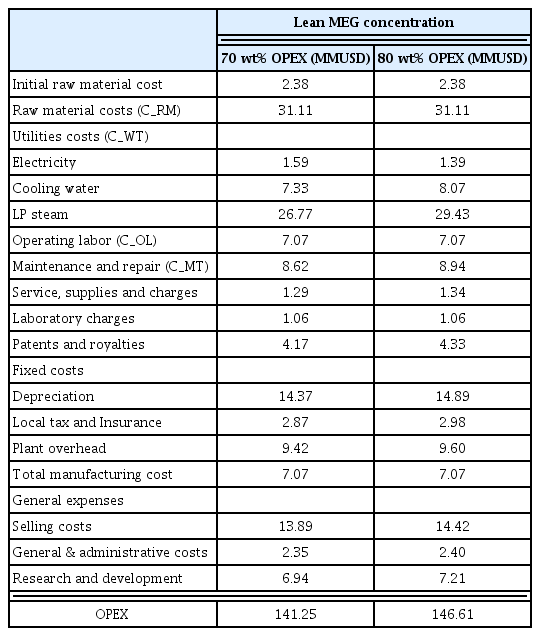
OPEX for MEG regeneration package in case of regenerating up to 70 wt% and 80 wt% Lean MEG
The LCC of the MEG regeneration process can be predicted using the CAPEX and OPEX presented in Tables 3–4. Fig. 5 shows the major equipment cost and utility cost of the MEG regeneration process. The LCC, which is the sum of the CAPEX and OPEX, was 158.46 and 164.44 MMUSD when the lean MEG concentrations were set to 70 wt% and 80 wt%, respectively. The major equipment size and operation cost varied based on the lean MEG concentration, and it was confirmed that maintaining the lean MEG concentration at 70 wt% was more advantageous for the MEG regeneration process.

Major purchased equipment cost and utility costs
5. Conclusion
This study proposed injecting both KHI and MEG simultaneously to inhibit hydrate formation for shallow water gas fields. For the normal operation state, injecting a KHI prevented the formation of hydrates while the fluid being produced through subsea pipelines. It was confirmed through experiments that injecting Luvicap at 2.4 wt% suppressed hydrate formation for 20 h. For subsea pipelines measuring 40 km, the fluid remained in the pipes for 4.4 h, thereby enabling the injection of Luvicap to inhibit hydrate formation. As sea water temperature significantly affects hydrate formation, not injecting a KHI in the summer when the sea water temperature is high is an alternative. However, in the winter, a KHI must be injected constantly and MEG should be injected if the platform operation is halted for equipment replacement or maintenance and repair.
The MEG regeneration process is utilized to regenerate the injected rich MEG into lean MEG; therefore, the CAPEX and OPEX must be minimized. In this study, an LCC analysis was conducted by calculating the operation cost, in which the initial cost of the raw material and C_RM were the same while the lean MEG concentration in the MEG regeneration process was varied. The calculated LCC was low when the lean MEG concentration was 70 wt%. The initial equipment cost was more economical when the concentration was 70 wt%; hence, it was more favorable to set the concentration to 70 wt% for the operation condition of the MEG regeneration process. Although using hydrate inhibitors such as MEG or KHI can prevent accidents caused by hydrate formation in gas field pipelines and hence reduce the related maintenance/repair costs, an LCC analysis for the economic feasibility through the optimization of lean MEG concentration is crucial in building a sustainable system.
Finally, sustainable and advanced technologies should be applied to actual projects since CAPEX and OPEX can be reduced by selecting flexible strategies for inhibiting hydrate formation.