J. Ocean Eng. Technol. Search

CLOSE


J. Ocean Eng. Technol. > Volume 34(2); 2020 > Article
Kim, Kim, and Lee: Dynamic Response of Drill Floor to Fire Subsequent to Blowout

Abstract

Explosions and fires on offshore drilling units and process plants, which cause loss of life and environmental damage, have been studied extensively. However, research on drilling units increased only after the 2010 Deepwater Horizon accident in the Gulf of Mexico. A major reason for explosions and fires on a drilling unit is blowout, which is caused by a failure to control the high temperatures and pressures upstream of the offshore underwater well. The area susceptible to explosion and fire due to blowout is the drill floor, which supports the main drilling system. Structural instability and collapse of the drill floor can threaten the structural integrity of the entire unit. This study simulates the behavior of fire subsequent to blowout and assesses the thermal load. A heat transfer structure analysis of the drill floor was carried out using the assessed thermal load, and the risk was noted. In order to maintain the structural integrity of the drill floor, passive fire protection of certain areas was recommended.

1. Introduction

With oil prices rising and terrestrial development of oil & gas being constrained, offshore oil fields are being extensively explored and developed. Safety is extremely important in the development and operation of offshore oil fields, which are generally situated in remote marine locations. This is because the platforms are in direct contact with local environments, and accidents can result in loss of human life and ecological damage. This was seen in the aftermath of the Piper Alpha platform accident (Fiona and Stephen, 2018) and the Deepwater Horizon rig accident (Lazarus, 2016). There is an ever-present risk of fire and explosion due to oil & gas spills in offshore plants, and many studies have been conducted to protect people and the environment from these risks (Bai and Jin, 2016; Jin and Jang, 2015; Suardin et. al., 2009). However, there have been relatively few studies on fires and explosions caused by blowouts on drillships than on oil & gas refining and storage facilities such as floating production storage and offloading (FPSO) (Dadashzadeh et al., 2013). A drillship fire caused by blowout is initiated by the ejection of a large amount of oil & gas from the oil well, implying that the size of the fire and heat flux is significantly greater than fires caused by other reasons (Skogdalen and Vinnem, 2012). For this reason, more in-depth research is needed. This study aims to address the fire subsequent to blowout, which refers to the sudden ejection of oil & gas that may occur due to the failure of pressure and heat control in underwater wells during drilling operations. The drill floor is directly exposed to oil and gas spills and is most directly affected by blowout fires, because the main drilling rigs stand on it. With this in mind, the aim of this study is to consider the behavior characteristics of the drill floor due to fires when a blowout occurs in the drillship. First, the blowout and fire scenarios are described, and heat flux of the drill floor and the surrounding area due to fire are predicted through fire analysis, then the behavior of the drill floor structure are investigated. The problem of structural stability in the drill floor under fire subsequent to blowout was investigated, and as a result, we have proposed that passive fire protection (PFP) is required for structural stability of the drillship, and a PFP method befitting the drill floor structure was presented with reference to prior optimization studies considering the economic cost of PFP application.

2. Fire Analysis

2.1 Analysis procedure

The Kameleon FireEx (KFX) fire analysis program solves partial differential equations of three-dimensional turbulent flows over time using finite volume techniques. The development and extinction process of fire over time are simulated in complex 3D spaces such as offshore structures or open space with consideration of the dispersion of flames and gas, and the results are illustrated (Vembe et al., 2014). For fire analysis following blowout, a blowout scenario is firstly established, and the entire drillship model including the drill floor is imported from the 3D CAD model using the KFX program. As shown in Fig. 1, it is converted to a 3D geometry model to be used in KFX, and in case of blowout, dispersion analysis of gas and fire subsequent to ignition is performed using CFD (Jin et al., 2016). From this, the heat flux distribution of the drill floor and the surrounding area is obtained for each fire scenario. The above procedure can be applied to fire analysis of offshore structures (Bai and Jin, 2016). The specifications of the drillship used for the analysis were 230 m in length, 42 m in width, and drill floor elevation 38 m.

2.2 Main assumptions
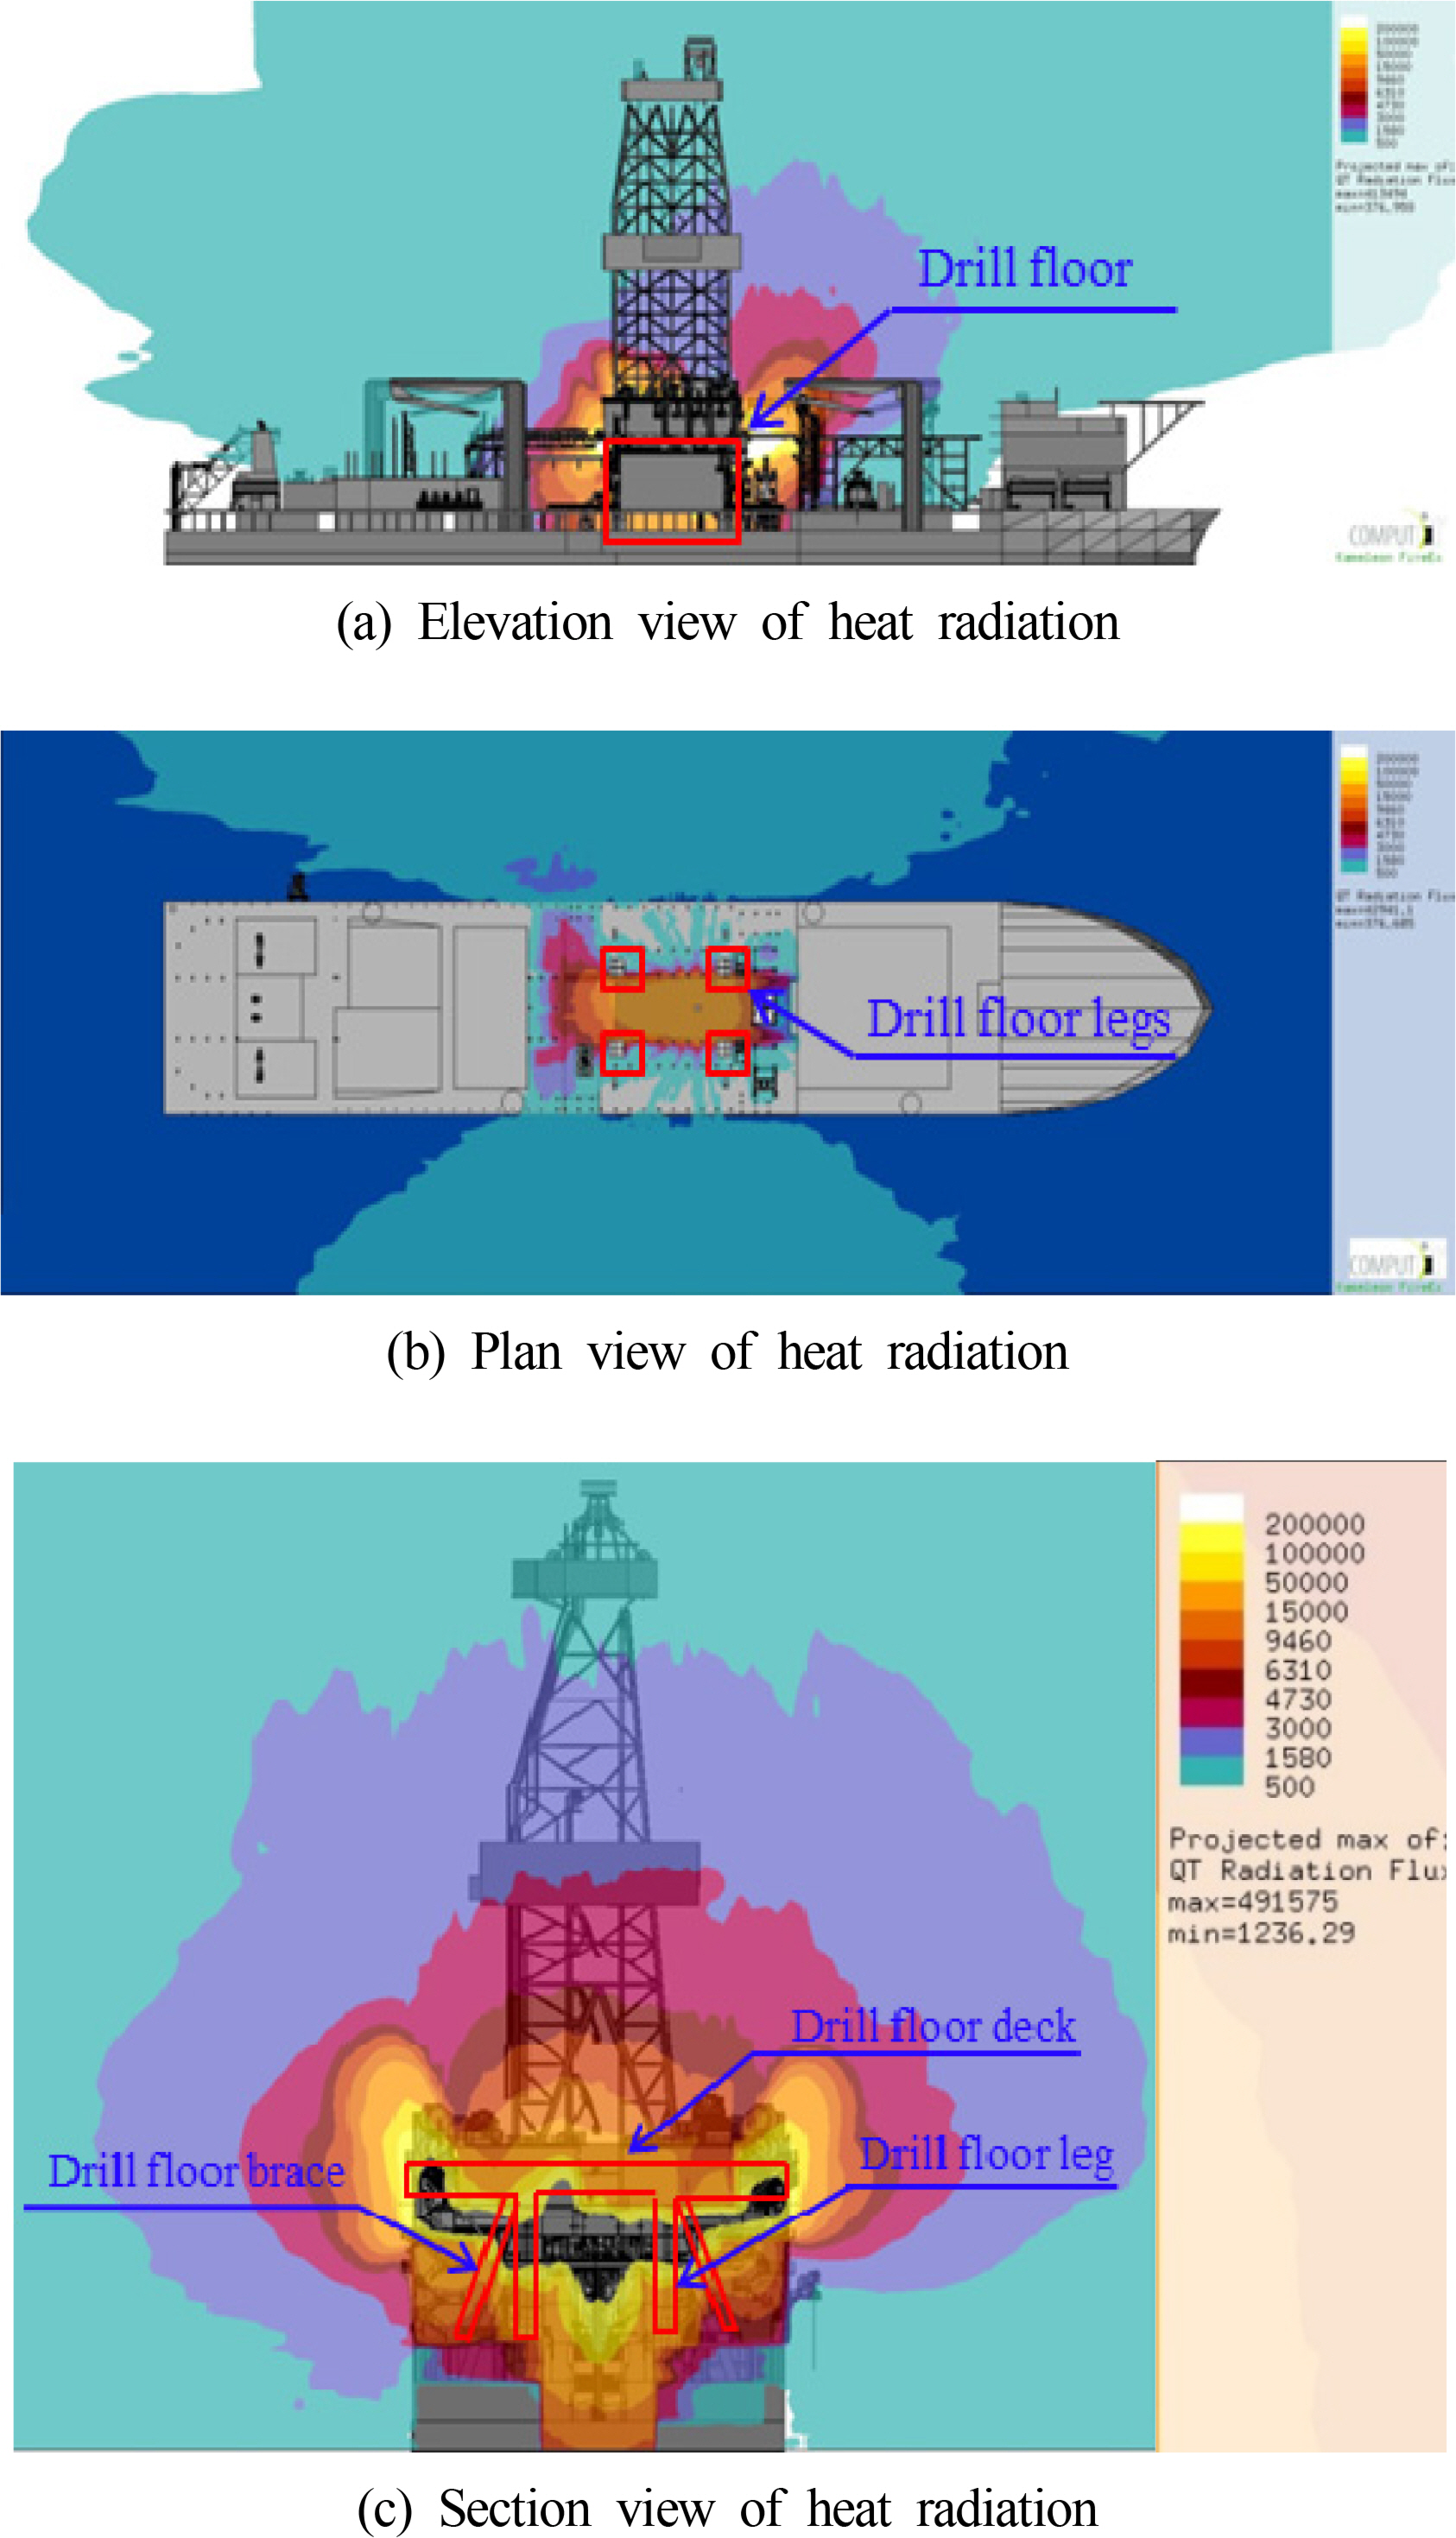
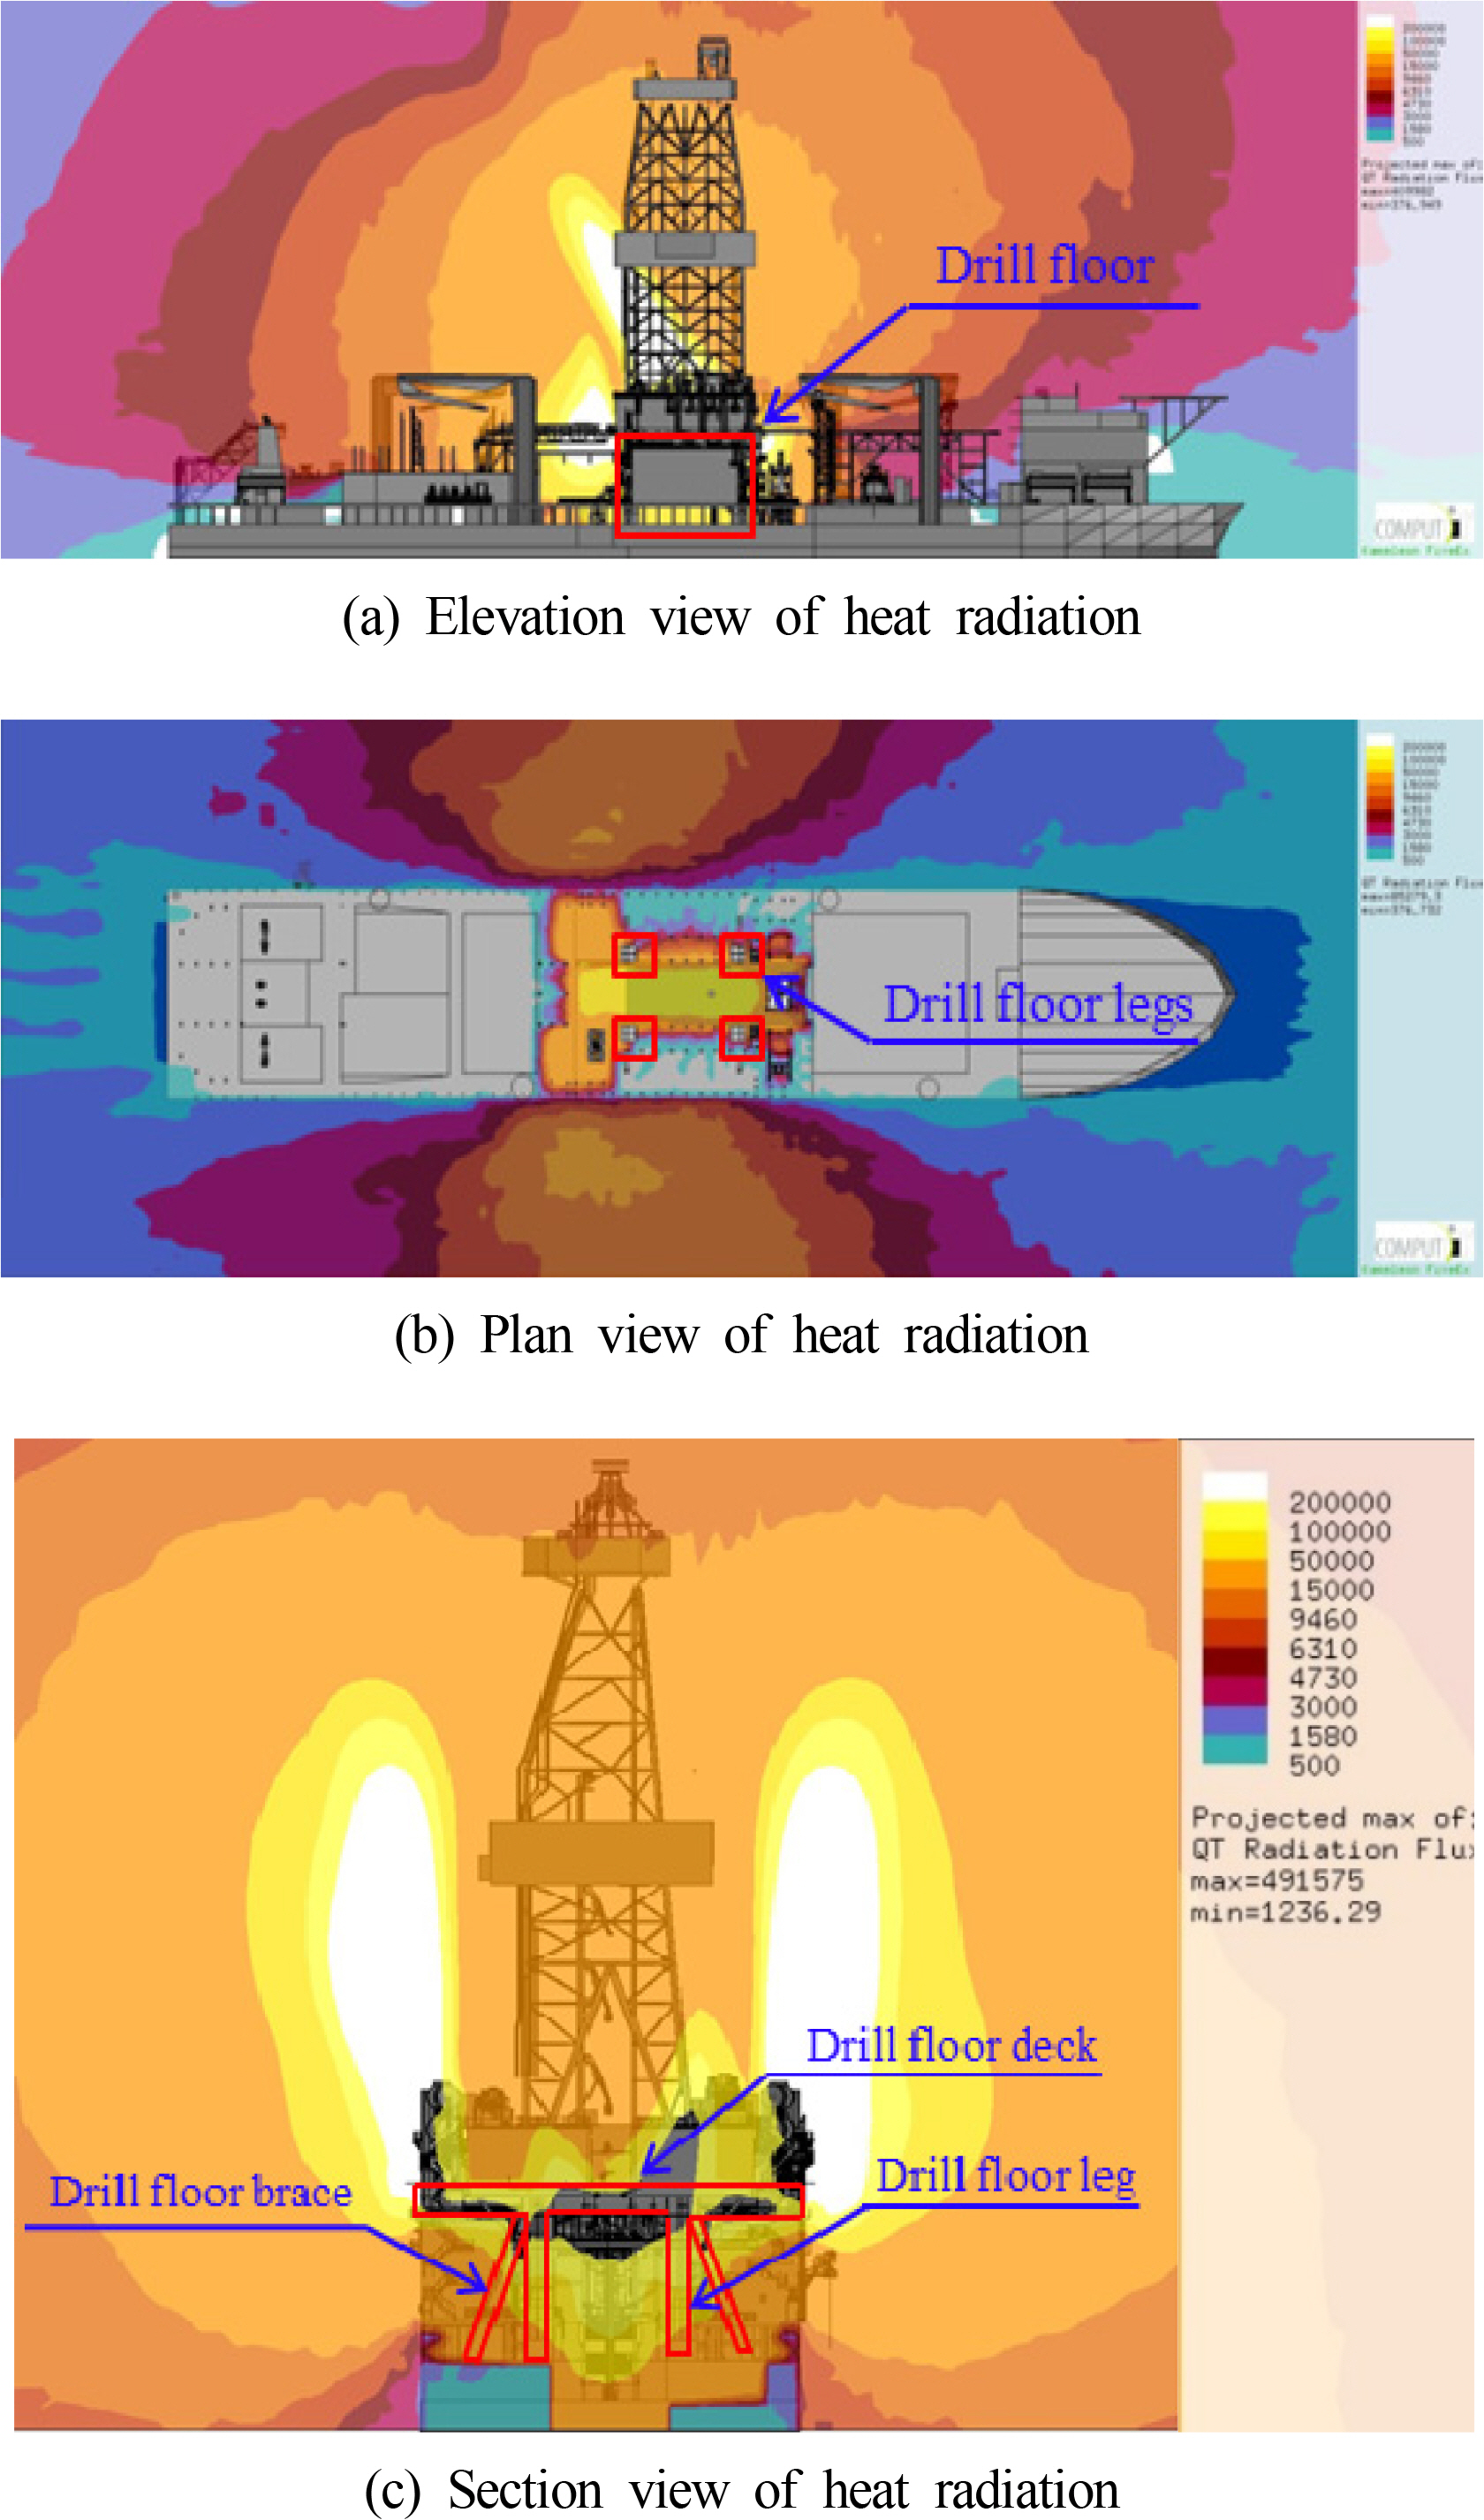
Blowout flow rates of 10–35 kg/s for normal blowout and 50–200 kg/s for high pressure high temperature (HPHT) blowout are generally presented (Health and Safety Executive, 2017). In a study on deepwater drilling (ABS Consulting, 2015), a restricted flow rate of 35 kg/s and a full flow rate of 150 kg/s were presented. In this study, 35 kg/s and 150 kg/s were adopted. The gas flow composition was 80% methane and 20% pentane, and the environmental conditions were based on Meta ocean data (Santos Basin, 2008) of the Santos waters in Brazil, where the drillship is in operation. The ambient temperature used was the annual mean of 23 °C, wind speed was the annual mean 5.4 m/s, and 9 m/s, which is the upper value of the annual 10%, representing a rougher environmental condition than may occur during drilling. The wind is in the direction of the bow and the stern, because the direction of the wind is equal to the direction of the wave. Accordingly, the wind direction and the bow-stern direction are matched to reduce the roll motion of the ship during drilling operations.

2.3 Fire scenarios

Fire analysis was performed using typical drilling scenarios. The results are shown in Table 1. As explained in 2.2 Main Assumptions, the annual mean values of a specific area of the sea from a previous study were used for the ambient temperature and wind speed, and the wind direction was selected in consideration of drilling operations. With the construction of the scenarios, the results of fires that may occur in a general drilling environment were obtained, and these were applied to the analysis of the drill floor structure to investigate the behavior, enabling the practical application of the results.

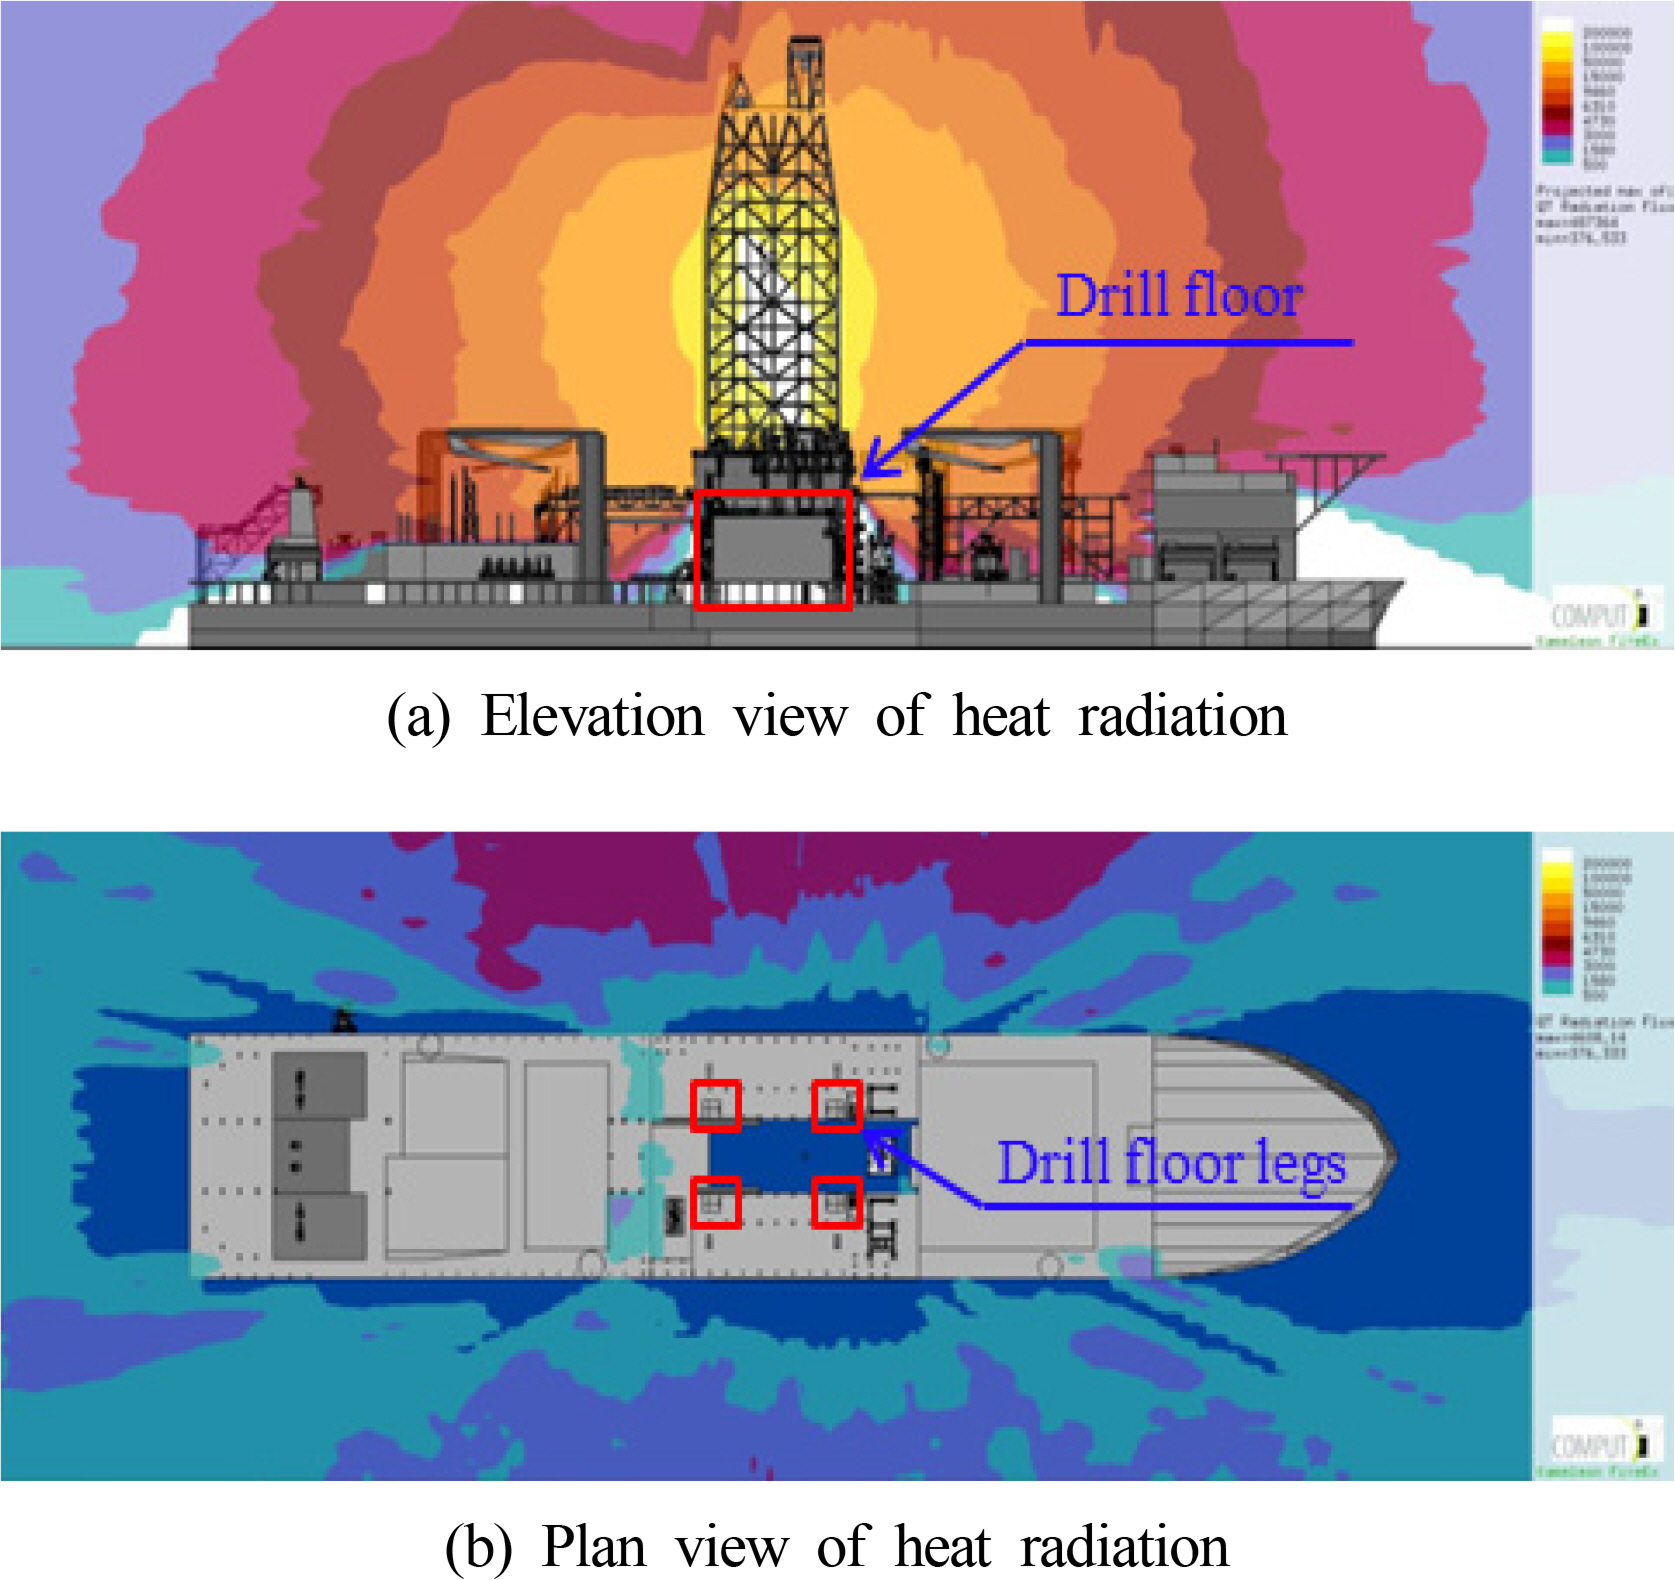
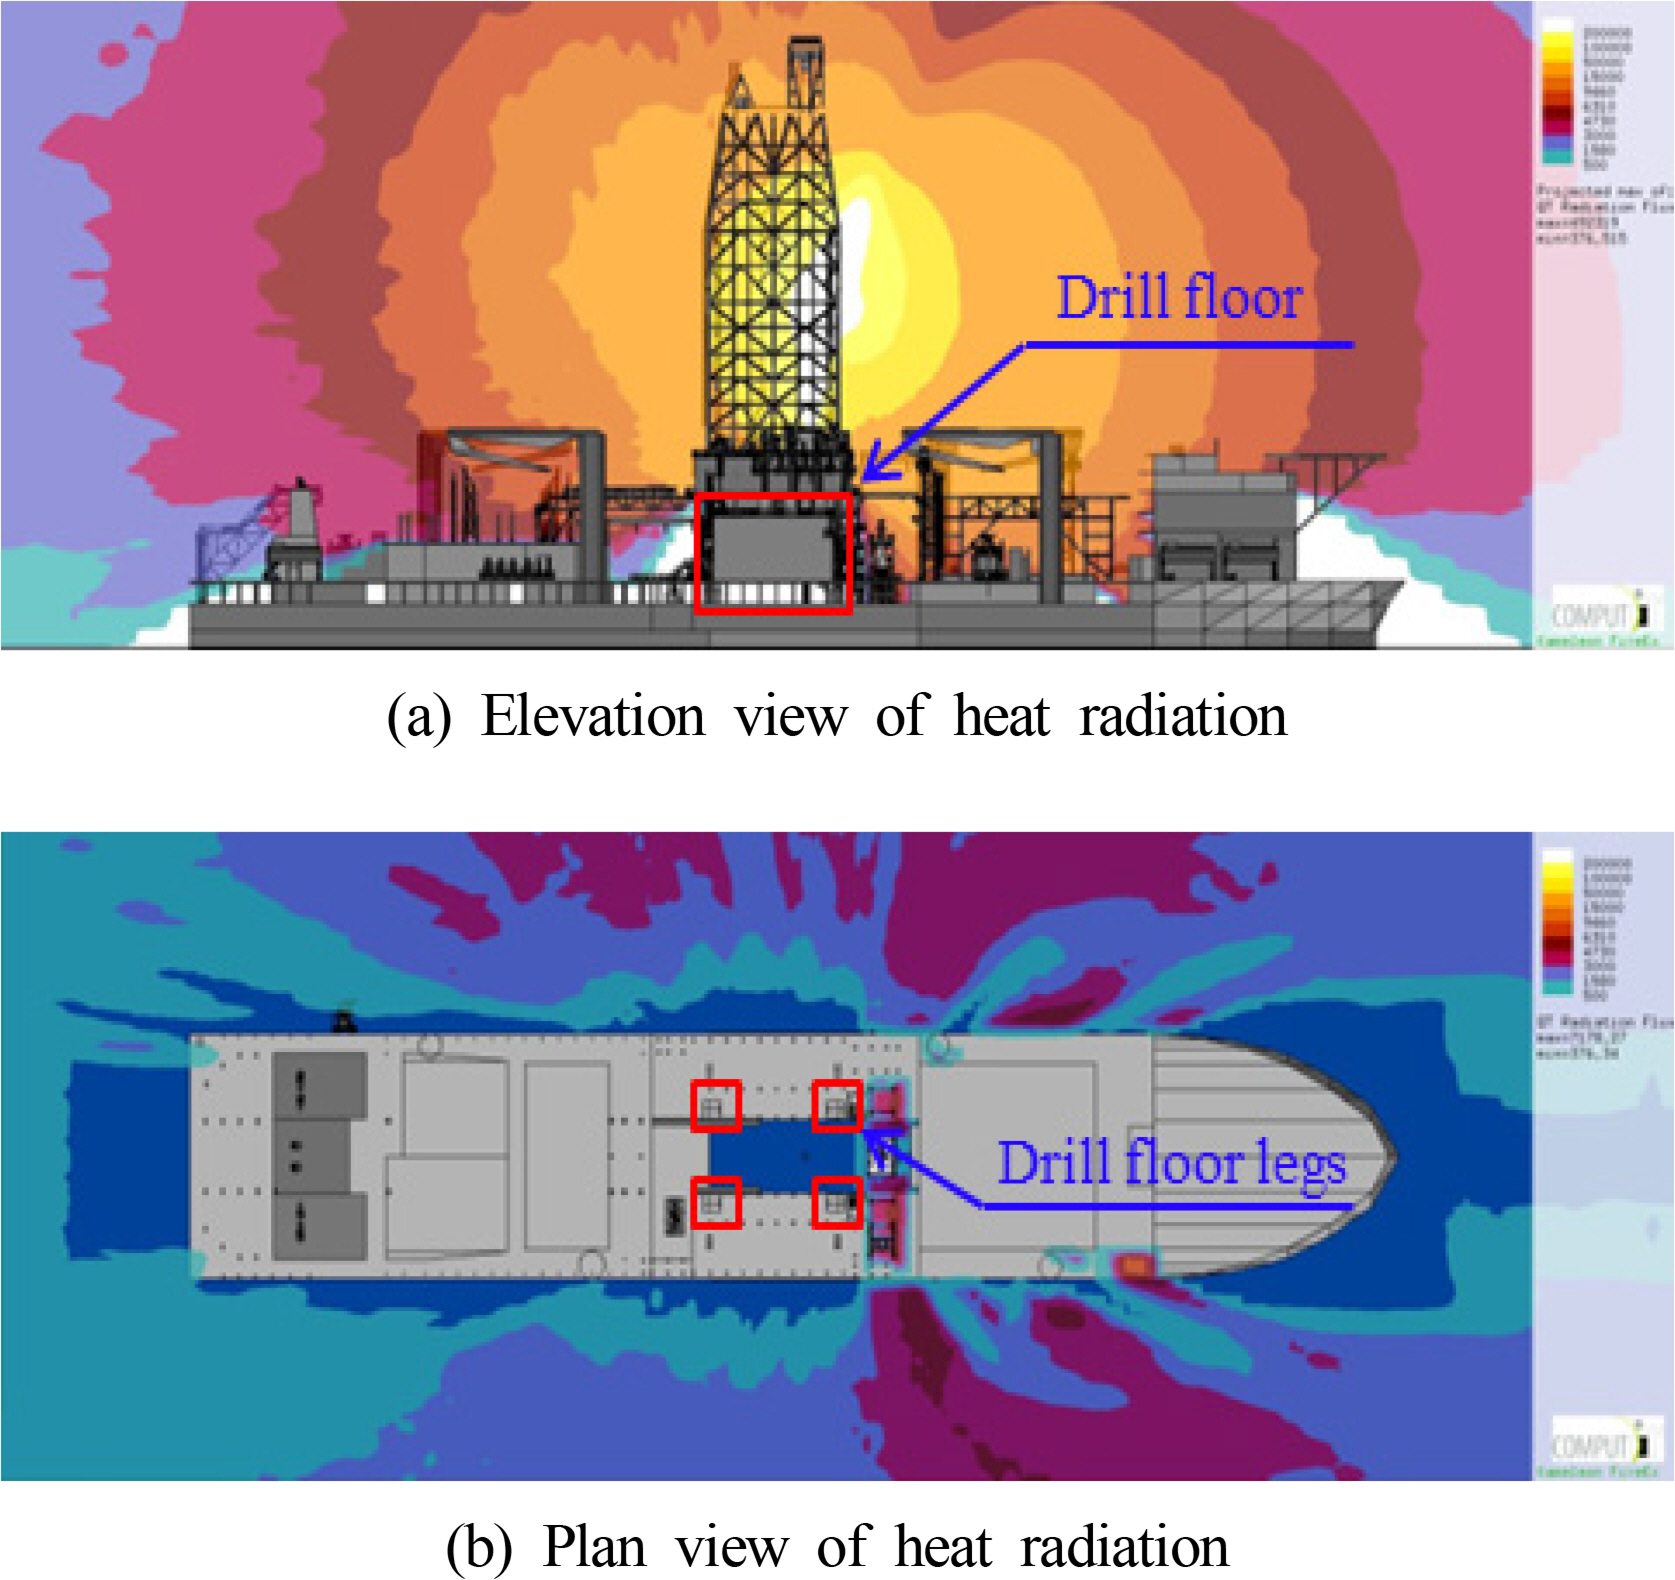
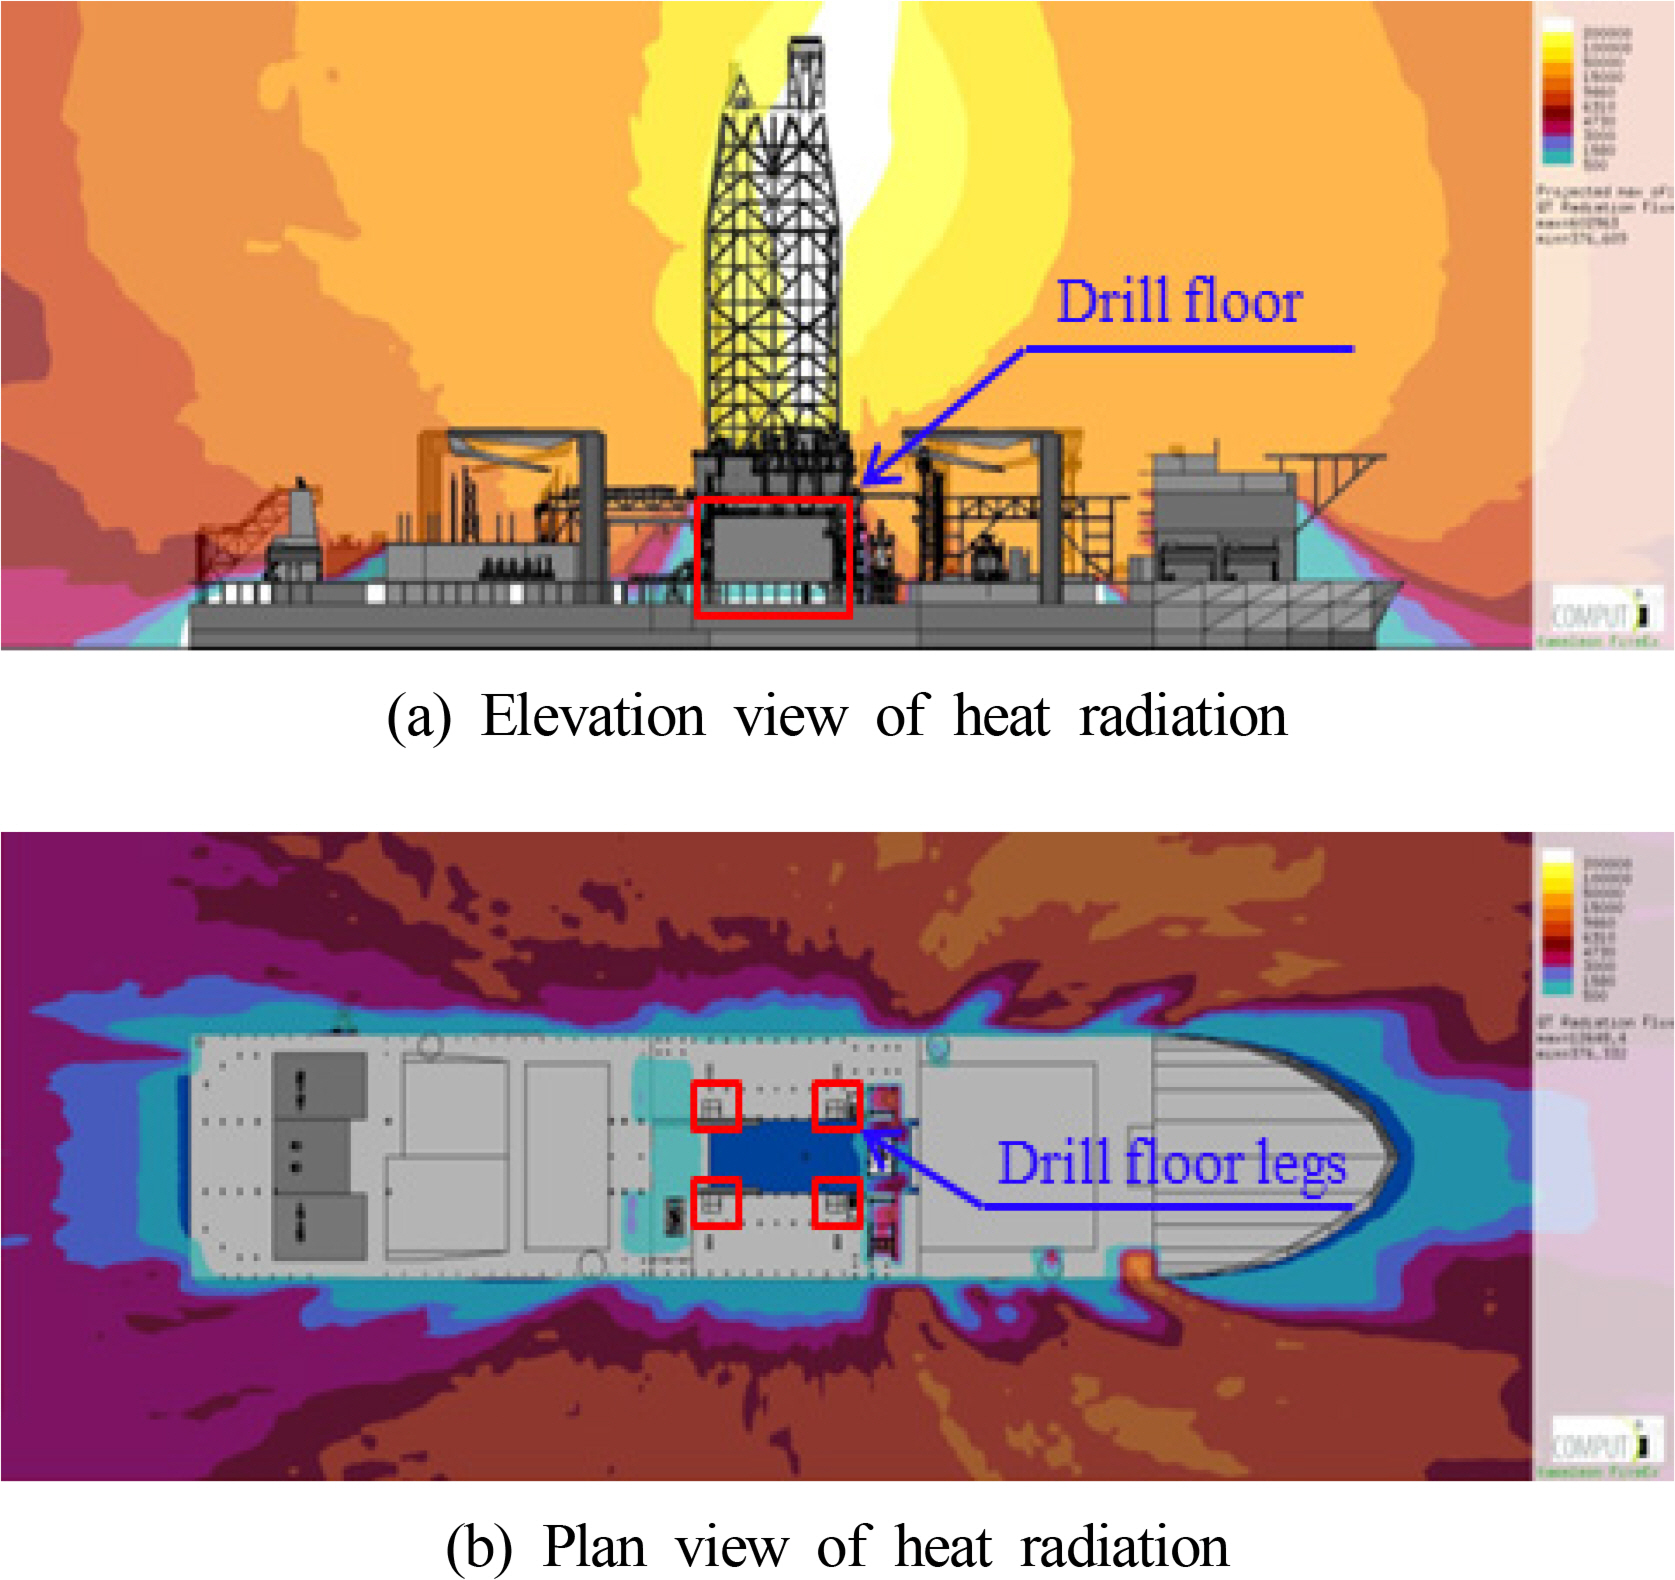
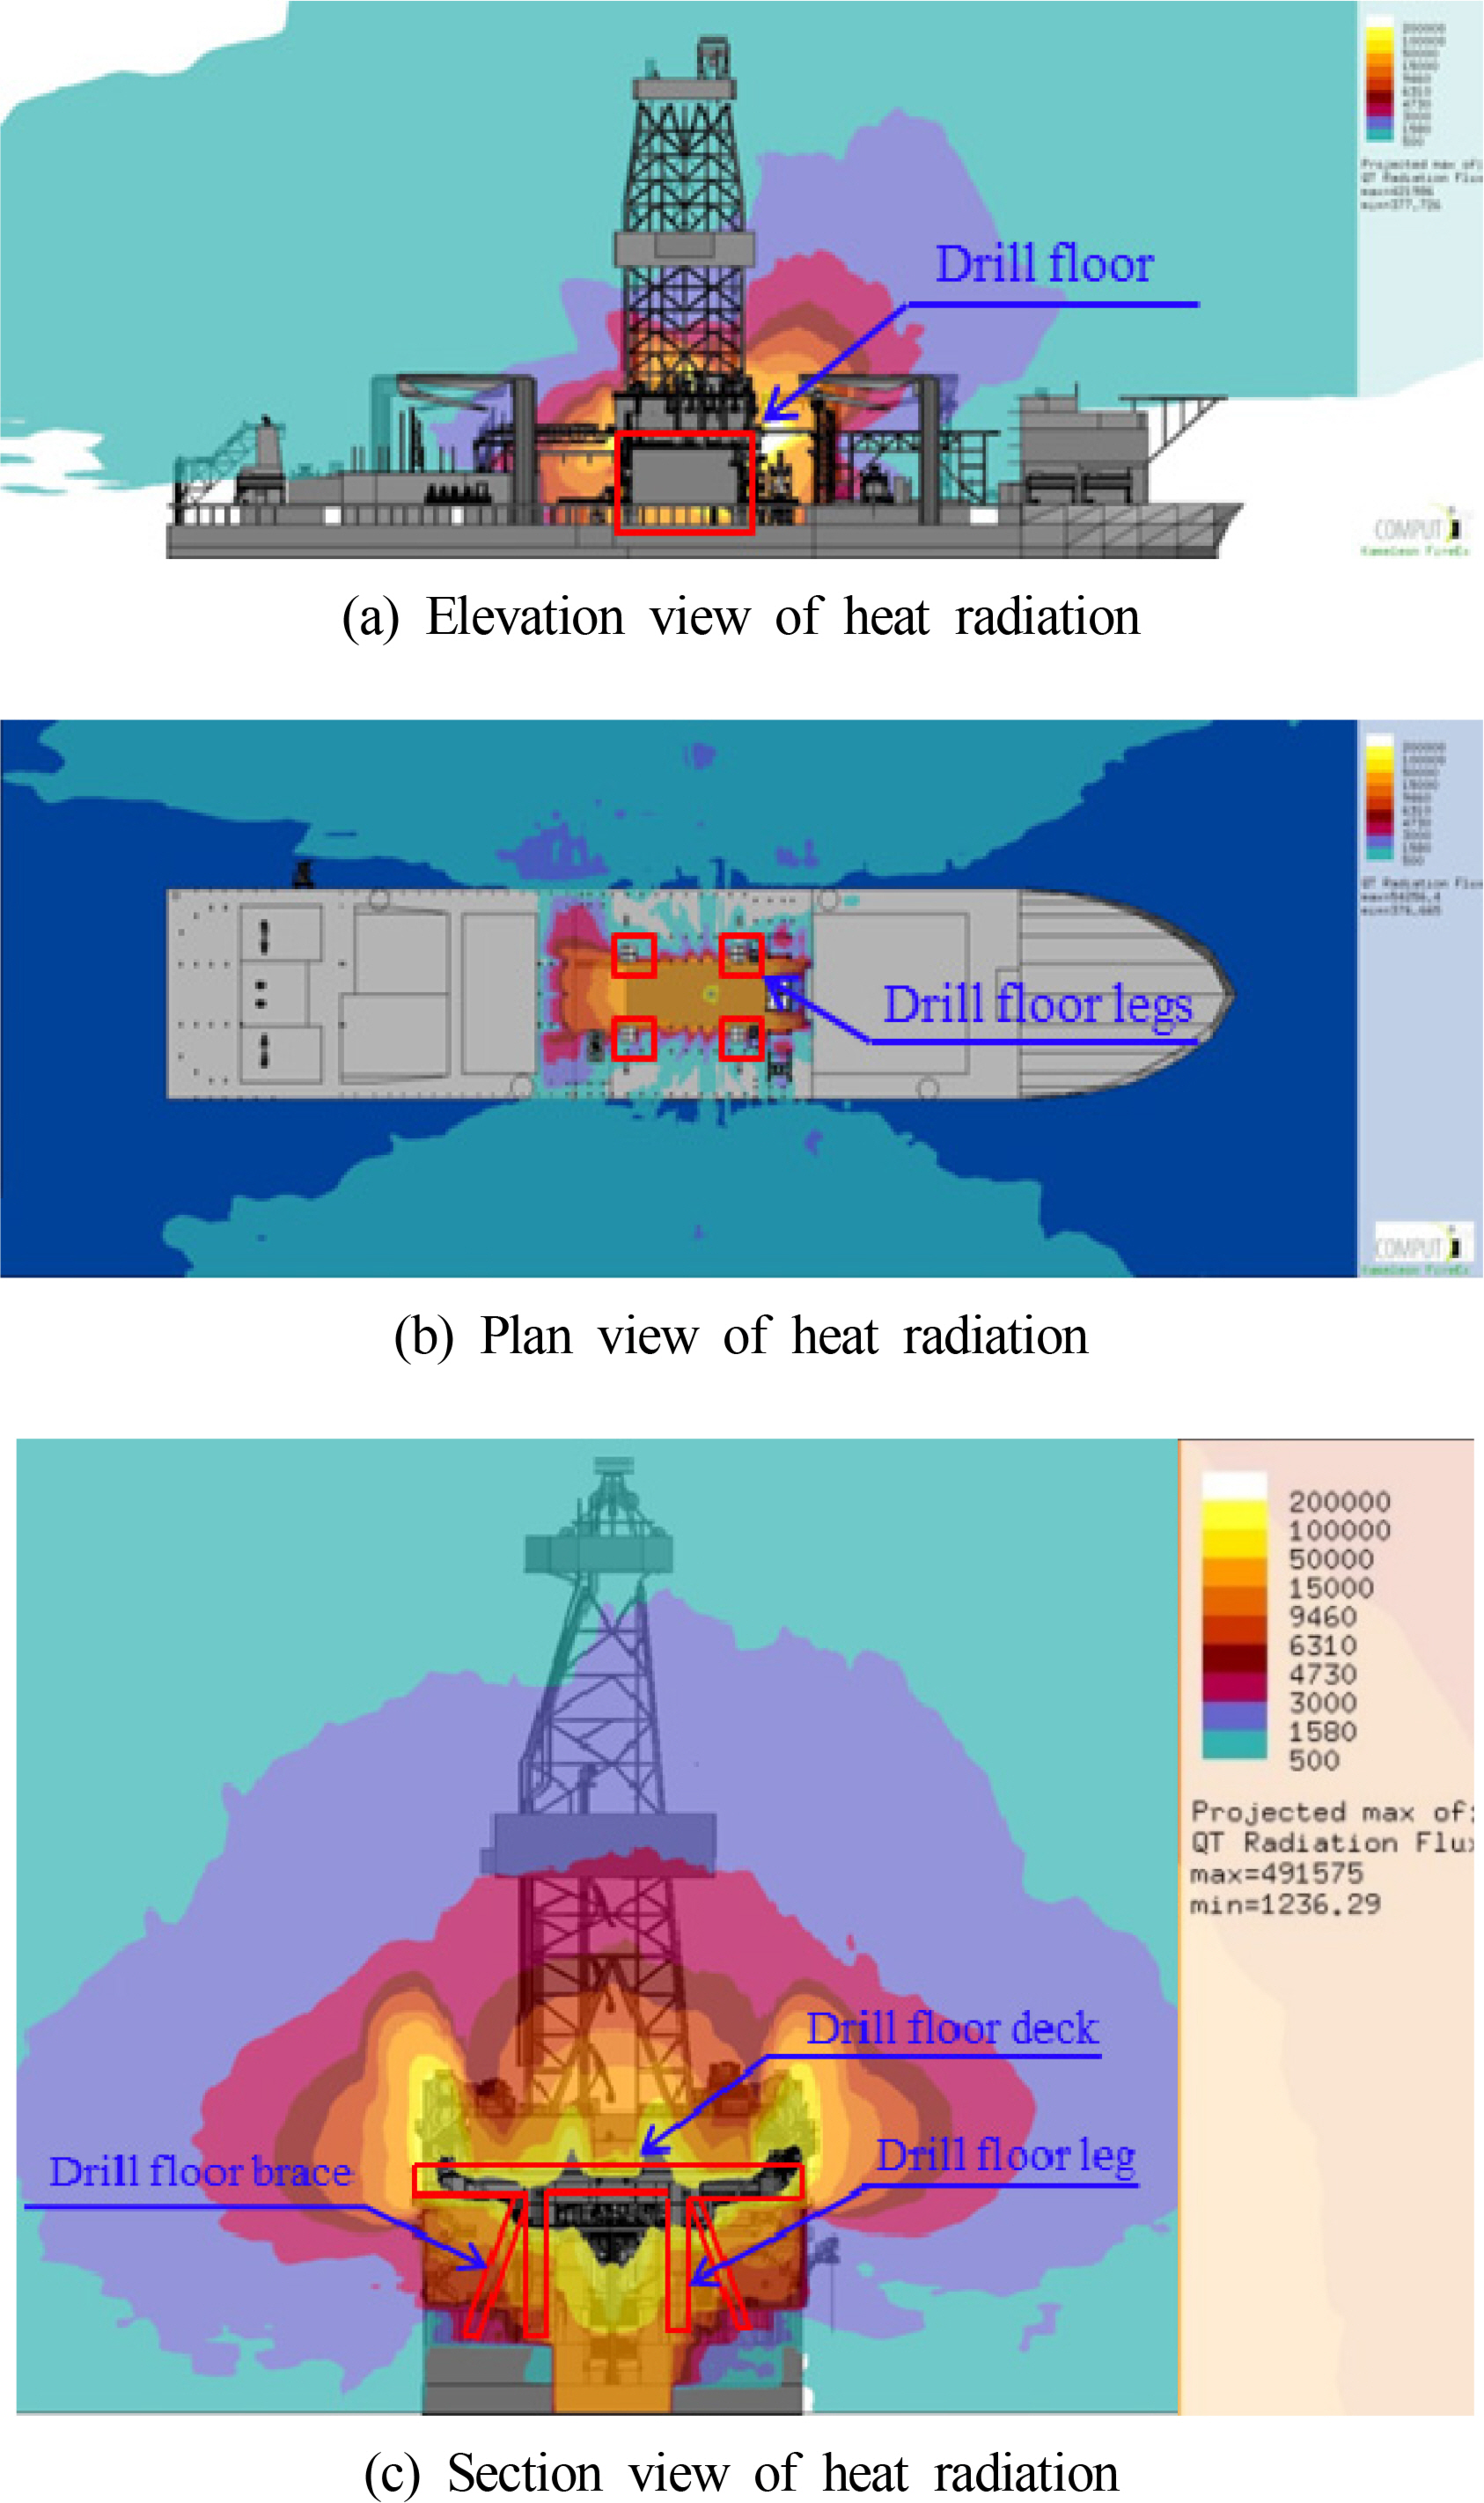
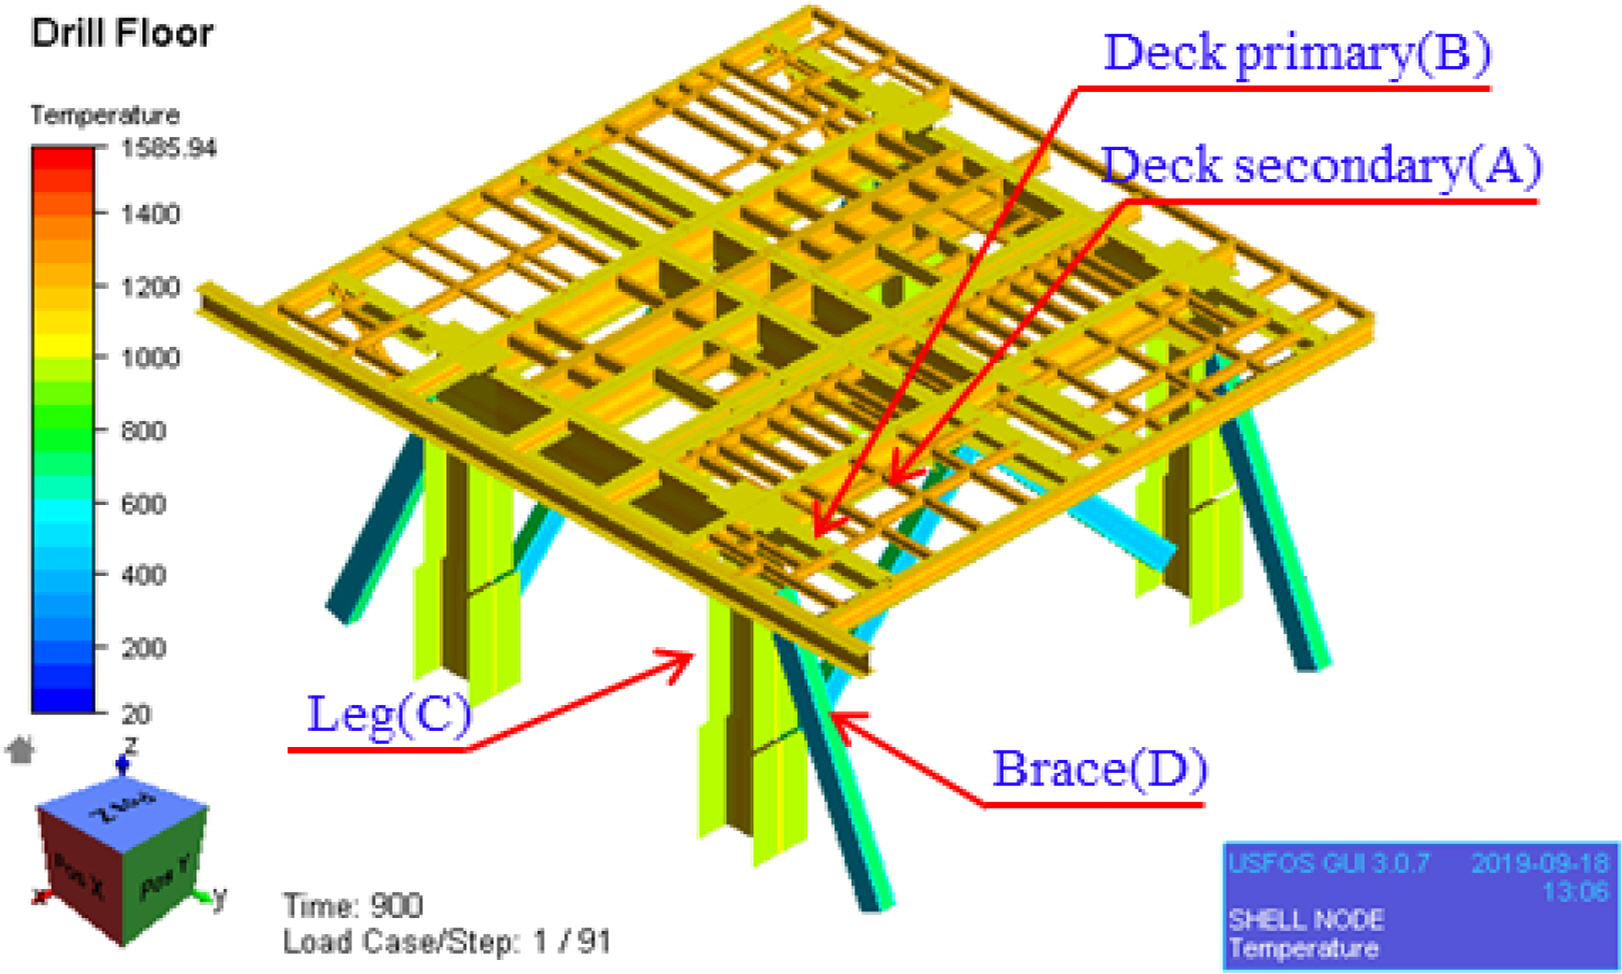
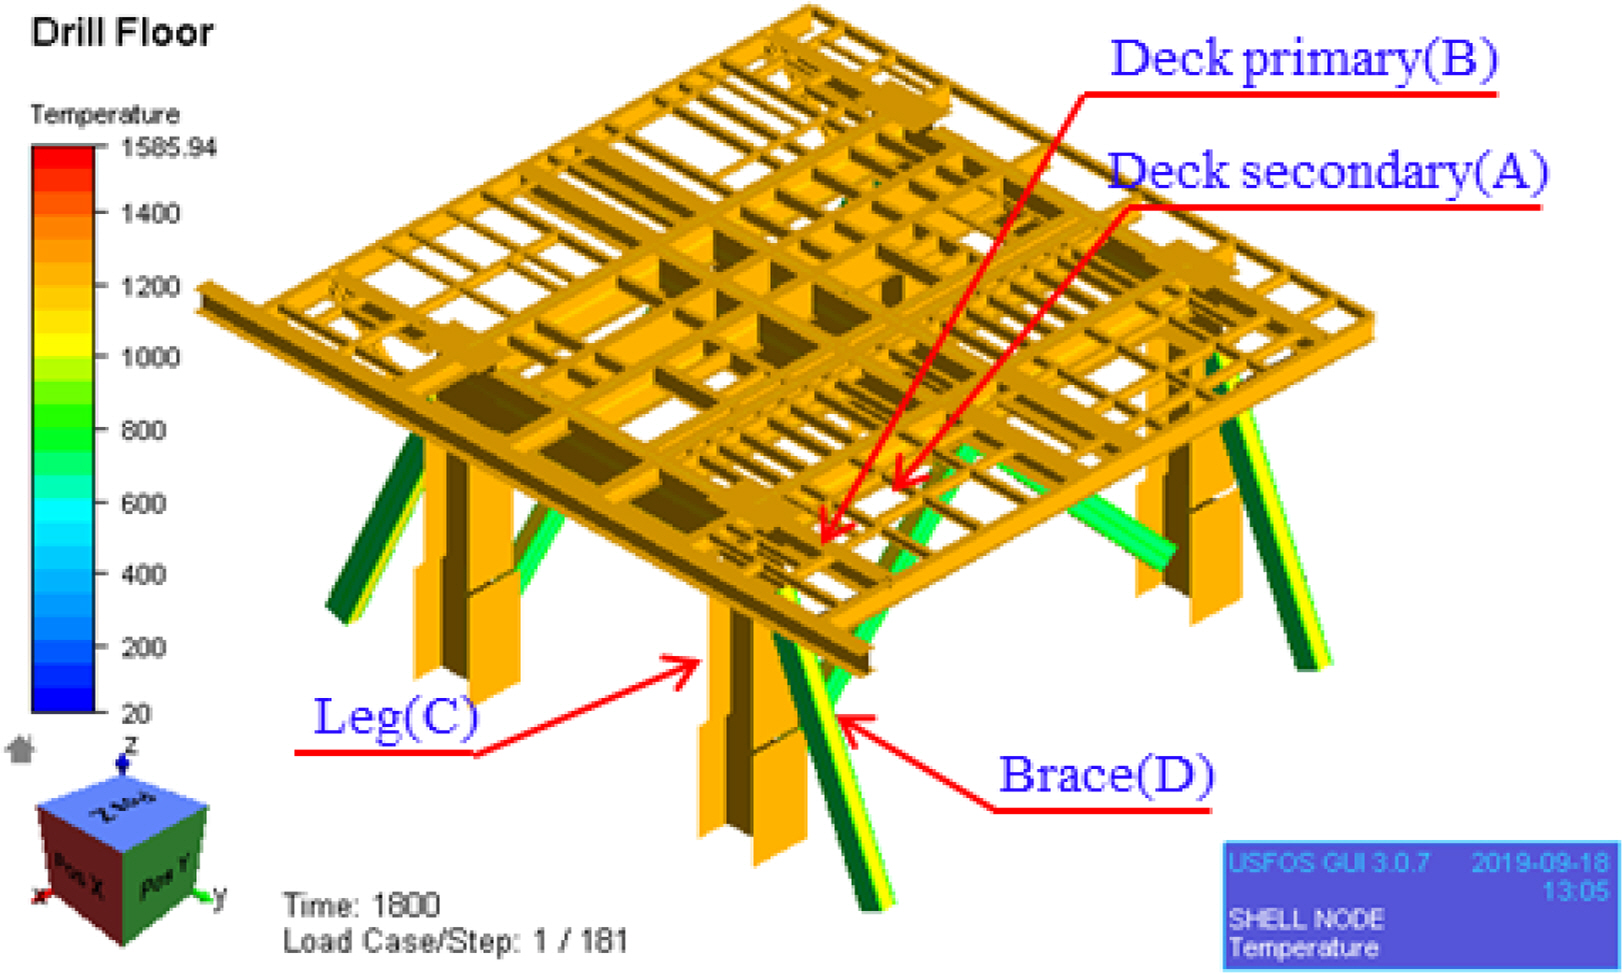
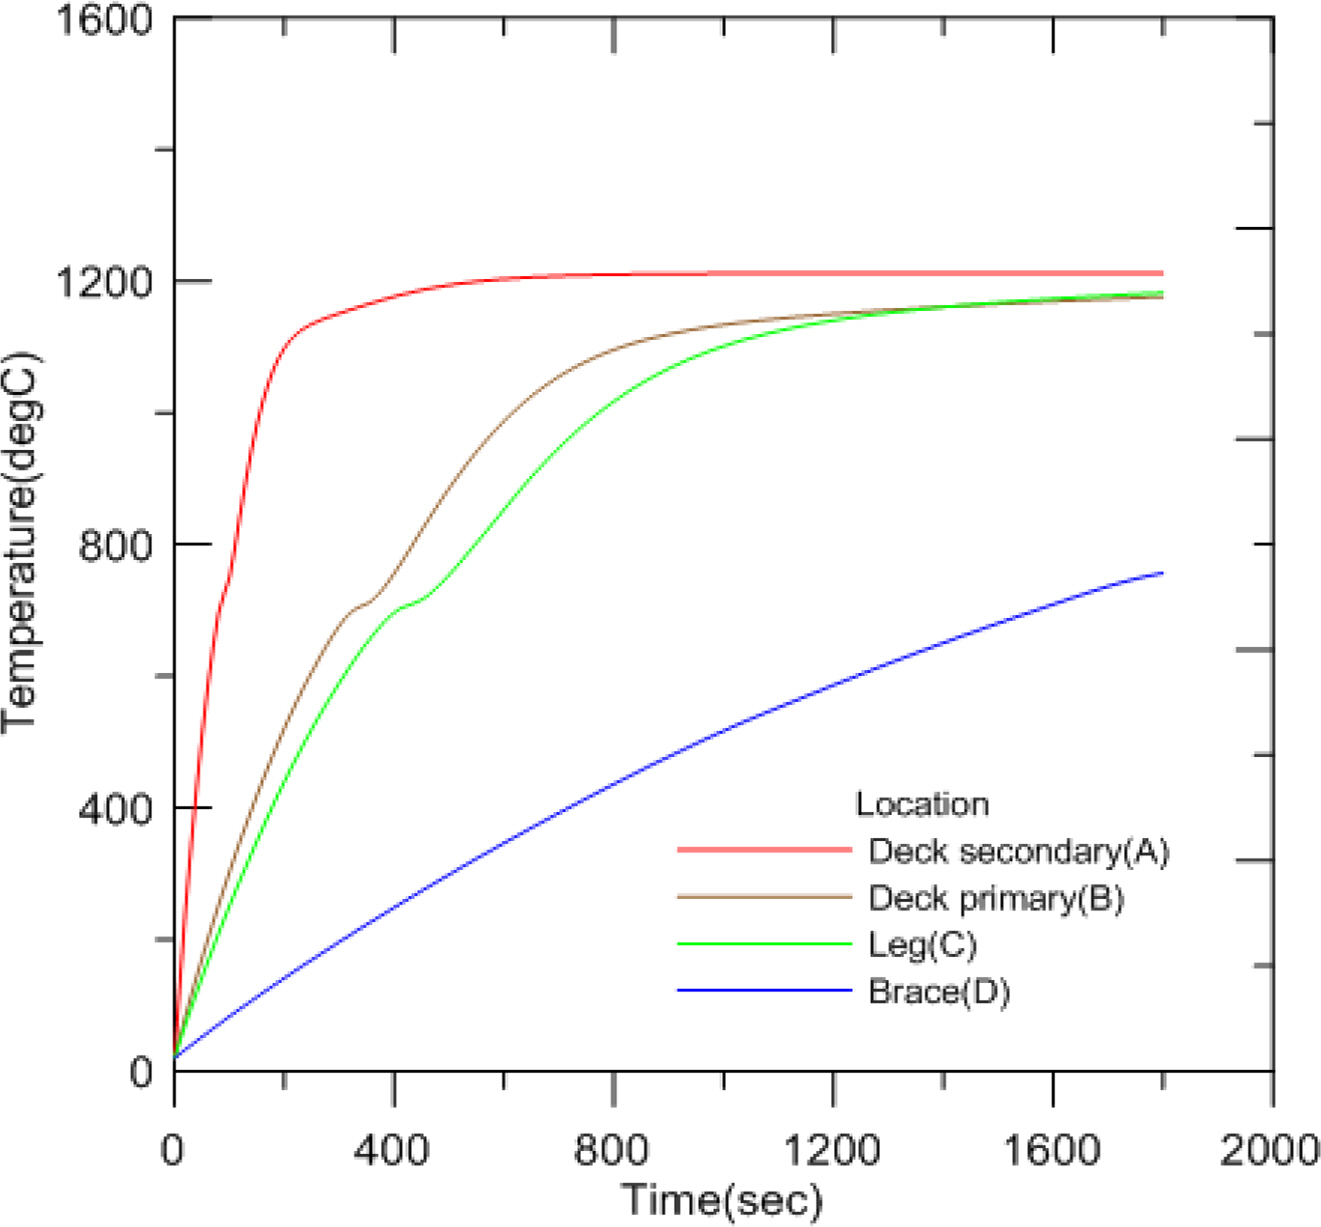
2.4 Analysis results

The results of fire analysis in various scenarios are presented in Figs. 2,9. White represents values over 200 kW/m2 and bright yellow represents 100–200 kW/m2. With a blowout flow rate of 35 kg/s, the heat flux around the drill floor is approximately 100 kW/m2, and at 150 kg/s, it is 200 kW/m2. In case of a drill floor fire, the heat flux values under the drill floor are small as shown in Figs. 2,5. When Fig. 6 and Fig. 8 of scenario No. 5 and 7 were compared, the cases of wind speed 5 m/s and 9 m/s do not show significant difference in terms of the values and range of heat flux. Therefore, in the on drill floor case, the wind speed 9 m/s was not added. Since similar results are expected in the under drill floor case, the values of scenario No. 8 were used for the heat transfer analysis and the subsequent structural behavior analysis.

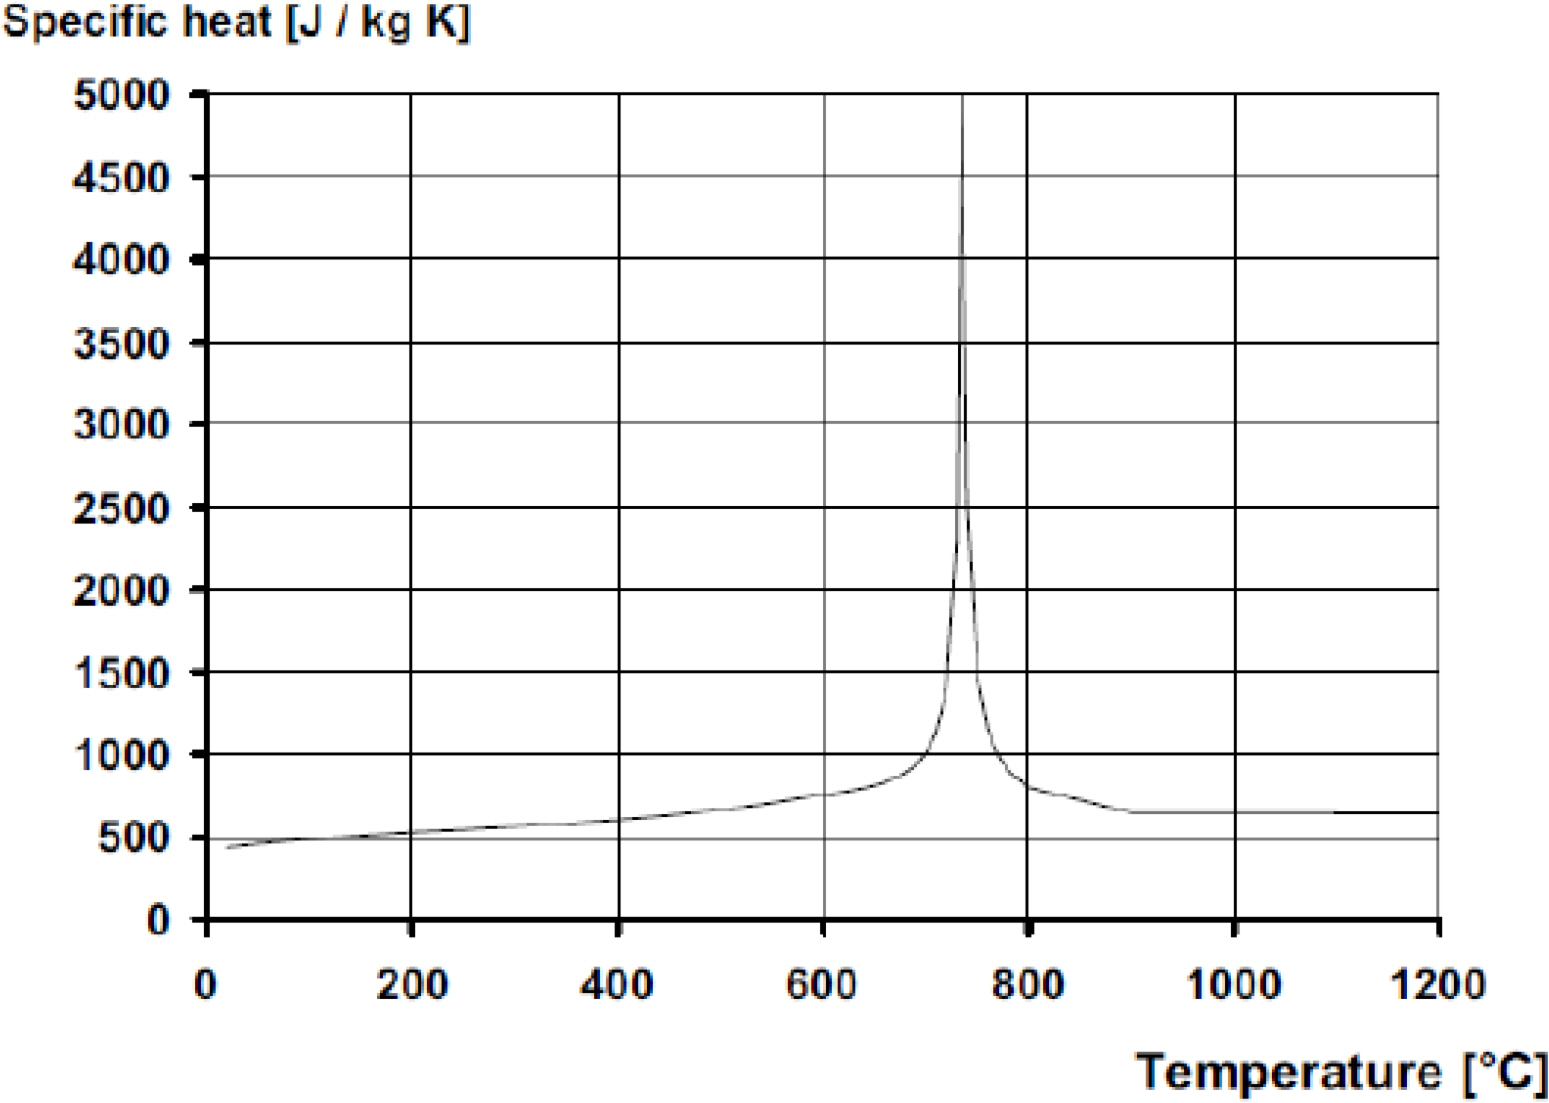
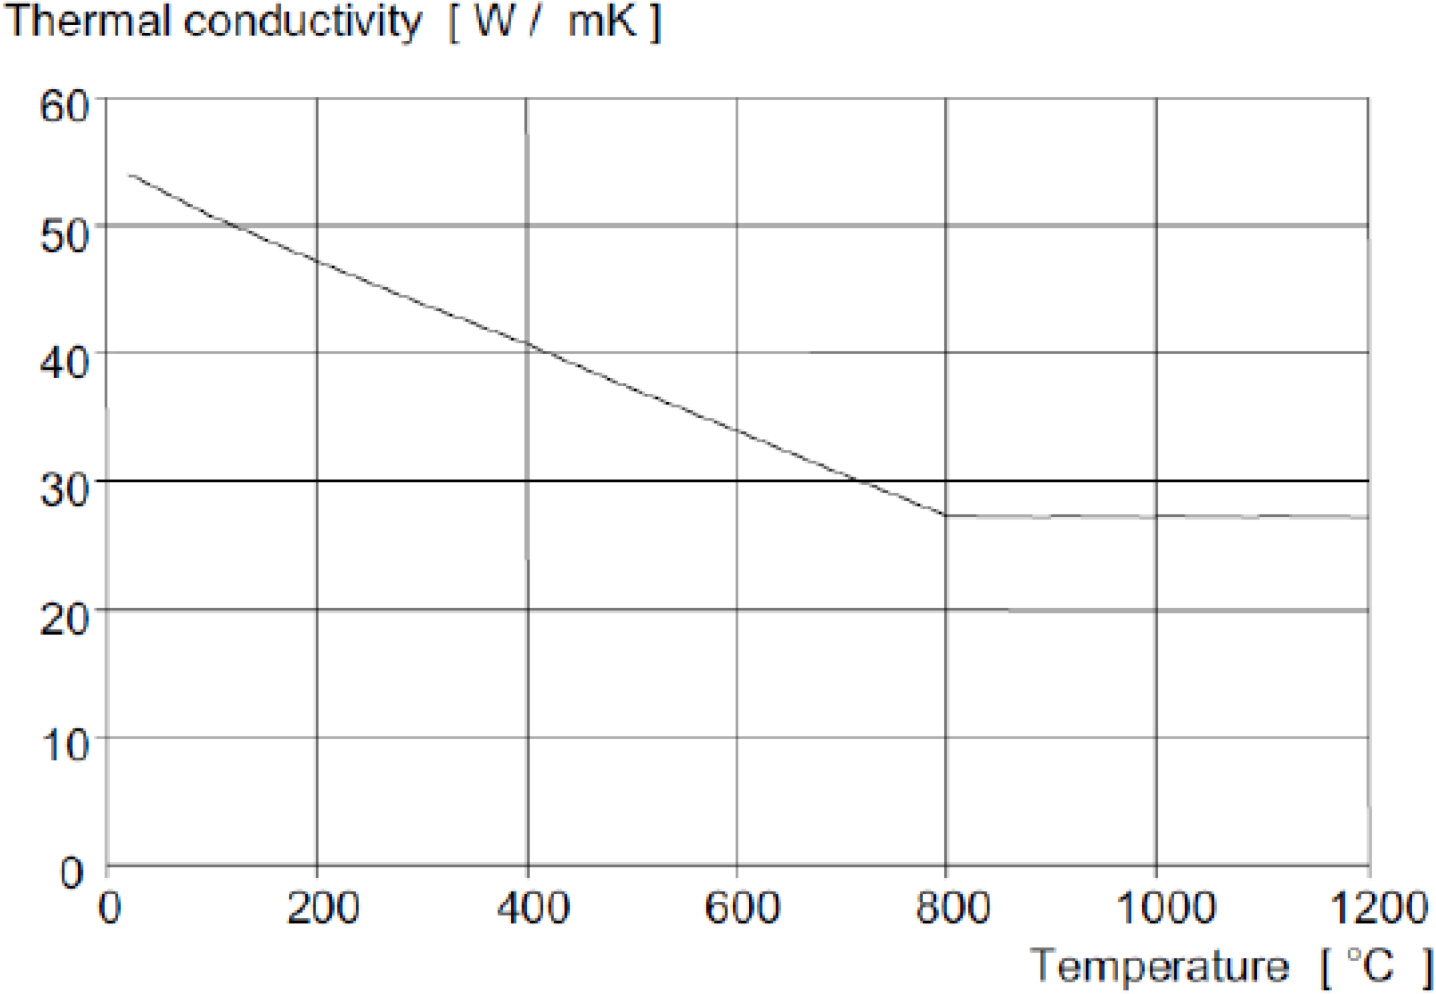
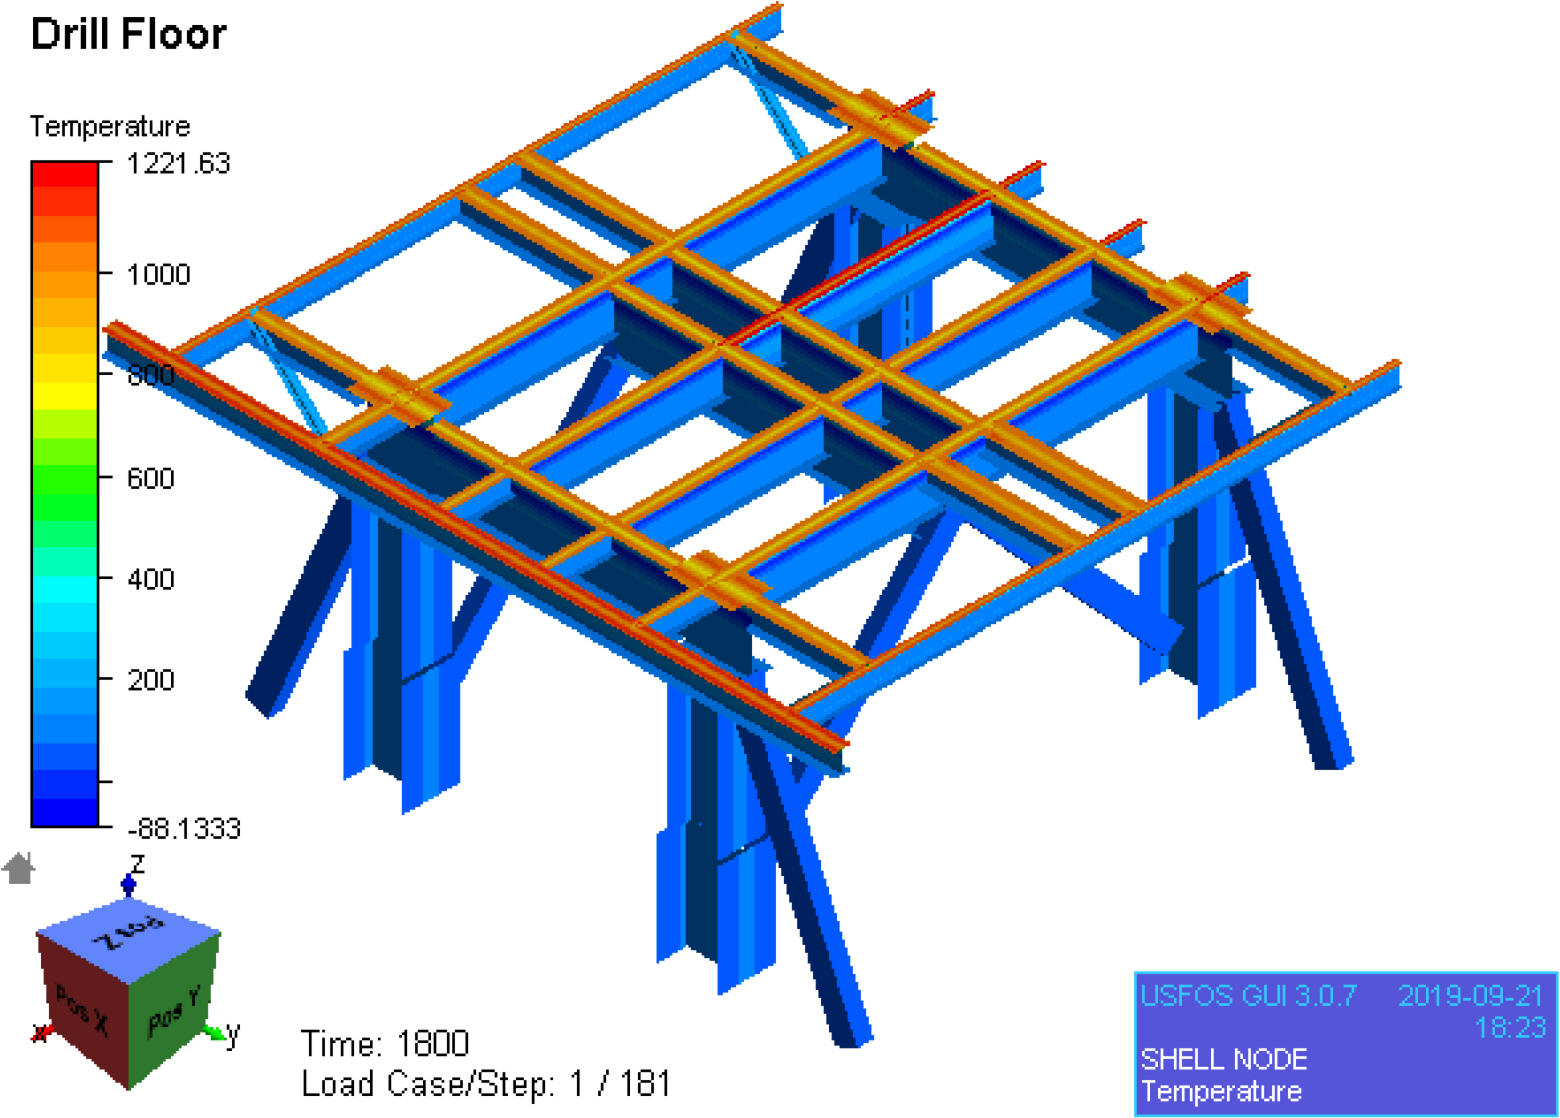
3. Heat Transfer Analysis

3.1 Analysis procedure

Using the heat flux result, the temperature around the drill floor is obtained using Eq. (1), and the FAHTS program (USFOS A/S, 2013a) is used to predict the temperature change over time of the drill floor structure. In Figs. 2,9, the heat flux on the drill floor area was estimated at 200 kW/m2, and applied in the analysis.
(1)
Q=εσ(Tg4Ts4)
Where, Q is the radiative heat flux, ε is the emissivity, σ is Stefan-Boltzmann constant, Tg is gas temperature, and Ts is the surface temperature of the structure.

3.2 Thermal properties of the model

The nominal thermal properties are given in Table 2 (API, 2006)
The thermal properties of steel vary with temperature. Figs. 10 and 11 show the specific heat and conductivity of carbon steel as a function of temperature, as presented in Eurocode 3 (BSI, 2005). These values were used in this study to reflect the temperature-specific characteristics of the steel.

3.3 Analysis results

The fire of the drill floor by blowout was simulated for 1,800 s and the results presented. Figs. 12 and 13 are the temperature distribution results of the drill floor structure after 900 and 1,800 s, respectively. Fig. 14 shows the temperature distribution over time at each point of the drill floor structure.
As shown in Fig. 14, the thinner the drill floor structure, the faster the temperature rises. The reason that the temperature rise is slower in the brace than in the beam structure member is that the brace is in a box structure and there is no heat transfer on one side.

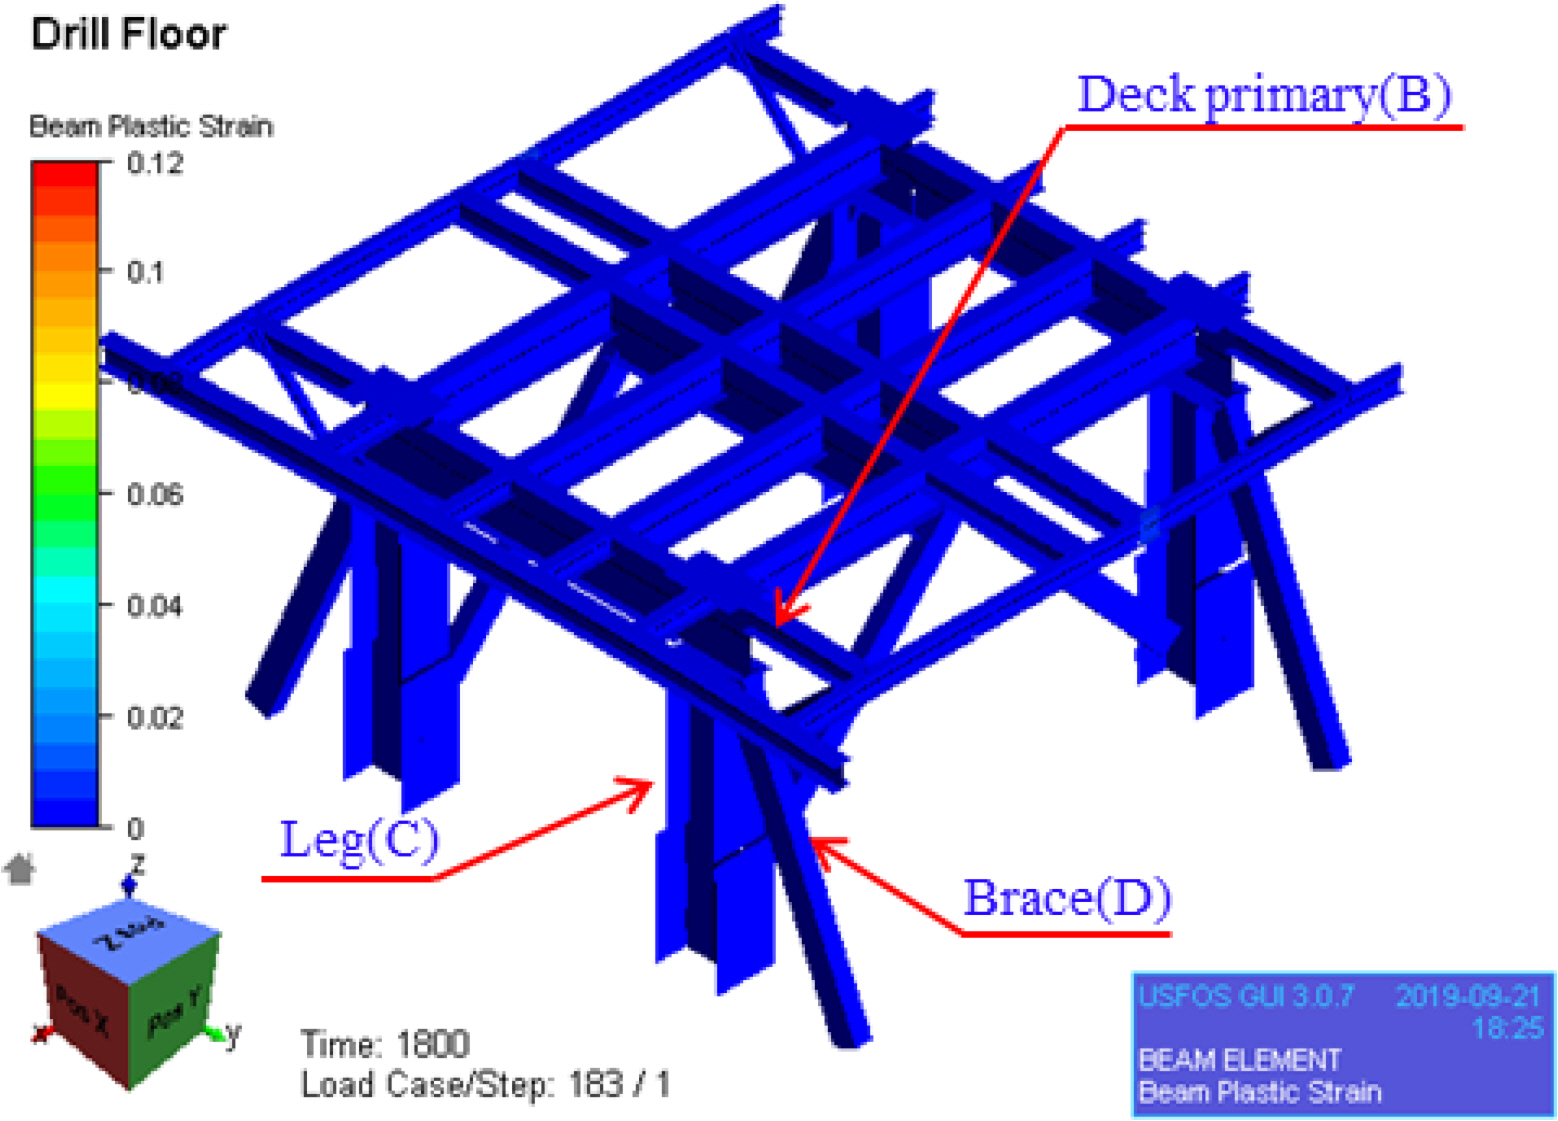
4. Nonlinear structural response analysis

4.1 Analysis procedure

Structural response analysis following blowout comprises performing thermal stress analysis of the heat flux distribution using the USFOS program (USFOS A/S, 2013b) based on the temperature distribution over time of the drill floor by Eq. (1). At this time, a reduction factor is applied for the yield stress and elastic modulus of the carbon steel with the temperature elevation. The critical strain at which the design limit occurs is determined, and the change in the strain is examined over time.

4.2 Model Properties

The yield stress and elastic modulus of the carbon steel reduce as temperature changes, and the reduction factors presented by Eurocode 3 are shown in Table 3 and Fig. 15. These values were applied to the analysis in this study.

4.3 Design Criteria

In the structural analysis, the critical strain of carbon steel at which fracture develops is in accordance with DNV-RP-C208 (DNV, 2013), and is shown in Table 4. Since most recent drillships use high tensile carbon steel, S355 was used as the standard.

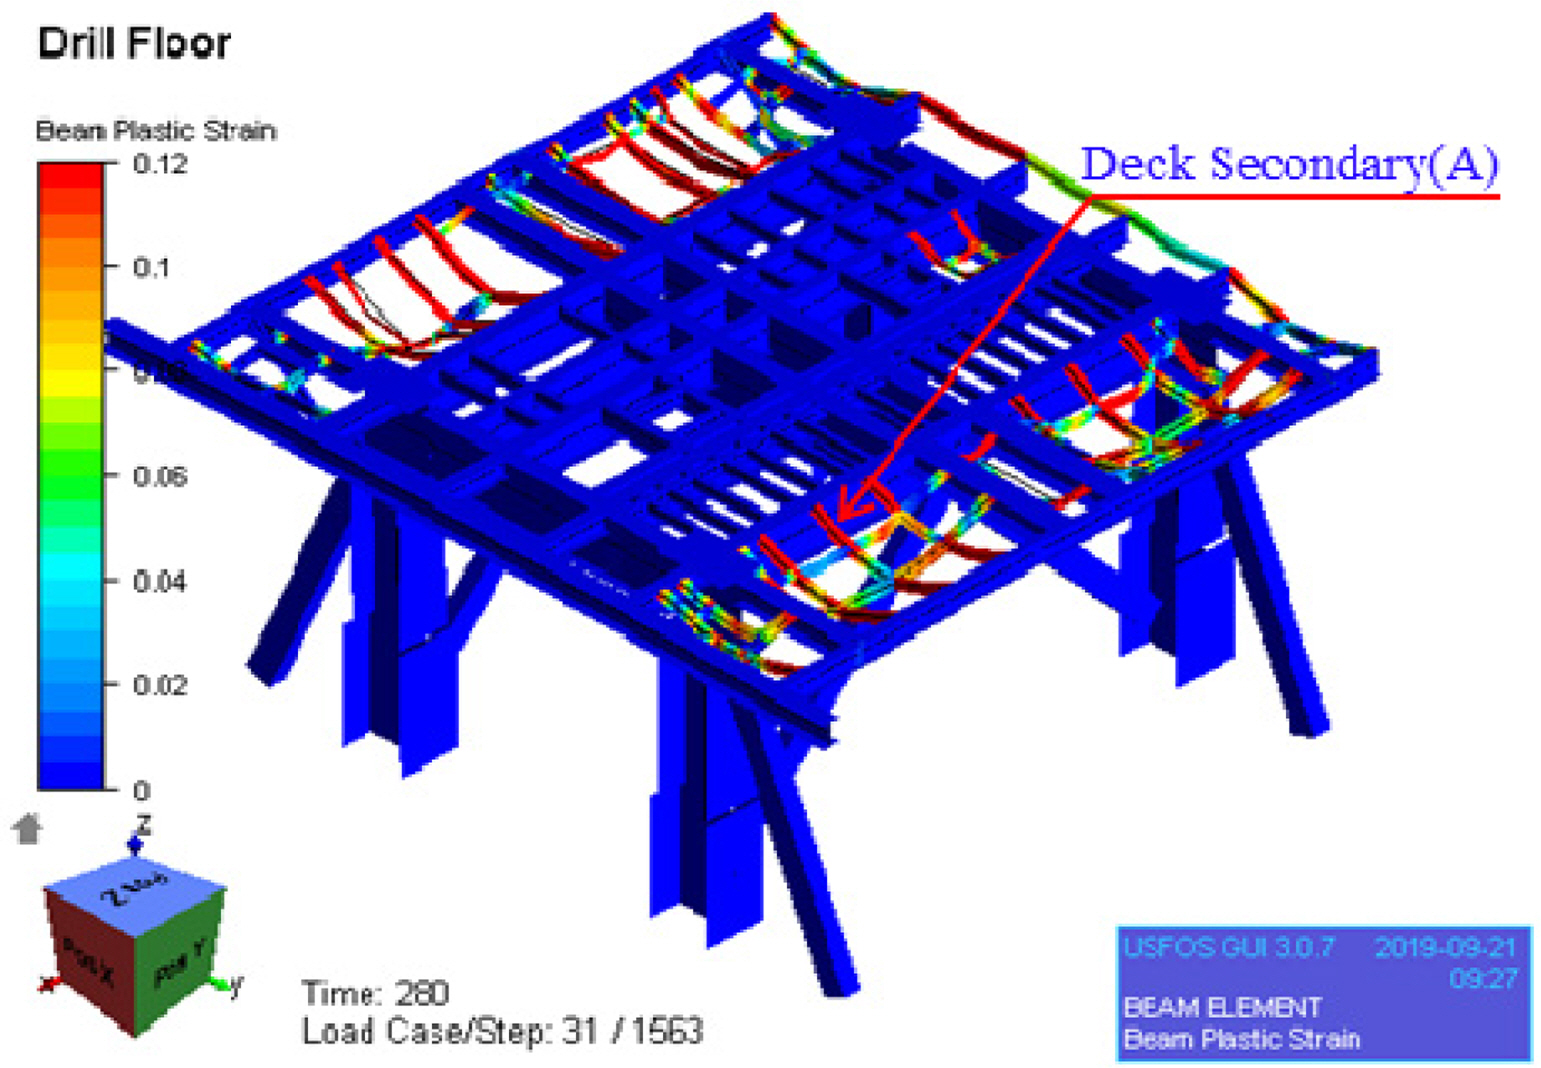
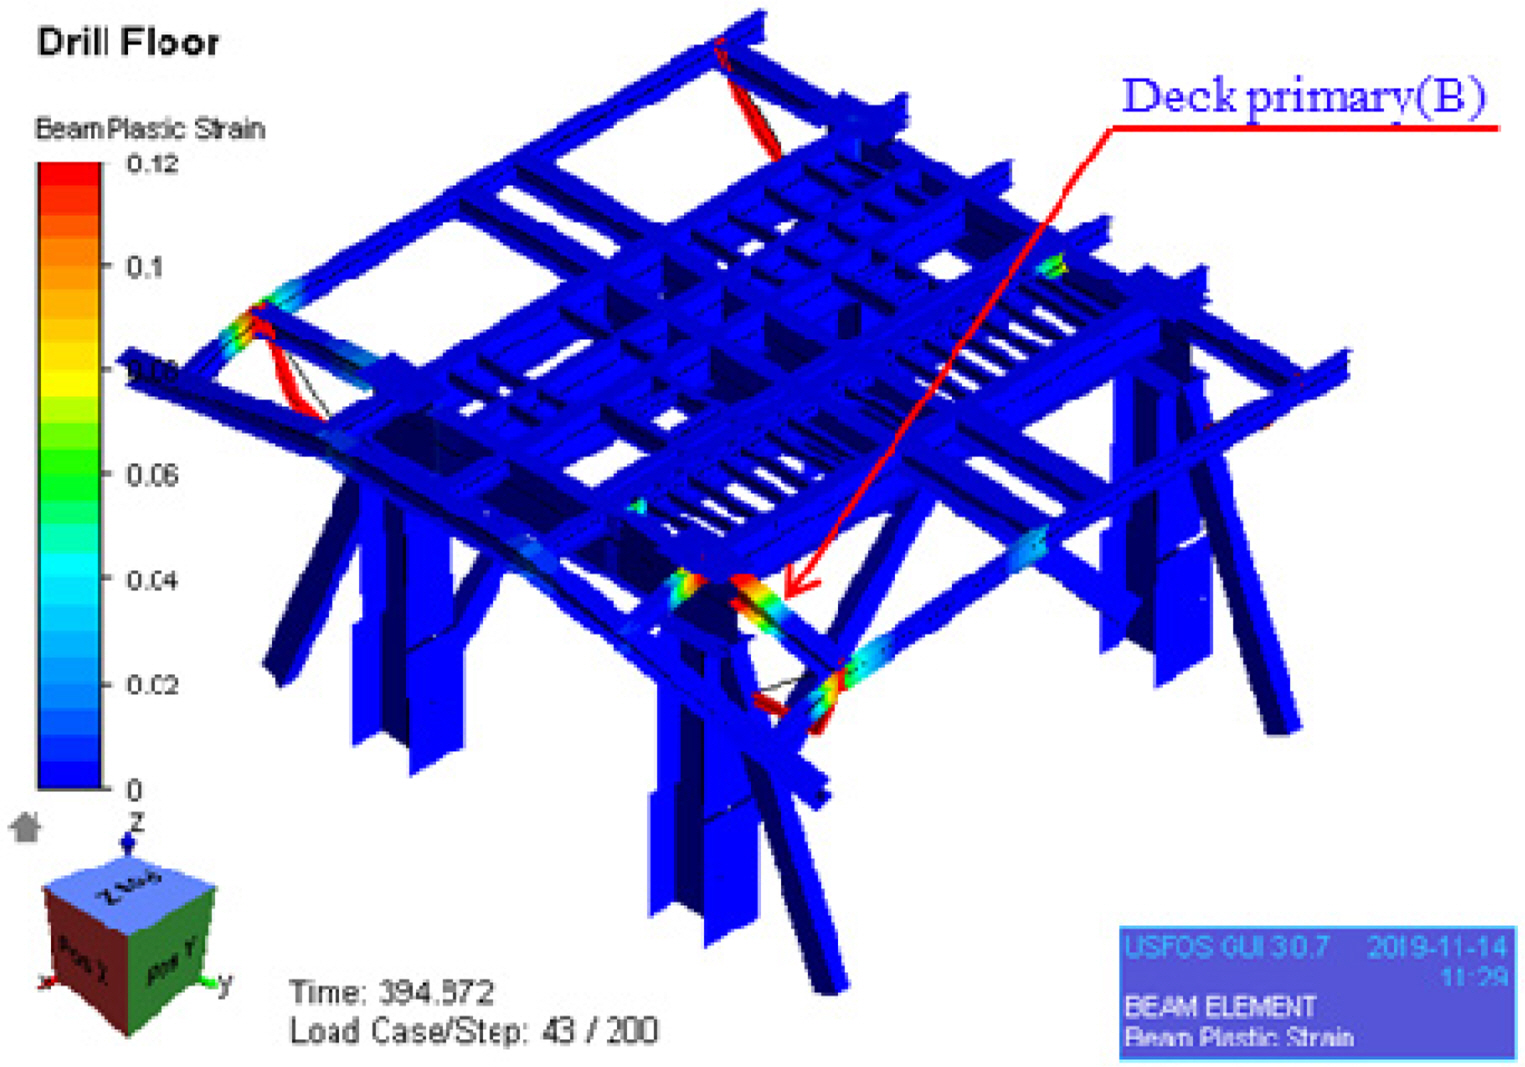
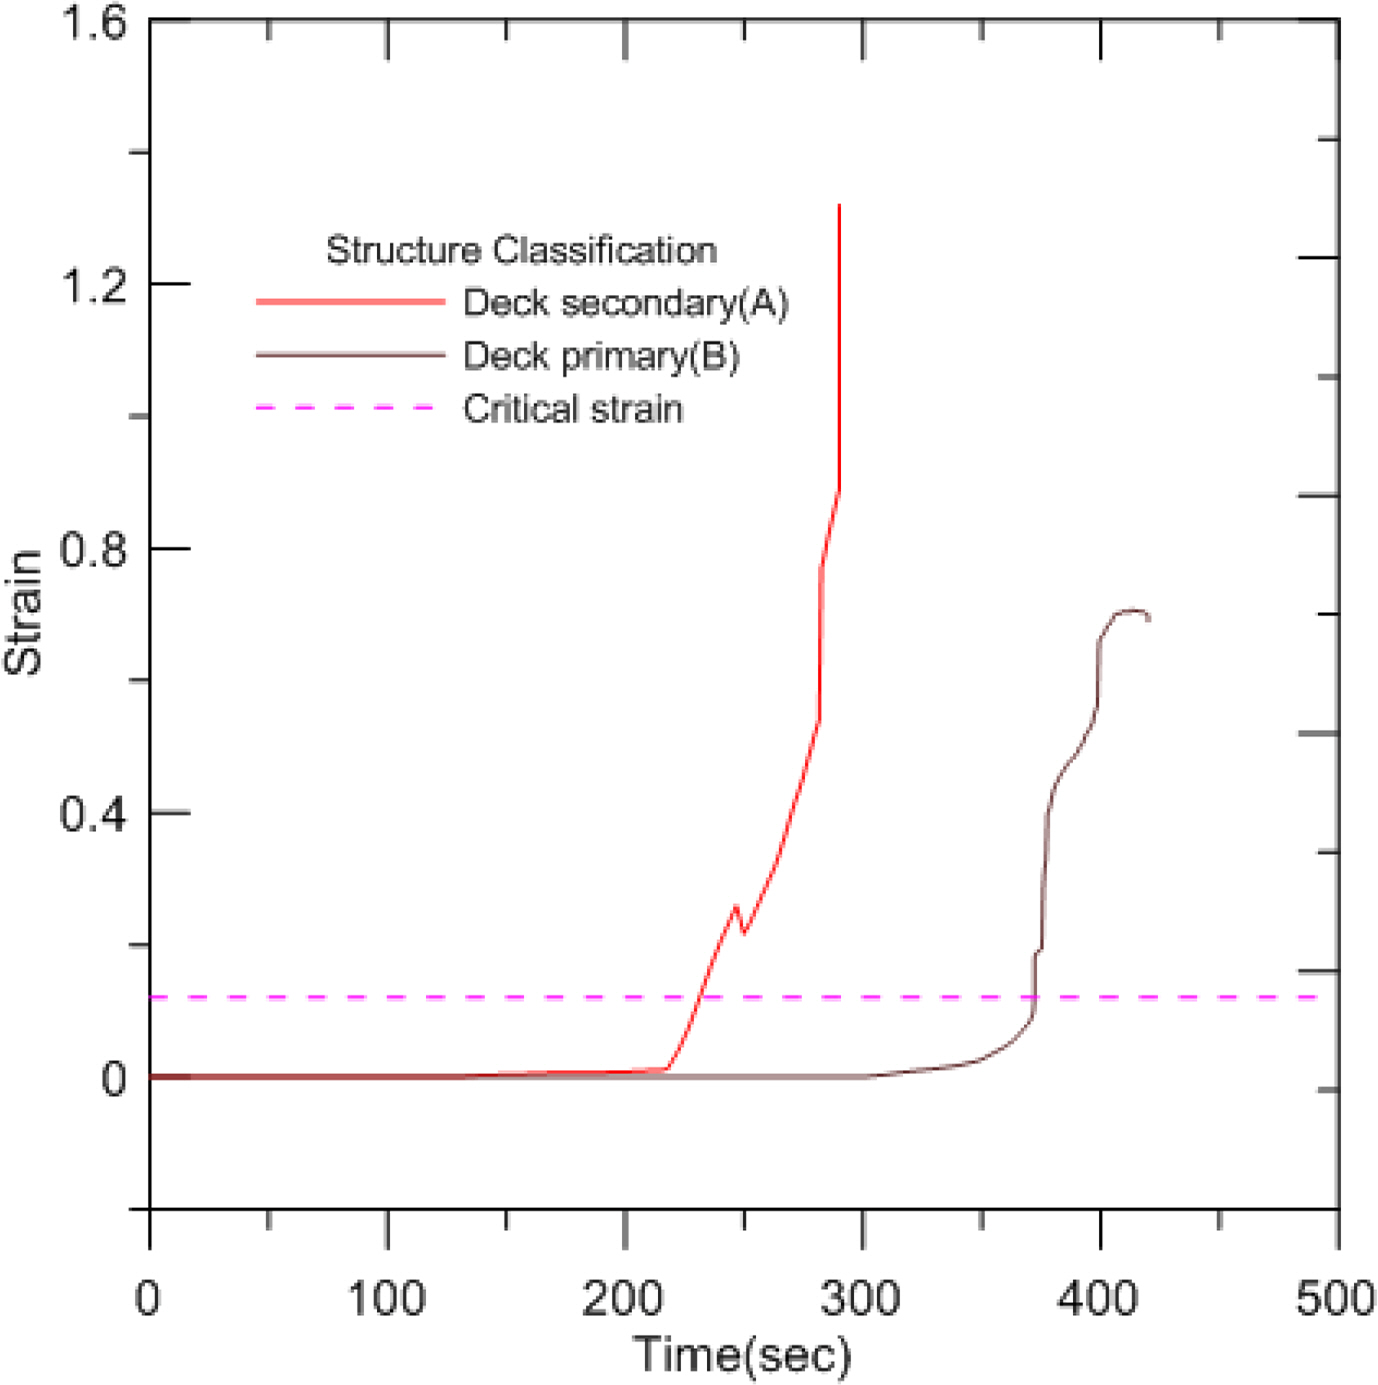
4.4 Structural analysis results

Following heat transfer analysis of the drill floor structure over time, the strain representing the structural integrity is shown in Figs. 16,18. Secondary beams supporting the path taken by the crew or small equipment reach critical strain before 300 s (5 min) elapse, and deck primary members supporting the main equipment and drill floor structure reach critical strain soon after secondary members. As in the Deepwater Horizon accident, the drill floor collapses shortly after the fire subsequent to the blowout.

5. Application of passive fire protection

The result of the structural analysis of heat transfer during blowout of the drill floor shows that the drill floor was exposed to structural risk for a short duration, which is a threat to the structural integrity of the drillship. Therefore, measures to maintain the structure against fire are required. Epoxy-based paint applied to the surface of the structure is a general measure of passive fire protection (PFP), and research on the effect of the application has been conducted (Ahmad, et al., 2013; Friebe et al., 2014; Kim et al., 2013). However, since PFP application should take time and cost efficiency into account, this study examined the structural stability and efficiency from the PFP application.

5.1 Analysis procedure

In the heat transfer analysis, the structural members that PFP is applied to, exhibited PFP characteristics. In the Amdahl model, the effective heat transfer coefficient is presented at below 5 W/m2K (Amdahl et al., 2003), and 3 W/m2K was used in this study. Since PFP cannot be applied to the upper part of the drill floor deck, as it is a work space, PFP characteristics are applied to the side and lower parts of the member.

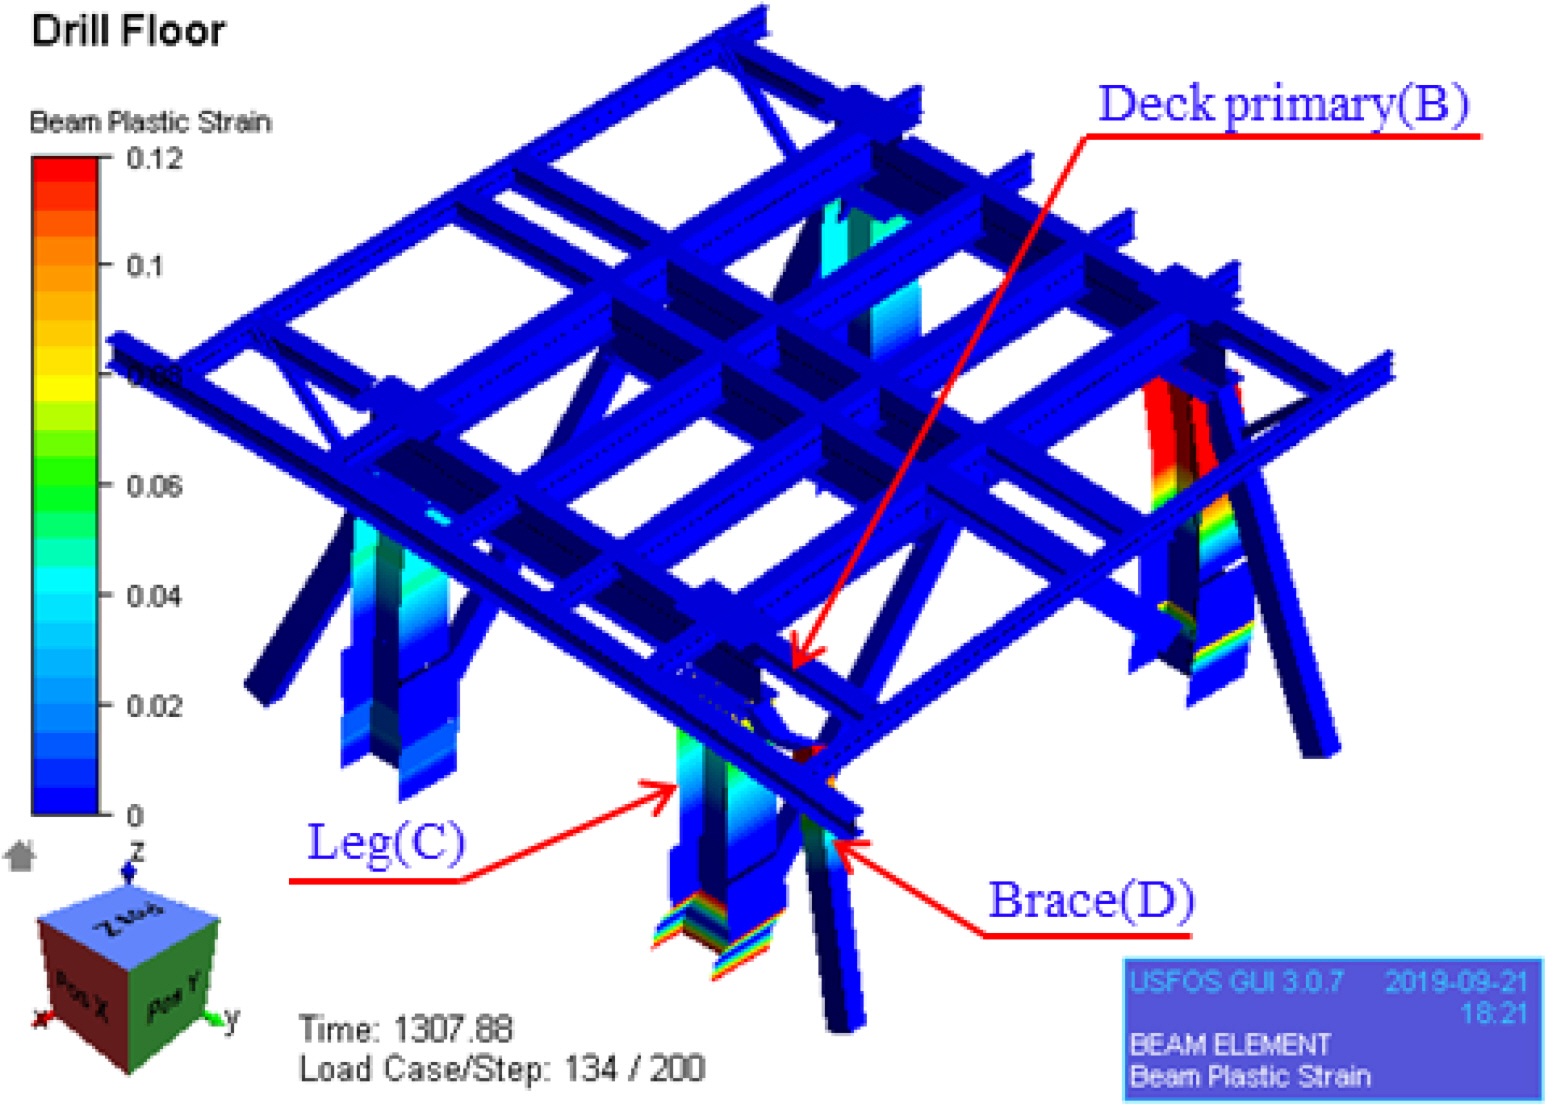
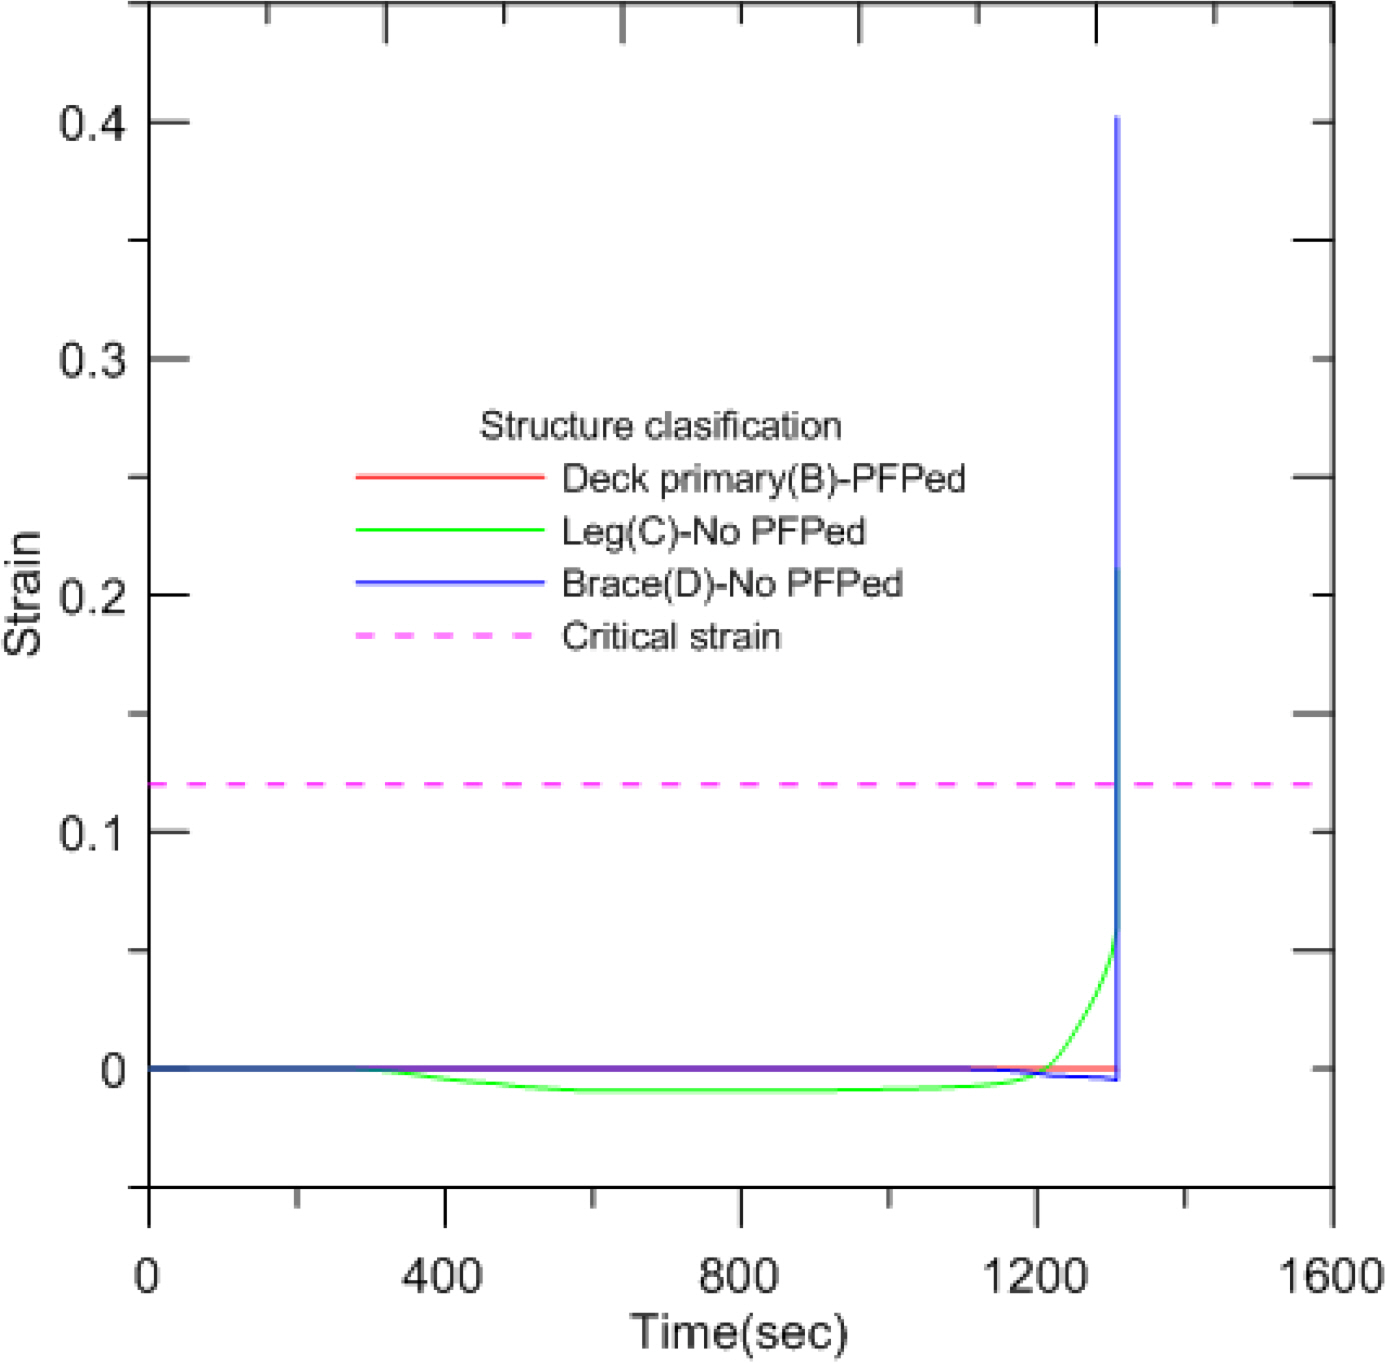
5.2 Result of structural analysis

To satisfy the structural stability of the drill floor and reduce the cost of the PFP application, the results of the structural analysis with minimal PFP application are shown.

5.2.1 Application of PFP on Deck

The results of the heat transfer analysis of the deck area are shown in Figs. 19,21. The temperature of the upper deck, leg, and brace without PFP application increased to 800 °C over 30 min. As seen in the structural thermal stress analysis, critical strain was reached in the leg and the brace after 20 min. From the results, it can be seen that it is necessary to apply PFP not only to the deck but also to the legs and braces for the structural stability of the drill floor.

5.2.2 Application of PFP on Deck, Leg, and Brace

Heat transfer analysis of PFP applied to the deck, legs, and braces show that the temperature is maintained below 400 °C except for the upper part of deck, as shown in Figs. 22,24. Structural thermal stress analysis results show structurally stable strain values after 30 min.

6. Conclusion

This study describes the temperature distribution and behavior of the drill floor structure due to heat transfer from a fire subsequent to general blowout in a drillship. An appropriate PFP application area was proposed to achieve structural stability.
  1. The behavior of the drill floor structure in a fire following blowout during drillship operations was estimated by calculating the heat flux through fire analysis. Heat transfer analysis, and structural analysis as a function of temperature, were performed.

  2. Fire analysis was performed based on blowout scenarios of two types of leakage—restricted leakage (35 kg/s) and full leakage (150 kg/s). Based on the larger heat flux of the results, heat transfer analysis and structural analysis as a function of temperature were performed.

  3. In general, fire protection is not provided on the drill floor of the drillship. However, in the event of fire, the area is vulnerable to collapse and is a risk factor for the structural stability of the drillship. Therefore, in this study, we propose the application of PFP so that the drill floor structure does not collapse for the 30-minute fire duration, which is required for safe evacuation of crew.

  4. This study found that application of PFP on the primary deck, leg, and brace is the optimum method ensuring both structural stability and economic efficiency.

Acknowledgements

This paper is a research conducted with the support of the National Research Foundation of Korea (No. 2018R1A2B6007403) with funding from the Government (Ministry of Science and ICT) in 2018. This study was supported by the Ministry of Trade, Industry and Energy and Korea Evaluation Institute of Industrial Technology (KEIT) funding in 2019 (20006632).

Notes

Author name ORCID Contributions
Kim, Teak-Keon 0000-0002-1877-4667 ①③
Kim, Seul-Kee 0000-0002-1293-675X
Lee, Jae-Myung 0000-0001-8655-2591
① Conceived of the presented idea or developed the theory
② Carried out the experiment or collected the data
③ Performed the analytic calculations or numerical simulations
④ Wrote the manuscript
⑤ Supervised the findings of this study

Fig. 1.
Fire analysis model in KFX
joet-34-2-110f1.jpg
Fig. 2.
Fire analysis results : 35 kg/s release on the drill floor is ignited and 5.4 m/s wind blows from forward (scenario no.1)
joet-34-2-110f2.jpg
Fig. 3.
Fire analysis results : 150 kg/s release on the drill floor is ignited and 5.4 m/s wind blows from forward (scenario no. 2)
joet-34-2-110f3.jpg
Fig. 4.
Fire analysis results : 35 kg/s release on the drill floor is ignited and 5.4 m/s wind blows from aft (scenario no. 3)
joet-34-2-110f4.jpg
Fig. 5.
Fire analysis results : 150 kg/s release on the drill floor is ignited and 5.4 m/s wind blows from aft (scenario no. 4)
joet-34-2-110f5.jpg
Fig. 6.
Fire analysis results : 35 kg/s release under the drill floor is ignited and 5.4 m/s wind blows from forward (scenario no. 5)
joet-34-2-110f6.jpg
Fig. 7.
Fire analysis results : 35 kg/s release under the drill floor is ignited and 5.4 m/s wind blows from aft (scenario no. 6)
joet-34-2-110f7.jpg
Fig. 8.
Fire analysis results : 35 kg/s release under the drill floor is ignited and 9 m/s wind blows from forward (scenario no. 7)
joet-34-2-110f8.jpg
Fig. 9.
Fire analysis results : 150 kg/s release under the drill floor is ignited and 5.4 m/s wind blows from forward (scenario no. 8)
joet-34-2-110f9.jpg
Fig. 10.
Specific heat of carbon steel as a function of temperature, Eurocode 3 (BSI, 2005)
joet-34-2-110f10.jpg
Fig. 11.
Thermal conductivity of carbon steel as a function of temperature, Eurocode 3 (BSI, 2005)
joet-34-2-110f11.jpg
Fig. 12.
Temperature (°C) distribution of drill floor during fire (900 s)
joet-34-2-110f12.jpg
Fig. 13.
Temperature (°C) distribution of drill floor during fire (1,800 s)
joet-34-2-110f13.jpg
Fig. 14.
Temperature curve of various locations on drill floor
joet-34-2-110f14.jpg
Fig. 15.
Reduction factor for stress-strain relationship of carbon steel at elevated temperatures, Eurocode 3 (BSI, 2005)
joet-34-2-110f15.jpg
Fig. 16.
Strain of drill floor 280 s after ignition
joet-34-2-110f16.jpg
Fig. 17.
Strain of drill floor 395 s after ignition
joet-34-2-110f17.jpg
Fig. 18.
Strain of deck secondary and primary of drill floor
joet-34-2-110f18.jpg
Fig. 19.
Temperature (°C) of PFP of deck
joet-34-2-110f19.jpg
Fig. 20.
Strain of PFP of deck 1307 seconds after ignition
joet-34-2-110f20.jpg
Fig. 21.
Strain of PFP of deck after ignition
joet-34-2-110f21.jpg
Fig. 22.
Temperature (°C) of PFP of deck, leg and brace
joet-34-2-110f22.jpg
Fig. 23.
Strain of PFP of deck, leg and brace
joet-34-2-110f23.jpg
Fig. 24.
Strain of PFP of deck, leg and brace after ignition
joet-34-2-110f24.jpg
Table 1.
Fire analysis scenario considering blowout flow rate
No. Release location Flow rate (kg/s) Wind speed (m/s) Wind direction
1 On drill floor 35 5.4 From forward
2 150 5.4 From forward
3 35 5.4 To forward
4 150 5.4 To forward

5 Under drill floor 35 5.4 From forward
6 35 5.4 To forward
7 35 9 From forward
8 150 5.4 From forward
Table 2.
Thermal property of carbon steel
Steel type Specific heat capacity (J/kg K) Thermal conductivity (W/m K) Surface emissivity
ASTM A36 520 50 0.8
Table 3.
Reduction factor for stress-strain relationship of carbon steel at elevated temperatures
Steel Temperature θa Reduction factors at temperature θa relative to value of fy or Ea at 20 °C

Reduction factor (relative to fy) for effective yield strength k = fy,θ/fy Reduction factor (relative to fy) for proportional limit k = fp,θ/fy Reduction factor (relative to Ea) for the slope of the linear elastic range k = Ea,θ/Ea
20 °C 1.000 1.000 1.000
100 °C 1.000 1.000 1.000
200 °C 1.000 0.807 0.900
300 °C 1.000 0.613 0.800
400 °C 1.000 0.420 0.700
500 °C 0.780 0.360 0.600
600 °C 0.470 0.180 0.310
700 °C 0.230 0.075 0.130
800 °C 0.100 0.050 0.090
900 °C 0.060 0.0375 0.0675
1000 °C 0.040 0.0250 0.0450
1100 °C 0.020 0.0125 0.0225
1200 °C 0.000 0.0000 0.0000

Note: For intermediate values of steel temperature, linear interpolation may be used.

fy: the yield strength at 20 °C

Ea: the modulus of elasticity of steel for normal temperature design

ky,θ: effective yield strength, relative to yield strength at 20 °C

kp,θ: proportional limit, relative to yield strength at 20 °C

kE,θ: slope of linear elastic range, relative to slope at 20 °C

fy,θ: the effective yield strength of steel

fp,θ : the proportional limit of strength of steel

Ea,θ : the modulus of elasticity of steel for the slope of the linear elastic range

Table 4.
Critical local maximum principal plastic strain for uniaxial stress states
Steel grade S235 S355 S460

Critical local yield strain 0.15 0.12 0.09

References

ABS Consulting. (2015). Case Study 2: Deepwater Drilling with Surface BOP from a Floating Facility, The Bureau of Safety and Environmental Enforcement (BSEE), Retrieved from https://www.bsee.gov/sites/bsee.gov/files/752ac.pdf

Ahmad, A., Hassan, SA., Ripin, A., Ali, MW., & Haron, S. (2013). A Risk-based Method for Determining Passive Fire Protection Adequacy. Fire Safety Journal, 58, 160-169. https://doi.org/10.1016/j.firesaf.2013.01.020
crossref
Amdahl, J., Holmås, T., & Skallerud, B. (2003). Ultimate Strength of Structural Members with Attachments during Accidental Fires. Proceedings of International Conference of Response of Structures to Extreme Loading Tronto, Canada.

American Petroleum Institute (API). (2006). Recommended Practice for the Design of Offshore Facilities Against Fire and Blast Loading, API Publishing Services, Washington.

Bai, Y., & Jin, WL. (2016). Marine Structural Design. 2nd ed Elsevier Butterworth Heinemann: UK.

British Standards Institution (BSI). (2005). EN 1993-1-2: Eurocode 3: Design of Steel Structures, Part 1-2: General Rules–Structural Fire Design, London. British Standards Institution.

Dadashzadeh, M., Abbassi, R., Khan, F., & Hawboldt, K. (2013). Explosion Modeling and Analysis of BP Deepwater Horizon accident. Safety Science, 57, 150-160. https://doi.org/10.1016/j.ssci.2013.01.024
crossref
Det Norske Veritas (DNV). (2013). Determination of Structural Capacity by Non-linear FE Analysis Methods (DNV-RP-C208). Det Norske Veritas.

Fiona, M., & Stephen, R. (2018). Piper Alpha - What Have We Learned? Loss Prevention Bulletin, 261, 3-9. Retrieved from https://www.icheme.org/media/1982/lpb261_pg03.pdf

Friebe, M., Jang, B-S., & Jim, Y. (2014). A Parametric Study on the Use of Passive Fire Protection in FPSO Topside Module. International Journal of Naval Architecture and Ocean Engineering, 6(4), 826-839. https://doi.org/10.2478/ijnaoe-2013-0216
crossref
Health and Safety Executive. (2017). The Deepwater Horizon Incident: Fire and Explosion Issues. Retrieved from https://www.hse.gov.uk/research/rrhtm/rr1122.htm

Jin, Y., & Jang, BS. (2015). Probabilistic Fire Risk Analysis and Structural Safety Assessment of FPSO Topside Module. Ocean Engineering, 104, 725-737. https://doi.org/10.1016/j.oceaneng.2015.04.019
crossref
Jin, Y., Jang, B-S., & Kim, J. (2016). Fire Risk Analysis Procedure Based on Temperature Approximation for Determination of Failed Area of Offshore Structure: Living Quarters on Semi-drilling Rig. Ocean Engineering, 126, 29-46. https://doi.org/10.1016/j.oceaneng.2016.07.010
crossref
Kim, JH., Kim, DC., Kim, CK., Islam, MS., Park, SI., & Paik, JK. (2013). A Study on Methods for Fire Load Application with Passive Fire Protection Effects. Ocean Engineering, 70, 177-187. https://doi.org/10.1016/j.oceaneng.2013.05.017
crossref
Lazarus, NW. (2016). A County-Level Risk Assessment of the Deep Water Horizon Oil Spill in the Gulf of Mexico. Geographical Review, 106(3), 360-380. https://doi.org/10.1111/j.1931-0846.2016.12178.x
crossref
Santosa Basin BM-S Cluster Region. 2008 MetOcean Data. Petrobras.

Skogdalen, JE., & Vinnem, JE. (2012). Quantitative Tisk Snalysis of Oil and Gas Drilling, using Deepwater Horizon as Case Study. Reliability Engineering & System Safety, 100, 58-66. https://doi.org/10.1016/j.ress.2011.12.002
crossref
Suardin, JA., McPhate, AJ., Sipkema, A., Childs, M., & Mannan, MS. (2009). Fire and Explosion Assessment on Oil and Ggas Floating Production Storage Offloading (FPSO): An Effective Screening and Comparison Tool. Process Safety and Environmental Protection, 87(3), 147-160. https://doi.org/10.1016/j.psep.2008.12.002
crossref
USFOS A/S. (2013a). User’s Manual for FAHTS (Version 637), USFOS A/S, Sandsli.

USFOS A/S. (2013b). User’s Manual for USFOS (Version 86a), USFOS A/S, Sandsli.

Vembe, BE., Kleiveland, RN., Grimsmo, B., Lilleheie, NI., Rian, KE., Olsen, R., & Evanger, T. (2014). User’s Manual for Kameleon FireEx. Tronheim, Norway. Computational Industry Technologies AS.


ABOUT
BROWSE ARTICLES
ARTICLE CATEGORY

Browse all articles >

PUBLICATION ETHICS
FOR CONTRIBUTORS
Editorial Office
President Office BD Rm. 1302, 13 Jungang-daero 180beon-gil, Dong-gu, Busan 48821, Republic of Korea
Tel: +82-51-759-0656    Fax: +82-51-759-0656    E-mail: ksoehj@ksoe.or.kr                

Copyright © 2024 by The Korean Society of Ocean Engineers.

Developed in M2PI

Close layer
prev next