J. Ocean Eng. Technol. Search

CLOSE


J. Ocean Eng. Technol. > Volume 34(2); 2020 > Article
Kim: Study on Applicability of Ultimate Strength Design Formula for Sandwich Panels - Application Cases of Double Hull Tanker Bottom Structures

Abstract

In this study, ultimate strength characteristics of clamped sandwich panels with metal faces and an elastic isotropic core under combined in-plane compression and lateral pressure loads are investigated to verify the applicability of the ultimate strength design formula for ship structures. Alternative elastomer-cored steel sandwich panels are selected instead of the conventional bottom stiffened panels for a Suezmax-class tanker and then the ultimate strength characteristics of the selected sandwich panels are examined by using nonlinear finite element analysis. The change in the ultimate strength characteristics due to the change in the thickness of the face plate and core as well as the amplitude of lateral pressure are summarized and compared with the results obtained by using the ultimate strength design formula and nonlinear finite element analysis. The insights and conclusions developed in the present study will be useful for the design and development of applications for sandwich panels in double hull tanker structures

1. Introduction

Sandwich panels are widely used at various industrial sites owing to their excellent mechanical strength and lightweight structure. In ships, sandwich panels are beneficial during construction and maintenance because they can greatly reduce the number of longitudinal stiffeners as compared to the stiffened plate structures. They have further design advantages owing to the reduced stress concentration and fatigue problems by avoiding stiffeners. Over the last two decades, the applications of sandwich panels in ships and offshore installations have gradually increased and several related studies have been conducted. Brooking and Kennedy (2004) showed the advantages of sandwich panel structures in oil tankers with a dead weight tonnage (DWT) of 14K through a case study. They derived that the sandwich panel structure can reduce the weight by approximately 2% and weld volume by approximately 50% as compared to the conventional stiffened plate structure using the finite element analysis (FEA) technique. They emphasized that sandwich panels have great advantages in structural stability and environmental production owing to their energy absorption capacity and fire stability. Momcilovic and Motok (2009) showed that a sandwich structure for a 77-m-long barge can reduce the hull weight by approximately 5–8% compared to the stiffened plate structure. Ramakrishna and Sunil Kumar (2016) specified that using sandwich panels is advantageous in reducing construction costs because the number of stiffeners is reduced, which in turn decreases the surface area and weight along with the number of structural members, junctions, and welding lines. Using sandwich panels can further reduce operating costs including maintenance owing to structural discontinuities in which stress concentration and fatigue cracking occur. Despite these advantages, case studies in the shipbuilding field are insufficient due to lack of design tools and techniques for sandwich panel construction. The International Classification Society is also attempting to develop design guidelines for sandwich panel construction, but additional research is required on various loading conditions and sandwich panel structures including research on design validation methods using FEA techniques (DNV-GL, 2016; LR, 2019). Furthermore, efficient methods, such as the strength evaluation automation systems introduced in the case study by Kim and Jang (2017), are required for shipyards and related business sites to design and apply sandwich panel structures more extensively.
The present study is a case study to apply sandwich panel structures to the bottom structure of a Suezmax-class oil tanker. The ultimate strength characteristics of sandwich panels under lateral pressure and longitudinal axial compression loads are examined by using a nonlinear FEA technique, and the results are compared with the ultimate strength design formula that has been derived in the author’s previous study (Kim, 2019).

2. Bottom Structure Characteristics of Suezmax-class Tanker and Selection of Sandwich Panels

2.1 Principal Dimensions and Load Characteristics

Tables 1 and 2 show the principal dimensions and the details of bottom stiffened plates of a Suezmax-class tanker (Kim et al., 2014). The inner and outer bottom structures are stiffened plates with 19 longitudinal stiffeners as shown in Fig. 1, which have a length of 4,800 mm and a width of 17,100 mm.
In Fig. 2, lateral pressure distributions of the Suezmax-class tanker in full load condition and ballast condition are shown. The inner bottom plate has a lateral pressure of approximately 0.3 MPa, and the outer bottom plate has a lateral pressure of approximately 0.2 MPa.
In this study, the stiffened plate of the inner bottom was selected as the subject of research. The inner bottom plate has a thickness (t) of 14.84 mm and 19 T-type longitudinal stiffeners. The web height (hw), web thickness (tw), breadth of flange (bf), and flange thickness (tf) of the longitudinal stiffeners are hw×tw+bf ×tf = 504×8.0+146.5×20.5 mm.

2.2 Selection of Sandwich Panels

In this study, The structure of the stiffened plate of the inner bottom, which is the target stiffened plate, was changed to the target sandwich panel, as shown in Fig. 3. According to a previous study, as shown in Fig. 4, the thickness (tf) of the sandwich panel’s face plate was 3–8 mm, the thickness (tc) of the core was 20–50mm, the transverse frame spacing was 3.2–4.0 m, and the aspect ratio (a/b) was 1.4–1.7 (Ramakrishnan and Sunil Kumar, 2016). The classification rules suggest a face plate thickness of 3–30 mm, core thickness of 15–100 mm, core elastic coefficient (Ec) of 748 MPa, and Poisson’s ratio (vc) of 0.26 (DNV-GL, 2016).
In this study, we selected different breadths of sandwich panels (b) while maintaining the same spacing (4,800 mm) of the existing transverse frames. Furthermore, we selected sandwich panels with breadths of 3,240 mm in the aspect ratio range of 1.4–1.7 and sandwich panels with breadths of 4,275 mm in the aspect ratio range of 1.0 < a/b < 1.4. The difference in the breadths of the selected panels is approximately equal to one longitudinal stiffener spacing (855 mm) in the existing stiffened plate structure. Face plate thicknesses of 4, 5.5, 7, and 8 mm were chosen. For the core thickness, we selected sandwich panels having weights equal to the weight of the target stiffened plate. The core thickness was selected according to the face plate thickness, which was selected such that the weight per unit area of the target stiffened plate structure having a length of 4,800 mm and width of 17,100 mm would be equal to the weight per unit area of the selected sandwich panel. Table 3 shows the dimensions of the selected sandwich panels. Only the aspect ratio (a/b) of the sandwich panels and the thicknesses of the face plate and core were changed while maintaining the same yield strength (σY), elastic coefficient (E), Poisson’s ratio (v), and density (ρp) of the face plate and the same elastic coefficient (Ec), Poisson’s ratio (vc), and density (ρp) of the core.

3. Nonlinear Finite Element Analysis

3.1 Finite Element Modeling and Boundary Conditions

In Fig. 5, the finite element modeling and boundary conditions used in this study are shown. Based on the experience obtained from previous studies and the mesh convergence study, a sandwich panel with a size of 4,800 × 4,275 mm (aspect ratio is approximately 1.1) was modeled using 48 × 44 four-node layered shell elements and a panel with a size of 4,800 × 3,420 mm (aspect ratio is approximately 1.4) was modeled using 48 × 36 four-node layered shell elements. The elements comprise of three layers, i.e., the face plate, core, and face plate having 100 mm or smaller sizes and square shapes. Both the face plate and core were modeled as isotropic materials. In addition, the core was modeled as a perfectly elastic material and the face plate as an elastic-perfectly plastic material. The material constants of the face plate and core are outlined in Table 3.
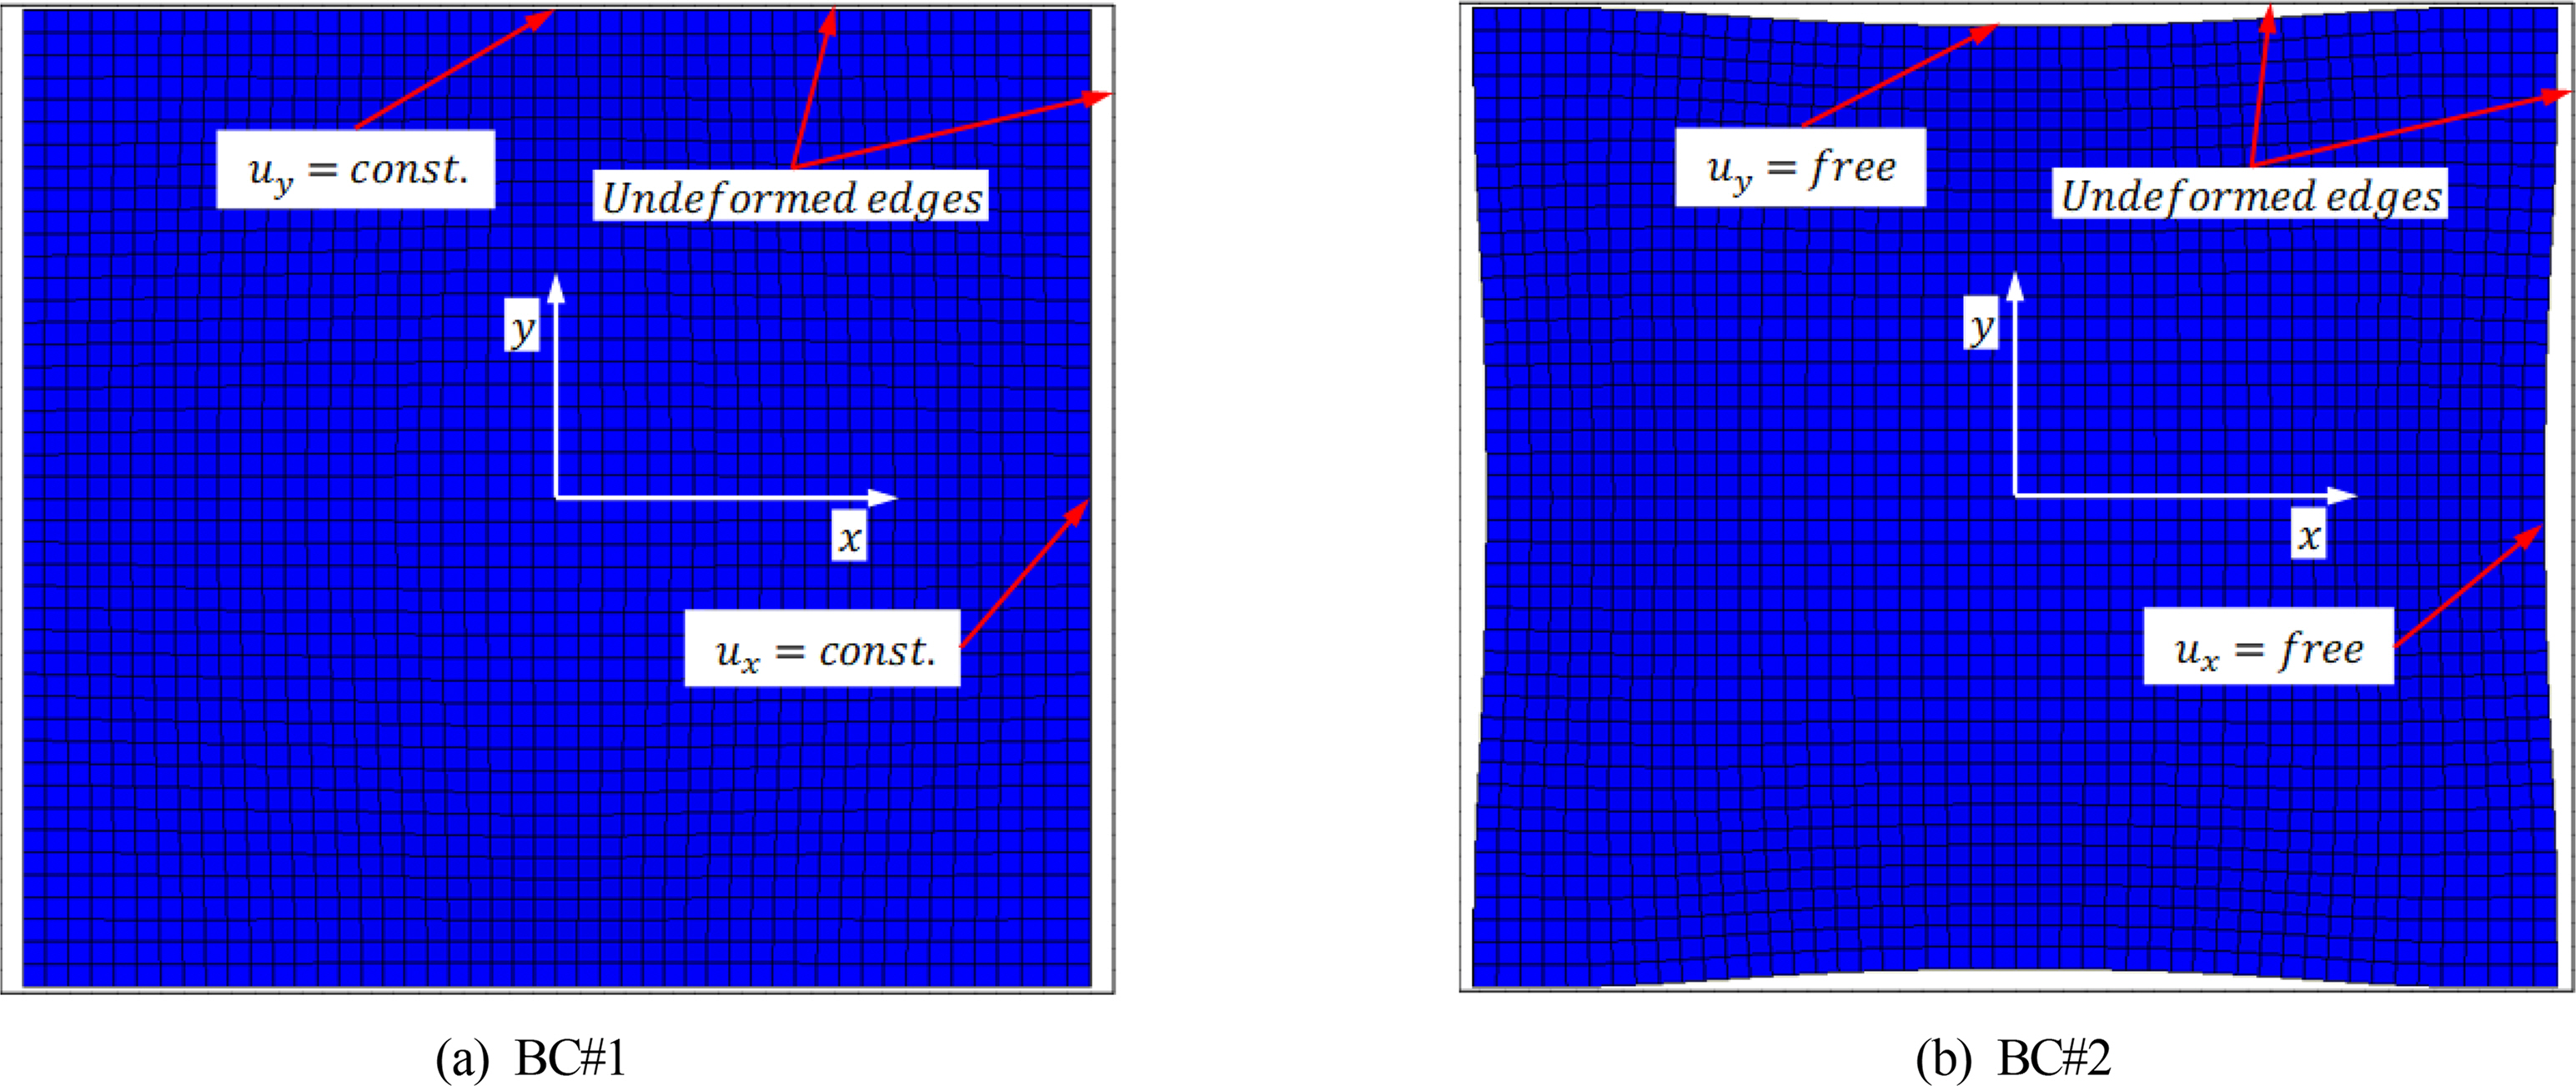
The boundary conditions of the four edges of the panels were assumed to be clamped. The previous study used the boundary condition (BC#1) where the four edges of the panel boundary always maintain a straight line in the plane even if the panel is deflected as shown in Fig. 6. In this study, however, we considered an additional boundary condition (BC#2) where a free in-plane displacement may occur. The support members around the panel were not included in the model. The details of these two boundary conditions are outlined in Table 4.
For load application to the panel, lateral pressure was first applied before applying the in-plane compression load. In this study, to observe the ultimate strength behavior according to different lateral pressures, 0.15 MPa and 0.3 MPa were applied as uniform pressure vertically to the element plane of the finite element model, and the in-plane compression load was applied as uniform pressure to the edges of the element. The lateral pressure reached the operating load through load increments of 30 or more steps. Then, the ultimate strength was obtained by incrementing the in-plane compression load using the arc-length method. To prevent the rigid body motion, the displacements of the x and y directions were fixed to the four nodes at the center of the panel edges as shown in Fig. 5. The elasto-plastic large deformation analysis was performed using the ANSYS software (ANSYS, 1999).

3.2 Analysis of Ultimate Strength Behavior Characteristics

In Figs. 78, the nonlinear FEA results for the selected sandwich panels are shown. The maximum deflection (w) at the center of the panel is normalized with the total thickness of the sandwich panels (T = 2tf + tc) and the in-plane compression load (σxa) along the length (x direction) is normalized with the yield strength (
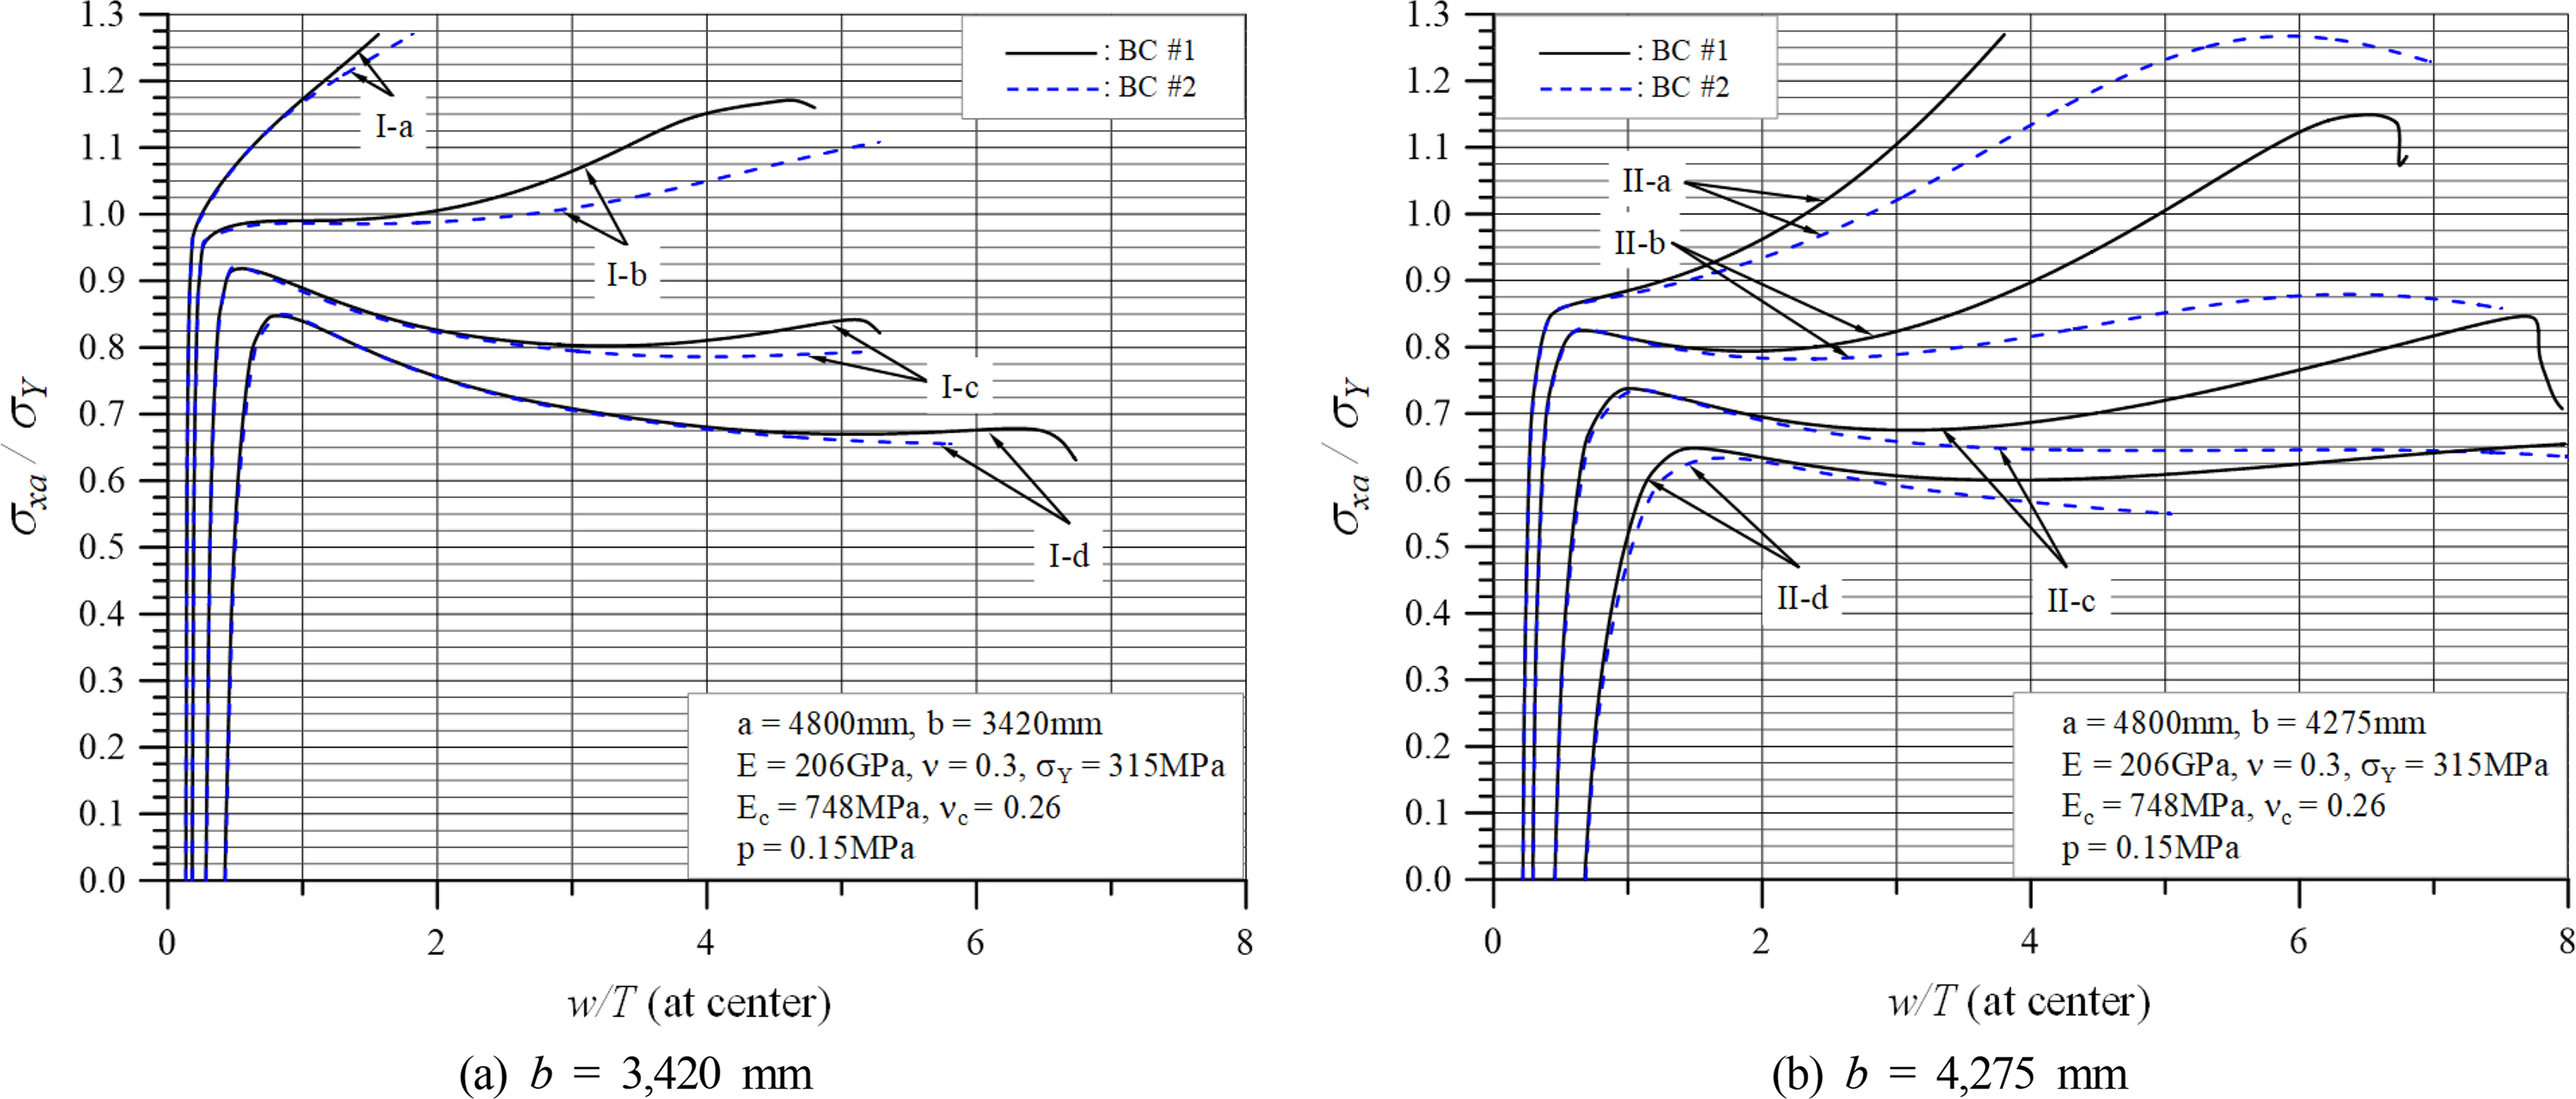
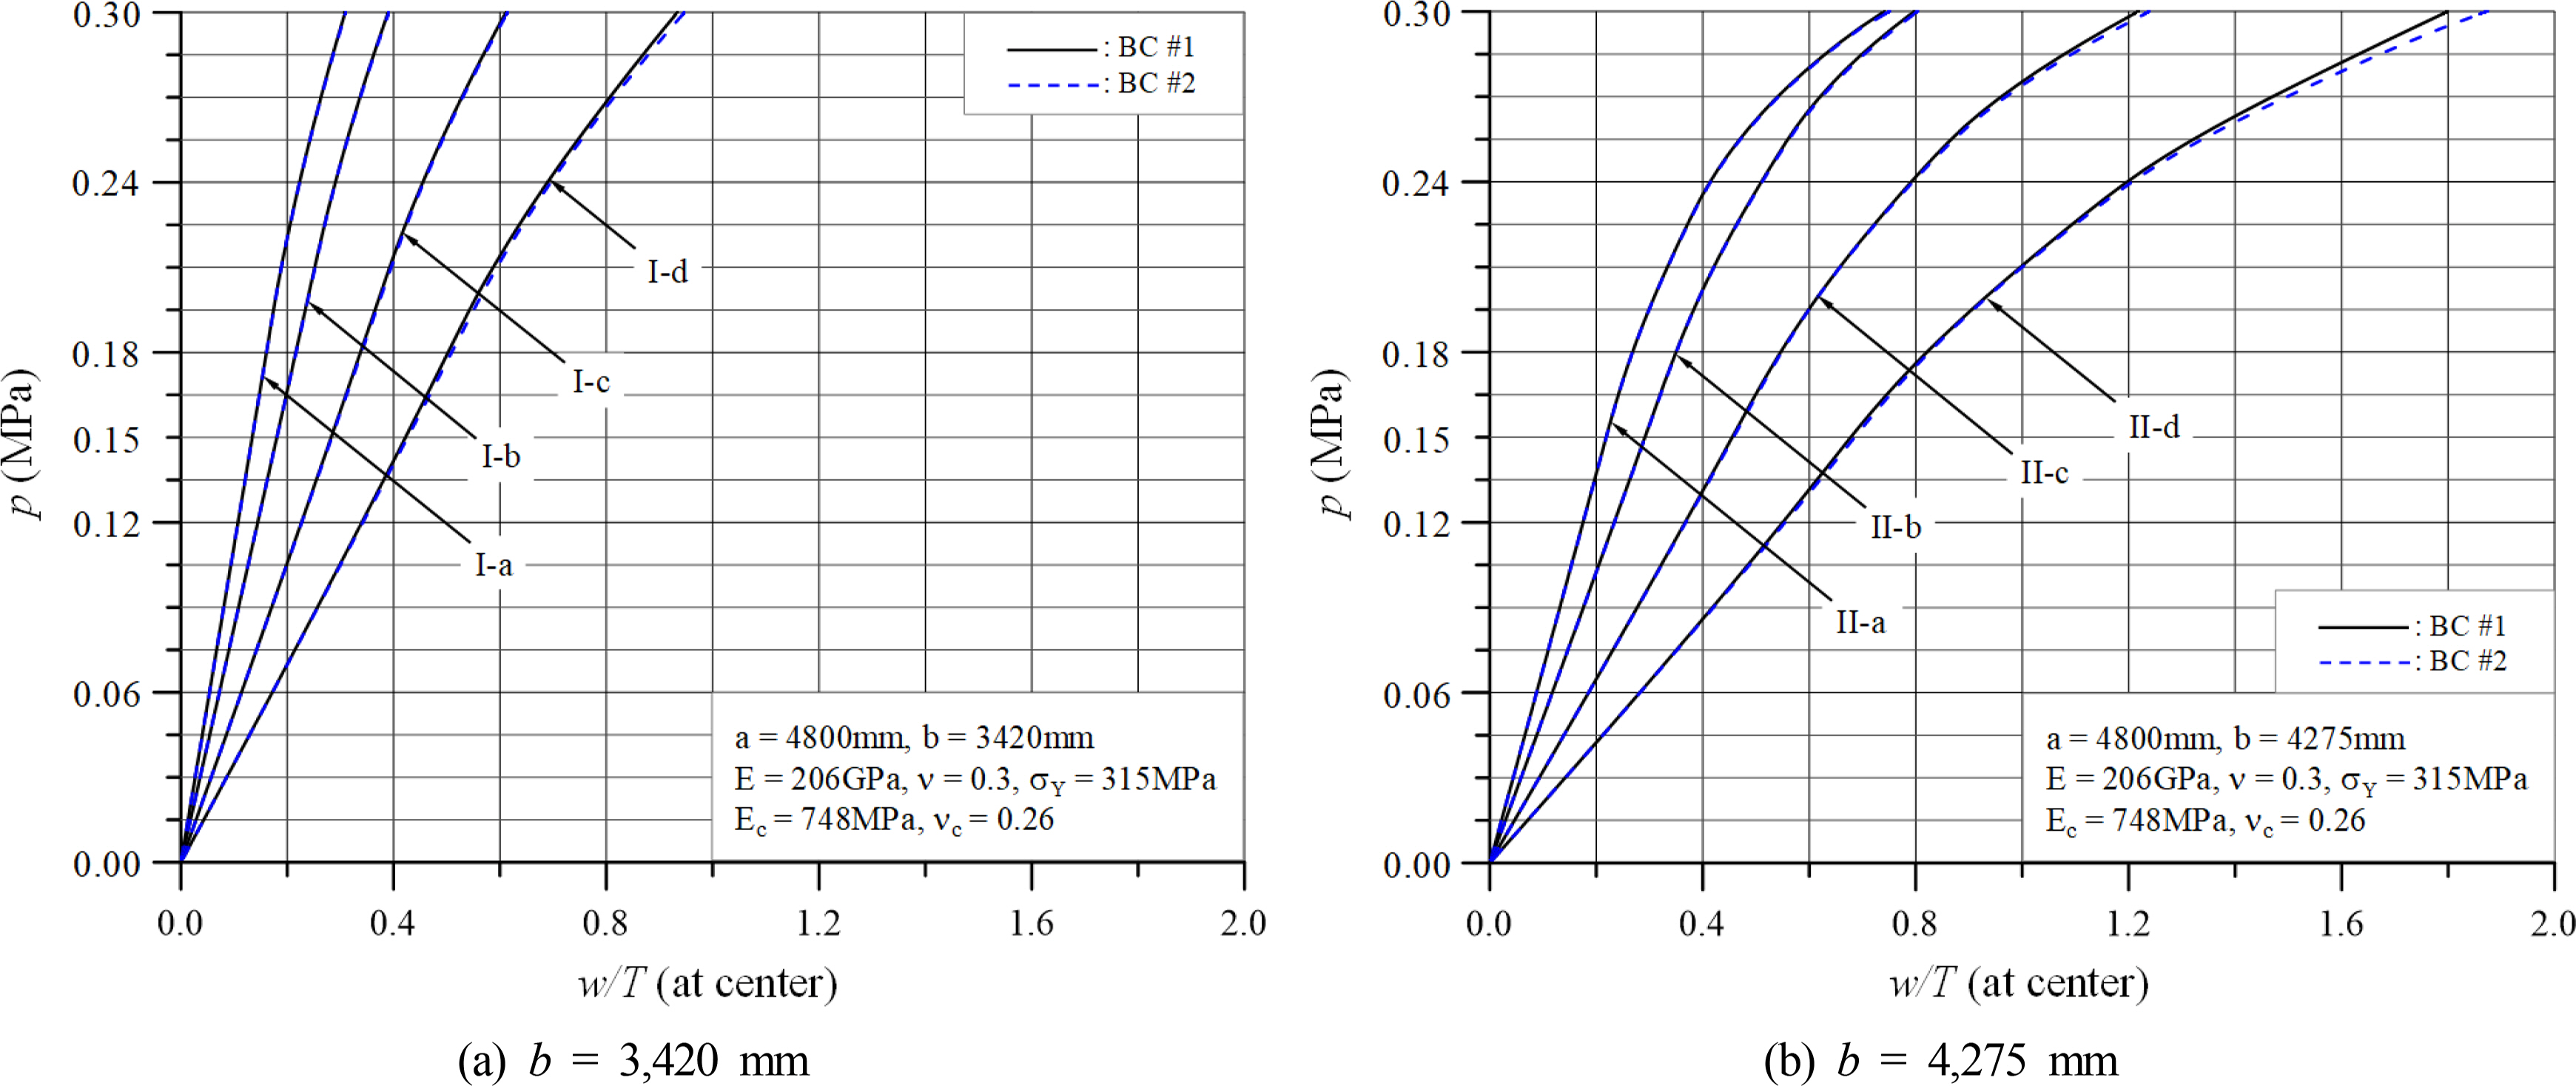
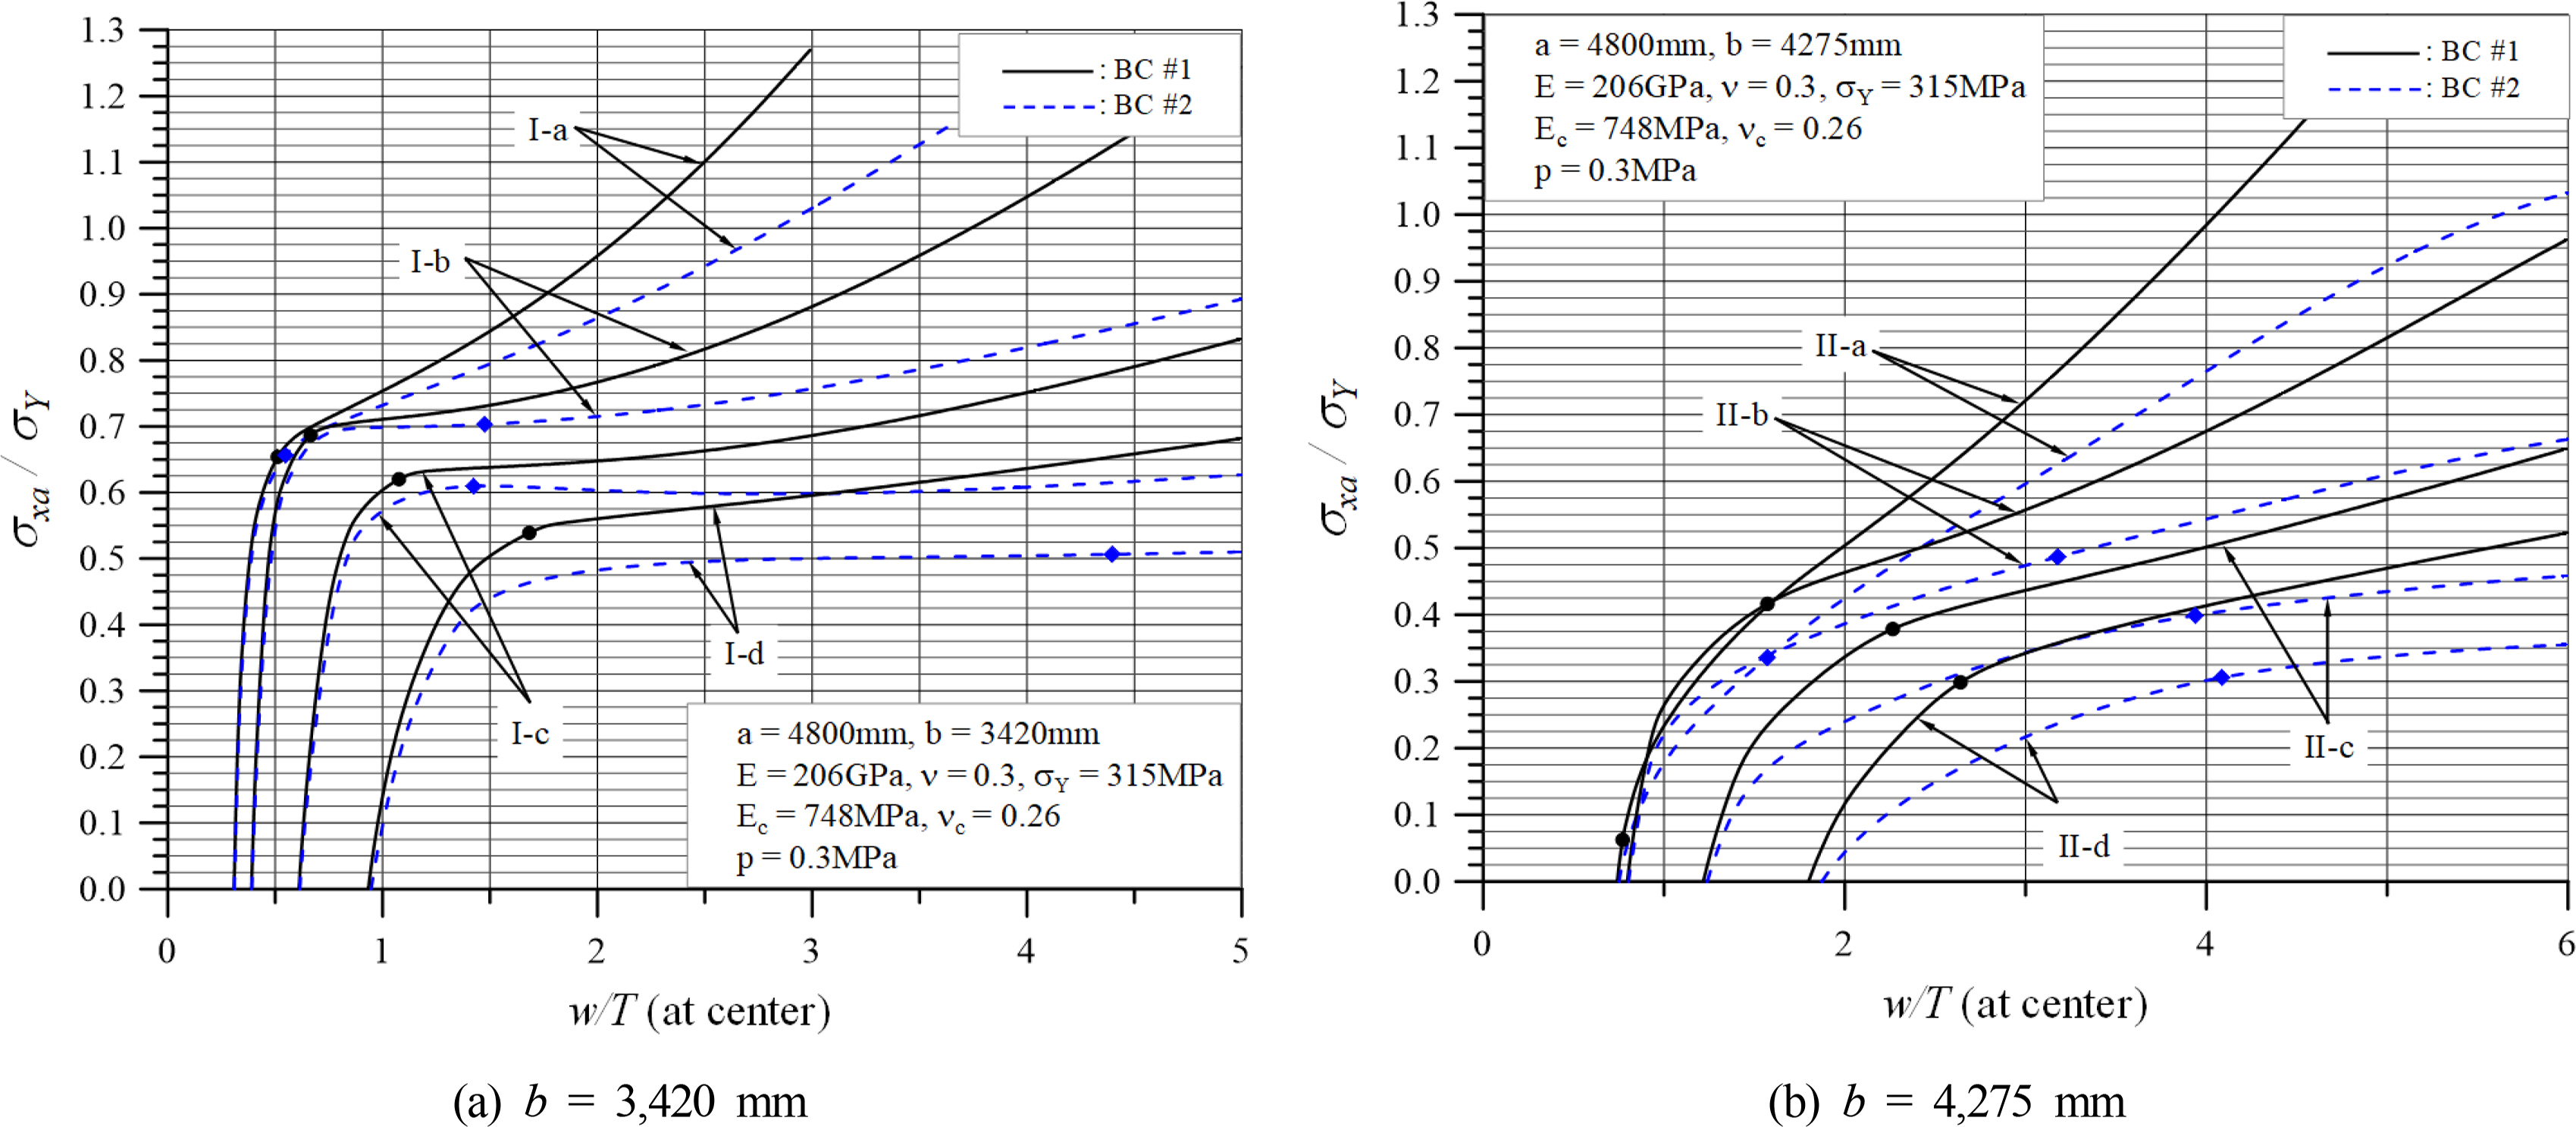
σY) of the face plate. First, to examine the behavior characteristics at the lateral pressure of 0.15 MPa, we can observe a relatively clear threshold where the strength is degraded after the in-plane compression load increases and reaches the ultimate strength, as shown in Fig. 7. However, as shown in the graph for panel I-a, when the thickness of the sandwich panel is large, the threshold is not clear and a deflection behavior obtains for loads exceeding the yield strength. This analysis result is similar to the behavior of a thick plate with a low slenderness ratio and small initial deflection amount and appears more conspicuously in narrow thick panels. Furthermore, the deflection behavior for the boundary condition where the four edges of the sandwich panel always maintain an in-plane straight line (BC#1) and the boundary condition where the in-plane displacements are free (BC#2) remain almost constant up to the threshold and then begin to vary beyond the threshold. The strength degradation of BC#2 is larger than that of BC#1. The greater the thickness and breadth of the sandwich panel, the greater the difference. In the case when lateral pressure is 0.3 MPa as shown in Fig. 8, the threshold is often unclear, and the difference in deflection behavior between BC#1 and BC#2 is larger than the case when the lateral pressure is 0.15 MPa. The difference was large in a low in-plane compression load as well when the panel breadth was 4,275 mm.
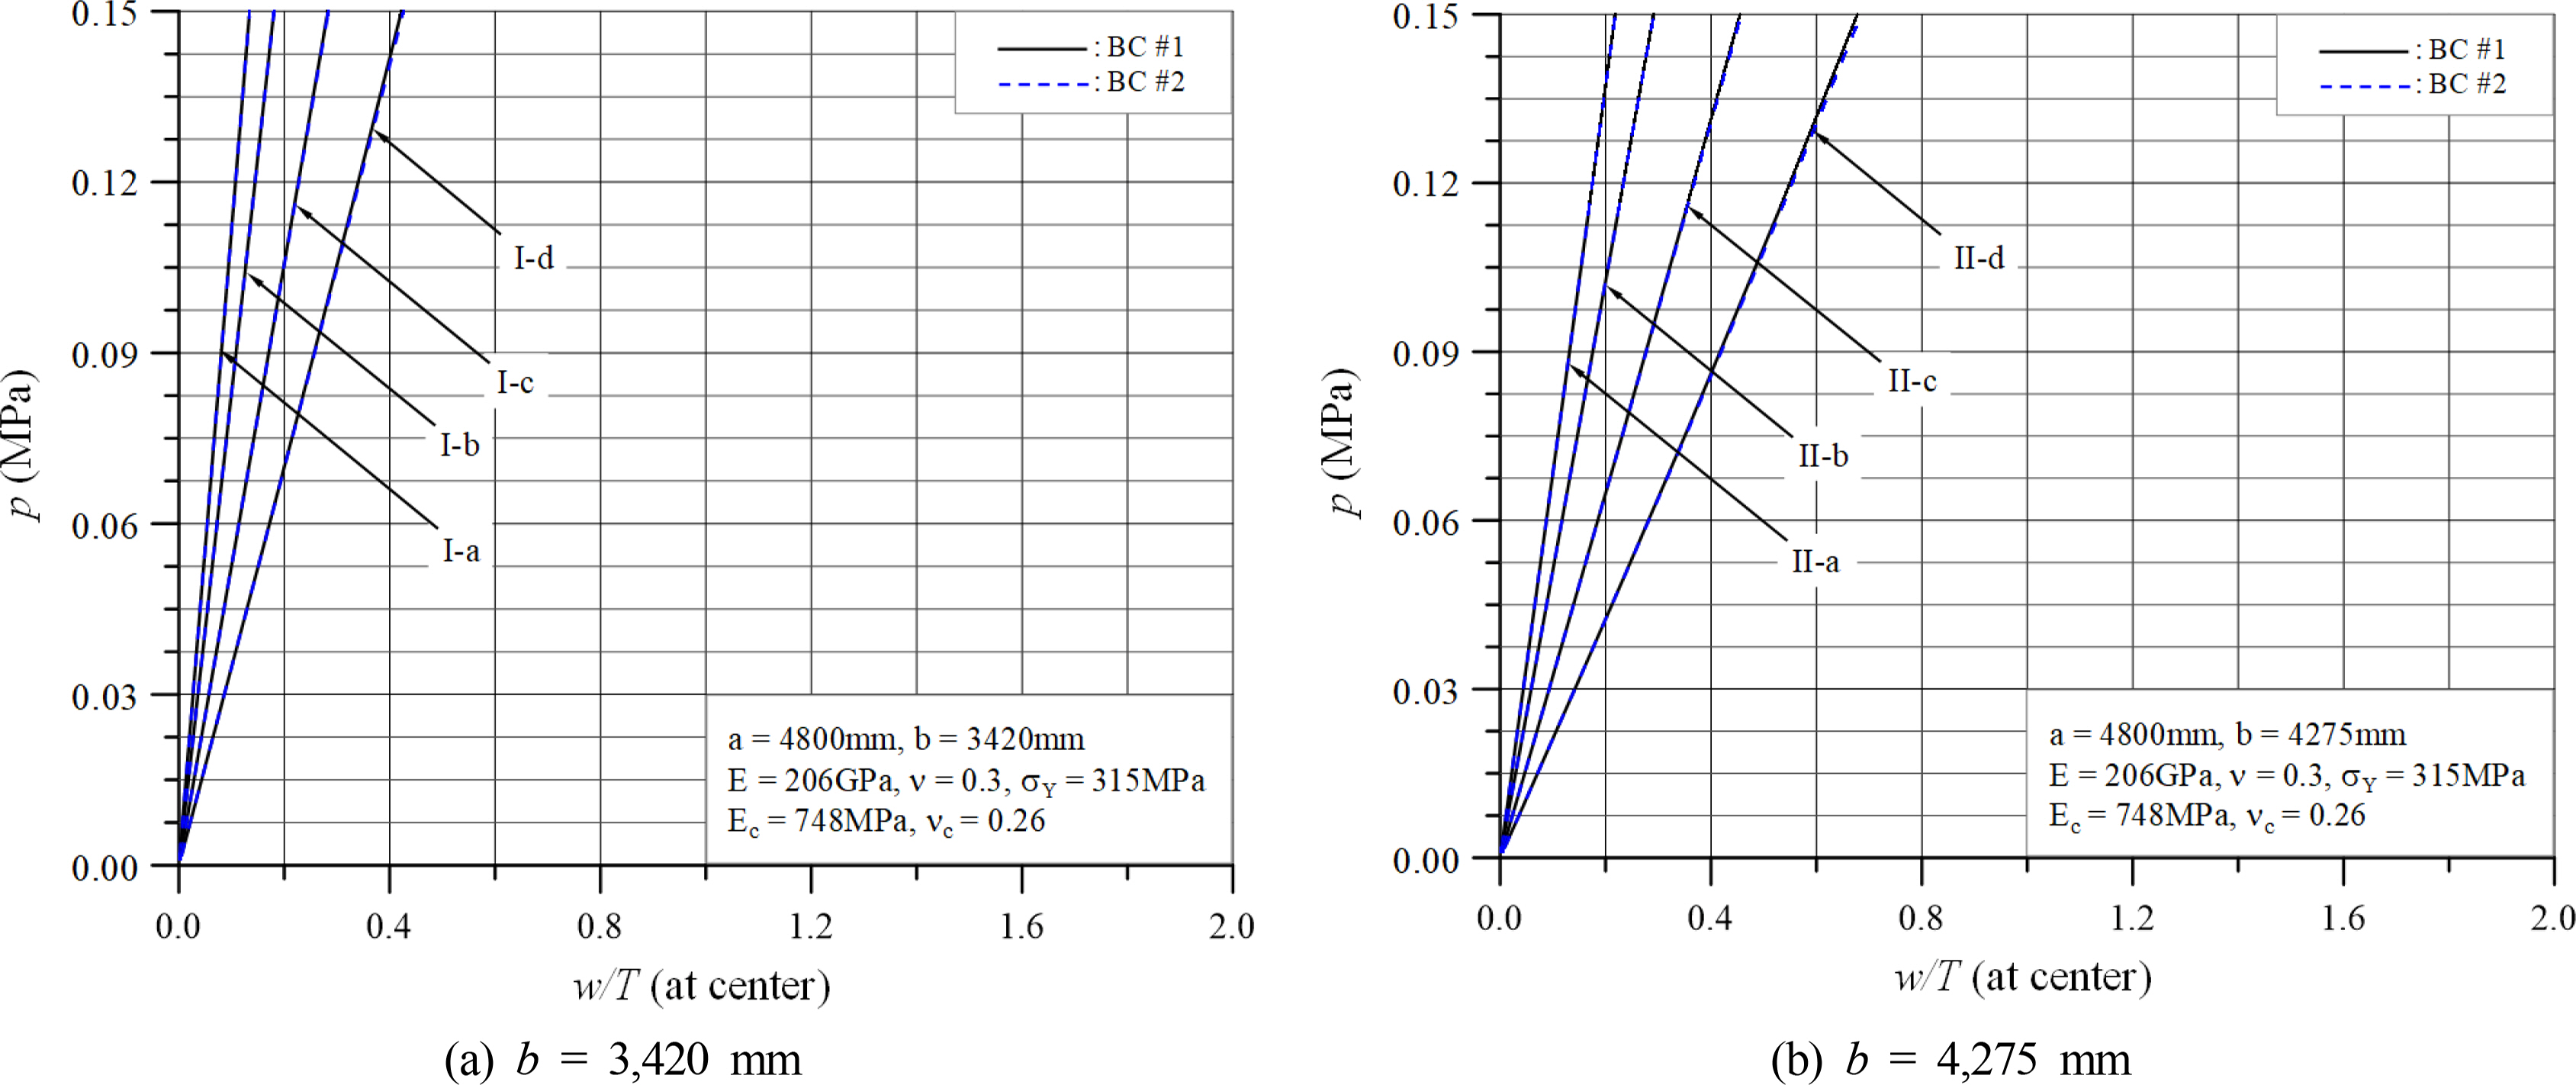
The maximum deflection at the center of each sandwich panel under a lateral pressure of 0.15 MPa is shown in Fig. 9. When a lateral pressure of 0.15 MPa was applied, the maximum deflection increased almost linearly with the increase in lateral load. In the case of panels I-a and II-a with the largest bending rigidity, the deflection in lateral pressure was smaller. As a result, strength degradation did not occur after the ultimate strength in Fig. 7 and deflection behavior appeared for loads exceeding the yield strength. In the case of I-b, a deflection smaller than that of II-a occurred by lateral pressure, and it is presumed that strength degradation did not appear clearly for the same reason because the bending rigidity was 92% that of II-a.
To define the ultimate strength for panels I-a, II-a, and I-b, we examined the progressive yielding pattern of the face plate. According to a previous study, in sandwich panels that were subjected to lateral pressure and in-plane compression load, yielding occurred continuously along the y-axis from the center to the edges of the panel in the face plate (Concave; face plate I) where compression stress occurred along the length owing to lateral pressure. In addition, the ultimate strength was reached on the opposite face plate (Convex; face plate II) as well if yielding occurred continuously from the center to the edges of the panel along the direction of the y-axis (Kim, 2019).
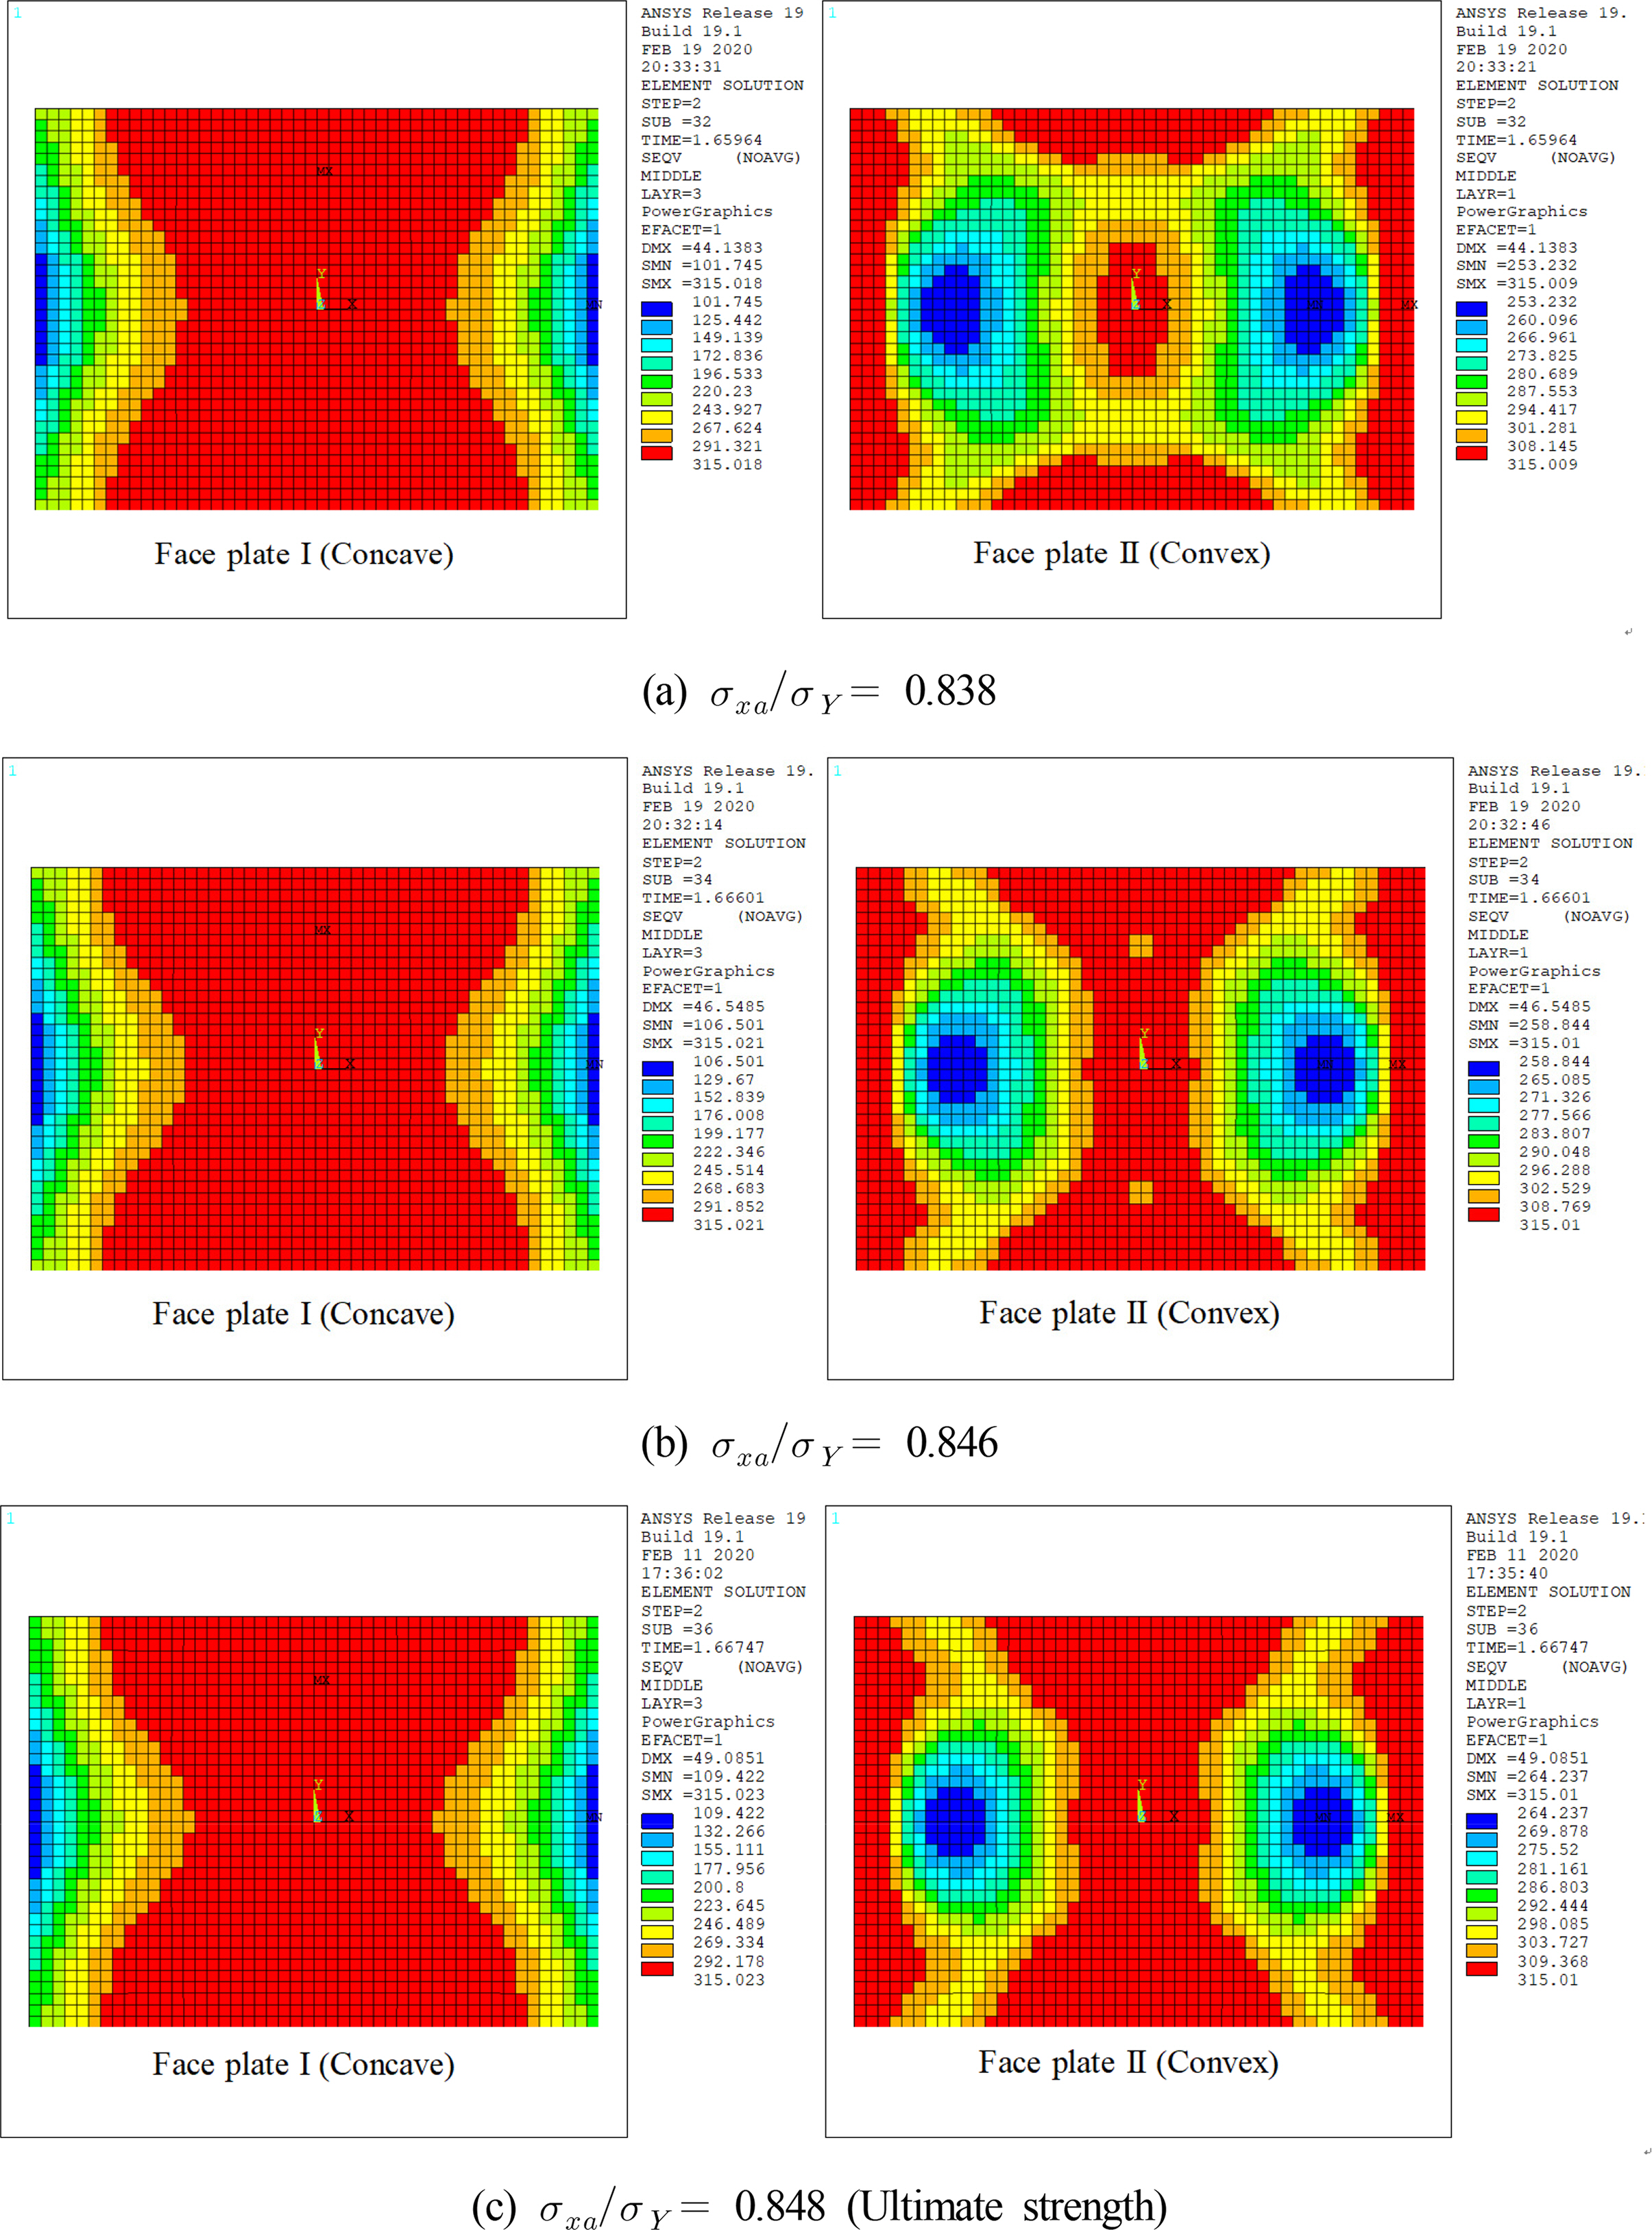
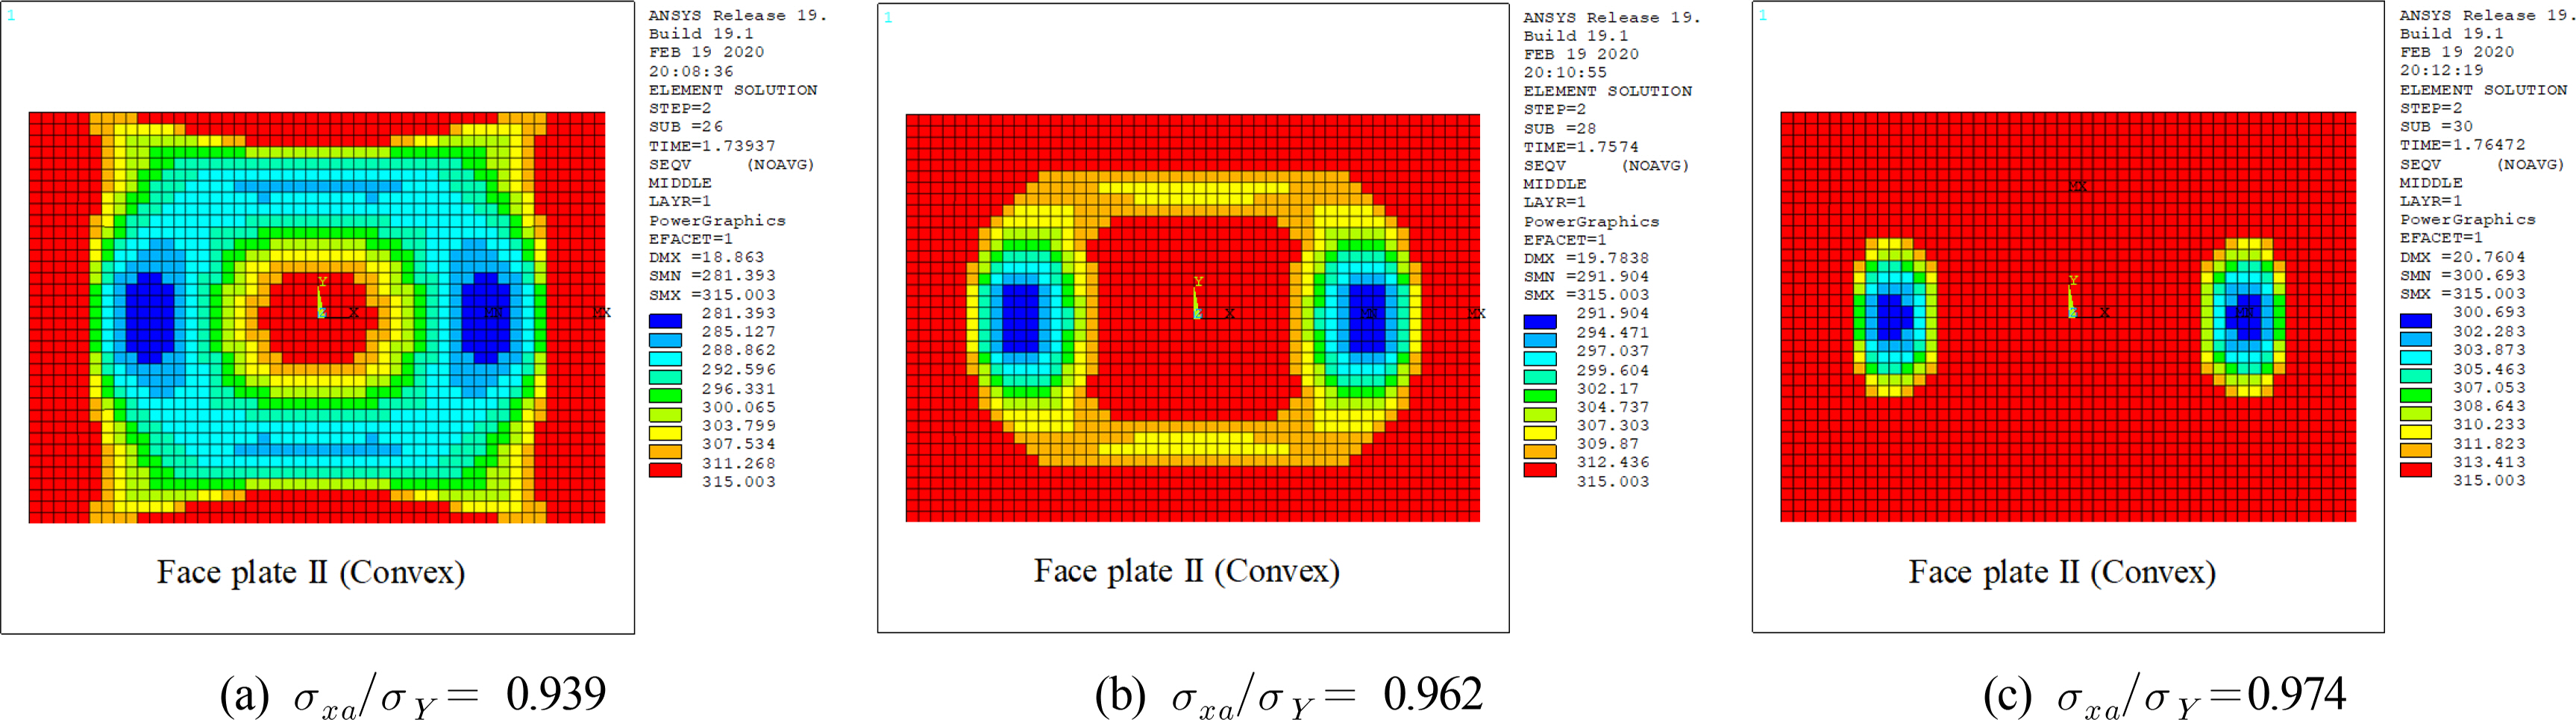
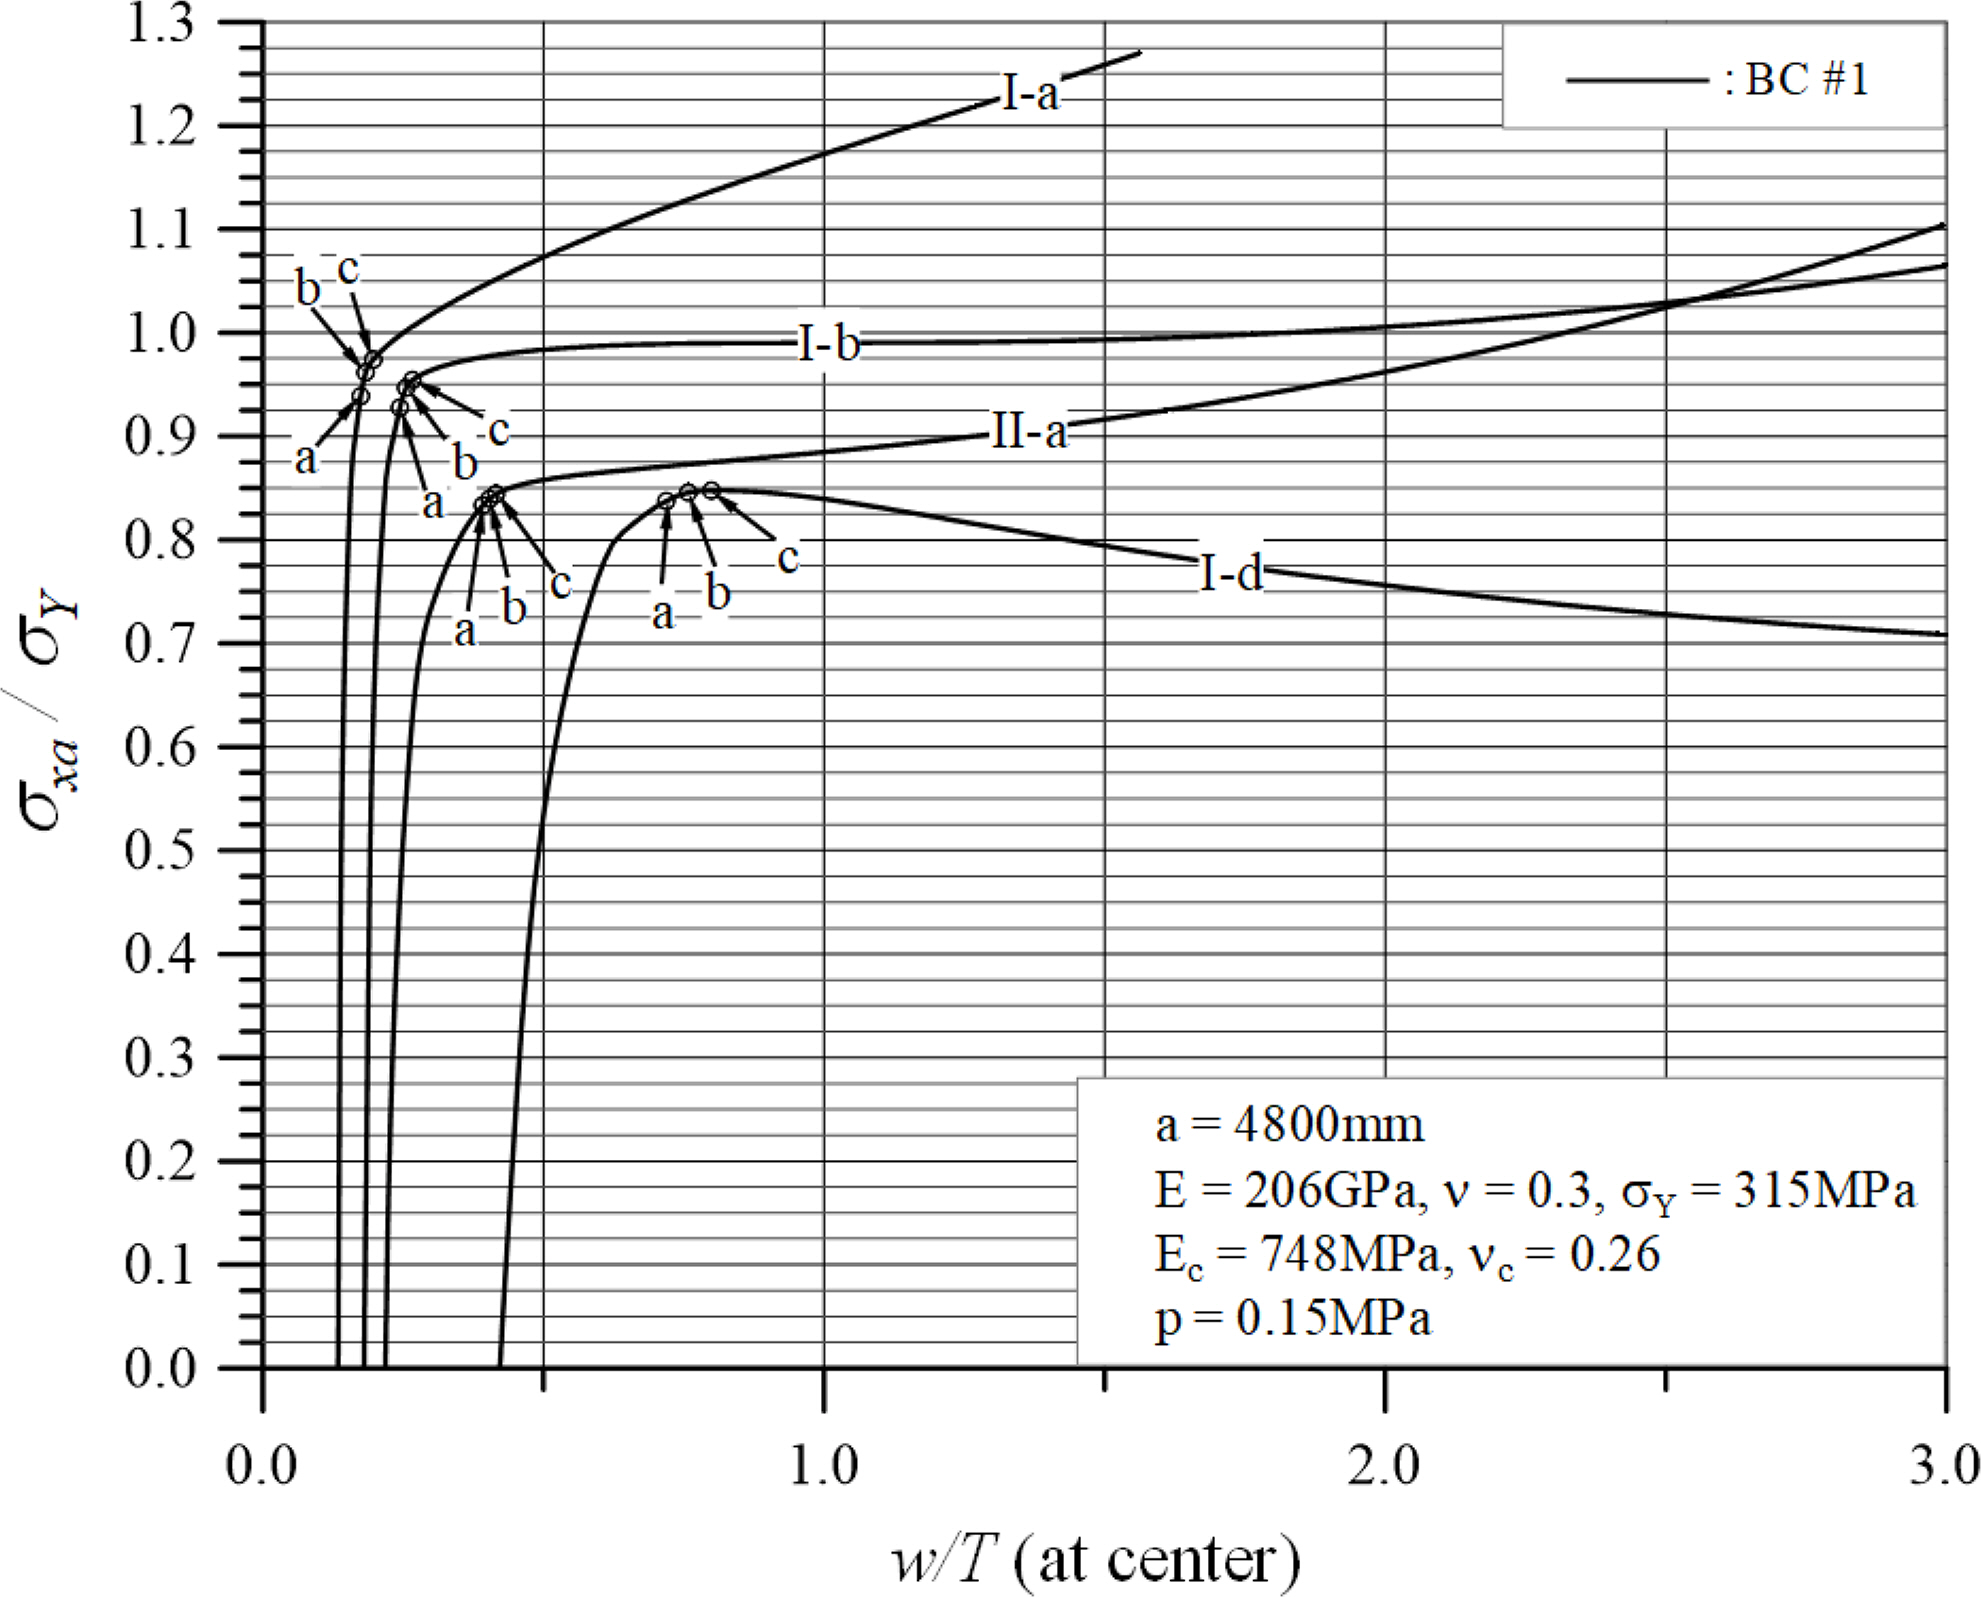
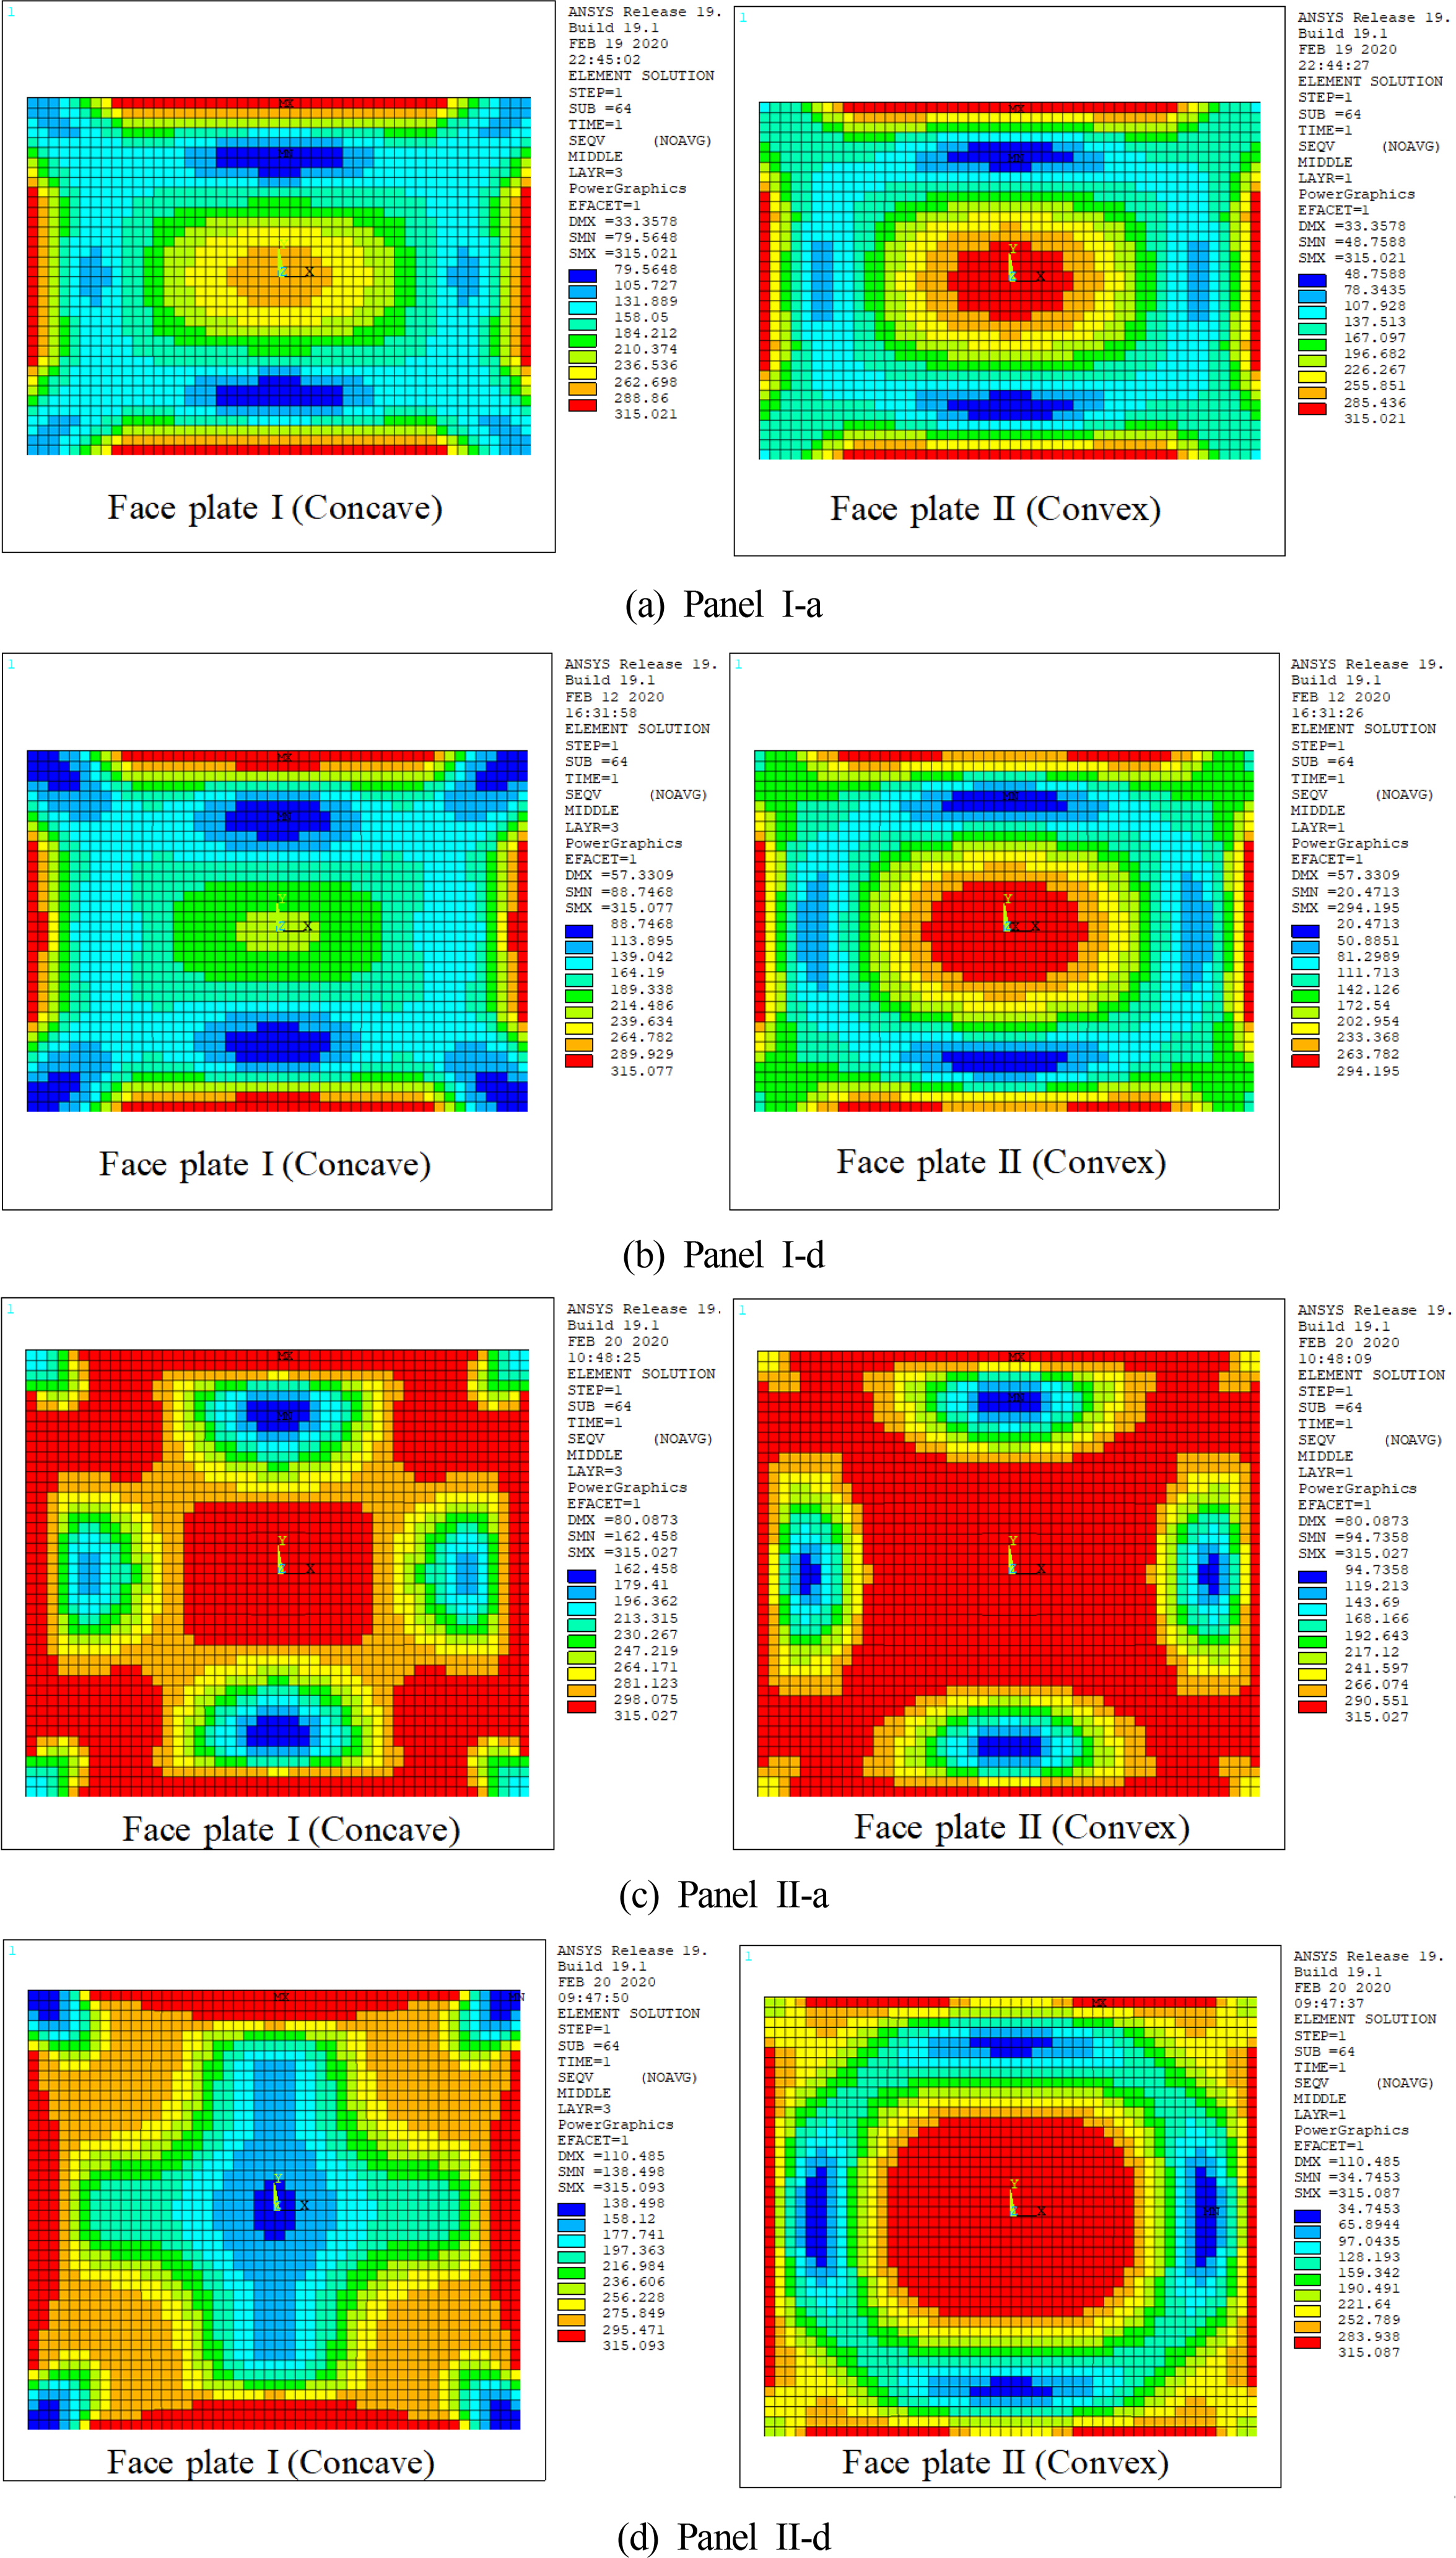
The progressive yielding pattern for panel I-d with clear strength degradation after the ultimate strength is shown in Fig. 10. With the increasing in-plane compression load, yielding occurs continuously on the face plate I along the y-axis from the center to the edges. On the face plate II as well, the ultimate strength is reached as the yielding of the edges and center are combined right before the ultimate strength is reached. This progressive yielding pattern is consistent with the previous study. In Fig. 7, the same strength degradation was observed in the panels after reaching the ultimate strength. The same progressive yielding patterns could be also found for panels I-a, II-a, and I-b. The yielding pattern for panel I-a is shown in Fig. 11 while the yielding pattern for panel II-a is shown in Fig. 12. Only the yielding pattern of face plate II is shown because it is the same for face plate I. The yielding pattern of panel I-b is equal to that of panel I-a. Thus, the same yielding shown in Fig. 10 occurred in all the panels. The deflection curves with locations of the yielding patterns in Figs. 10,12 (a), (b), and (c) are shown in Fig. 13. Once point (c) was passed, the deflection for the increased in-plane compression load increased sharply. In the case of panels I-a, II-a, and I-b, it will be reasonable to find point (c) and evaluate the threshold using the ultimate strength.
The maximum deflection at the center of each sandwich panel under a lateral pressure of 0.3 MPa is shown in Fig. 14. When a lateral pressure of 0.15 MPa was applied to the panel, the maximum deflection increased almost linearly. However, when the lateral pressure of 0.3 MPa was applied, the deflection did no increase linearly. Particularly for panels with a breadth of 4,275 mm, the deflection increased sharply when the lateral pressure was close to 0.3 MPa. The deflections under lateral pressure showed a very large difference between the widths of 3,420 mm and 4,275 mm even though the difference was roughly equal to a single space of longitudinal stiffeners in the stiffened plate structure. It can be seen that after applying a lateral pressure of 0.3 MPa, high stress due to lateral pressure occurred at the edges and center of every panel. Excluding panels I-b and I-c, yielding occurred at the center of face plate II (Convex). In Fig. 15, the von Mises stress distributions of panel I-a, I-d, II-a, and II-d are shown. Only the case of BC#1 is shown in Fig. 15, but a similar stress distribution was observed in BC#2 as well. Similar stress distributions were observed in panels I-b, I-c, II-b, and II-c, but there were fewer yielded areas, and yielding did not progress to the center of the face plate II in the case of panels I-b and I-c. The reason for this is that panels I-a and II-a have the largest bending rigidity, but they have the smallest thickness of the face plate, whereas panels I-d and II-d have large thickness face plates, but has the smallest bending rigidity, resulting in high stress. The panel with a breadth of 4,275 mm is considered to show a greater effect of the lateral pressure. This is thought to be the reason that the deflection of the panel increases sharply as shown in Fig. 14.
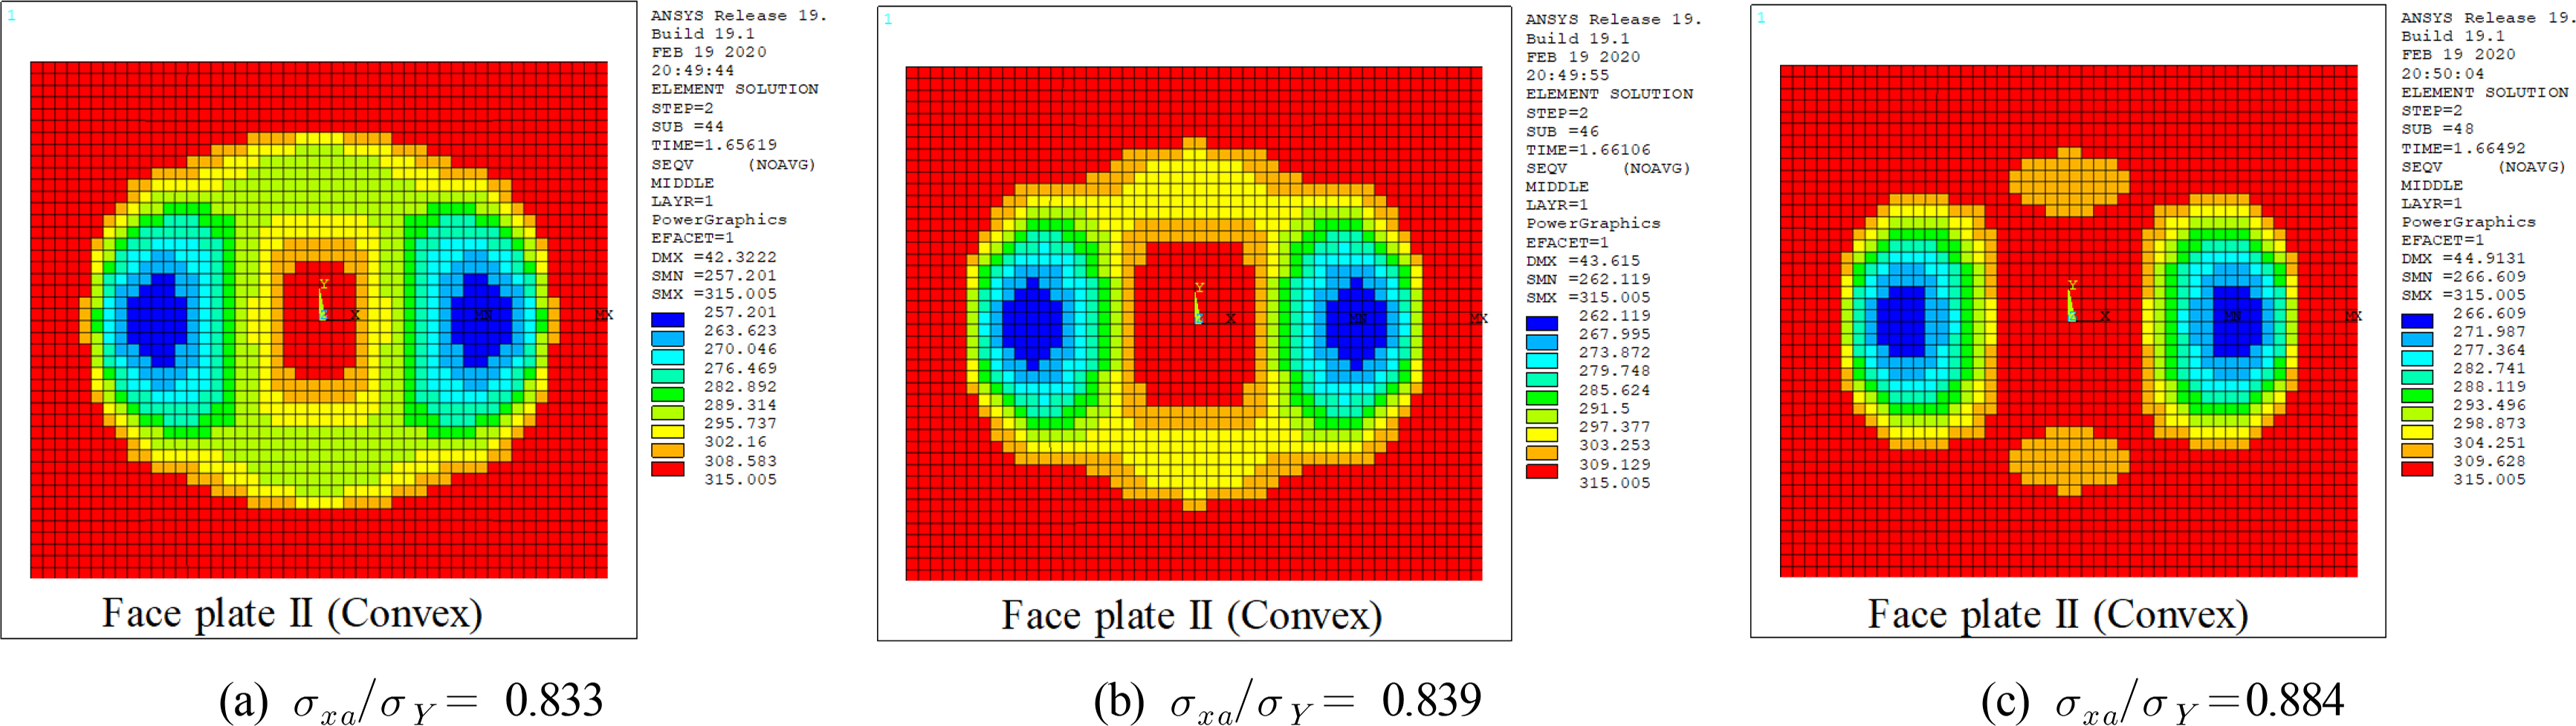
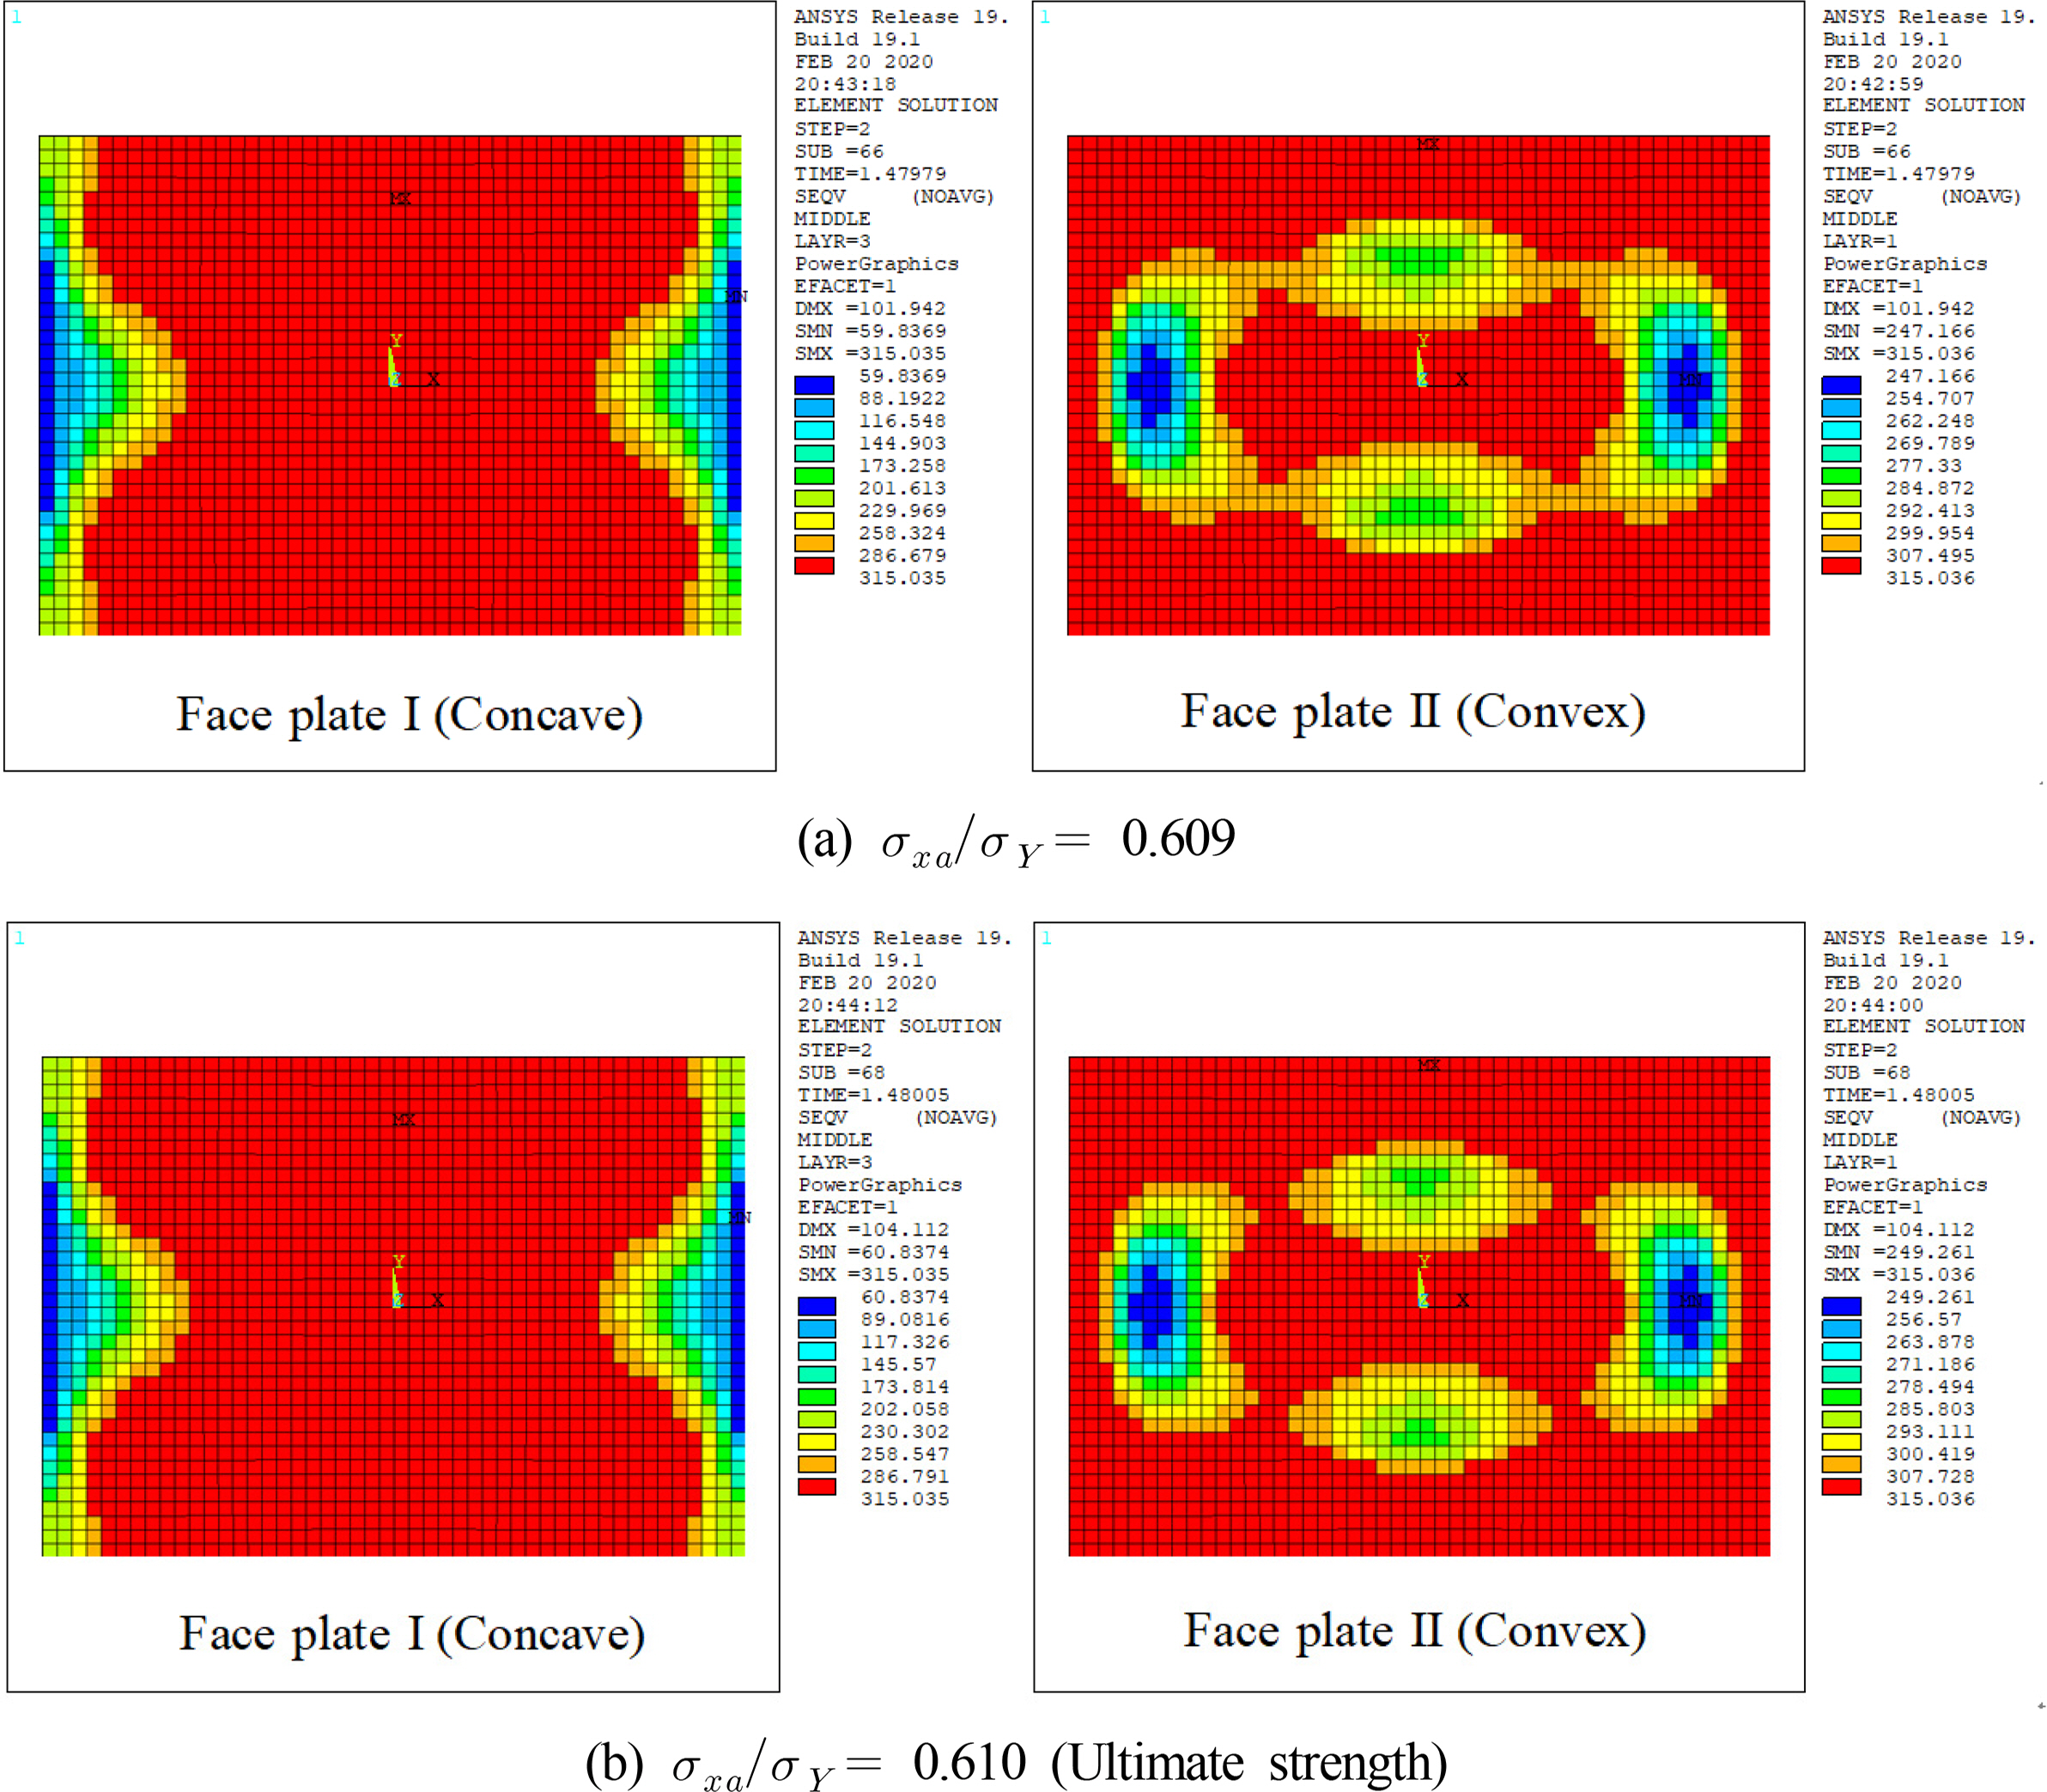
To define the ultimate strength of the panel under a lateral pressure of 0.3 MPa and an in-plane compression load, the progressive yielding patterns of face plates were investigated again. First, in the case of panel I-c, which is BC#2 in Fig. 8, strength degradation occurred when the normalized deflection was less than 2. The yielding pattern of the face plate at the threshold was as shown in Fig. 16. The yielding pattern in Fig. 16 was as follows. With the increasing in-plane compression load, which has the same yielding pattern as the one in Figs. 10,12, yielding in face plate I occurred continuously along the y-axis from the center to the edges of the panel. Subsequently, the ultimate strength was reached again as the yielding of the center and edges of the panel were interlinked in face plate II. Thus, the ultimate strength of each panel can be defined in the same way as shown in Fig. 17. As confirmed in Fig. 15, the ultimate strength was relatively lower in the case of panels I-a, I-d, II-a, and II-d in which yielding at the center of the panel progressed to some extent due to a lateral load, as shown in Fig. 15. The ultimate strength was particularly low for panel II-a due to the reason that yielding progressed considerably on both sides of the face plate due to the lateral load.

4. Applicability of the Ultimate Strength Design Formula

The ultimate strength (σxu) of sandwich panels calculated using the nonlinear FEA method was compared with the ultimate strength design formula derived in a previous study (Kim, 2019). Table 5 outlines the results of the ultimate strength design formula and the FEA results. Since the ultimate strength design formula corresponds to the boundary condition of BC#1, only the FEA results for BC#1 are shown in this table. In the case of panels II-a and II-d with widths of 4,275 mm each, yielding occurred widely at the center of the face plate due to lateral pressure, 0.0 was written for the ultimate strength design formula because the ultimate strength criterion was already met before the in-plane compression load was applied.
Fig. 18 shows the ultimate strength according to the thickness variations of the face plate of sandwich panels. The nonlinear FEA results matched relatively well with the results of the ultimate strength design formula. However, when the panel width was 4,275 mm and the lateral pressure was 0.3 MPa, the ultimate strength design formula underestimated the ultimate strength compared to the FEA. This indicates that when a large deflection behavior is governing, the ultimate strength design formula that was derived using the primary shear deformation plate theory and small deflection theory evaluates the ultimate strength very conservatively. When we review the above-mentioned FEA results, in the case of panels II-a and II-d, the lateral deflection of the panel increased sharply due to the lateral pressure, as shown in Fig. 14. Furthermore, as shown in Fig. 15, considerable yielding occurred at the edge and center of the panel, but the ultimate strength was reached by receiving an additional in-plane compression load. However, the ultimate strength design formula determines that the ultimate strength was reached only using lateral pressure. For this reason, when the panel width is 4,275 mm and the lateral pressure is 0.3 MPa, the result of the ultimate strength design formula is undervalued compared to the FEA result. In the case of panels II-b and II-c as well, the ultimate strengths predicted by the formula are approximately 51% and 36% of the FEA results, respectively. By the same token, the ultimate strength design formula also evaluates the ultimate strength conservatively for the panels that have large bending rigidity and small thickness face plates (I-a and II-a) and the panels that have a large thickness face plates and low bending rigidity (I-d and II-d). However, excluding the panel with a width of 4,275 mm and lateral pressure of 0.3 MPa, the formula predicts the ultimate strength at approximately 95.3% compared to the FEA result (standard deviation 6.5%). Therefore, the formula is considered to have excellent applicability.

5. Conclusions

To improve the design technique for sandwich panel structures that are increasingly applied to ship and offshore installations, we selected sandwich panels that have the same weights as those of the existing stiffened plate structures for the inner bottom of a Suezmax-class tanker. Then the ultimate strength behavior characteristics were analyzed using nonlinear FEA and verified by comparing them with the results of the ultimate strength design formula. Hence, we obtained the following insights and conclusions.
  1. For sandwich panels under in-plane edge compression and lateral pressure with clamped edges, it was sometimes difficult to define the ultimate strength by using nonlinear FEA technique with four-node layered shell elements because the threshold and strength degradation were not clear.

  2. The threshold and strength degradation were not clear when the bending rigidity was large and the lateral deflection was small as well as when the lateral load and lateral deflection were large. In this case, the ultimate strength could be defined by analyzing the progressive yielding pattern of the face plate.

  3. (The analysis result of the progressive yielding pattern showed that the ultimate strength was reached when yielding occurred continuously along the y-axis from the center to the edges on the face plates of both sides due to lateral pressure and in-plane compression loads.

  4. When the boundary condition for the four edges of the sandwich panels was set to maintain a straight line (BC#1) and to allow free in-plane displacement (BC#2), the deflection behaviors and ultimate strength characteristics of the panels were almost the same if the lateral deflection was not large (approximately w/T < 1.0).

  5. The ultimate strength of sandwich panels with breadth of 3,420 mm and 4,275 mm as an alternative to stiffened plates of the inner bottom structure of Suezmax-class tanker with a transverse web frame spacing of 4,800 mm was obtained by nonlinear FEA technique and ultimate strength design formula, and then it was found that the ultimate strength was higher when the breadth of the sandwich panel was 3,420 mm (a/b ≈ 1.4) than when it was 4,275 mm (a/b ≈ 1.1).

  6. It was found it was necessary to select an appropriate face plate thickness and core thickness considering lateral pressure rather than maximizing the bending rigidity using a thick core and thin face plate.

  7. The ultimate strength design formula developed in a previous study evaluated the ultimate strength relatively conservatively, governed by a large deflection behavior. Additional research is required to verify the appropriate application scope in this regard.

  8. Detailed FEA procedures to evaluate the ultimate strength of the sandwich panels need to be developed which requires additional research.

  9. The sandwich panels with high lateral pressures and large deflections are likely to generate delamination of the core and face plate, and cause damage to the core; this requires additional research.

  10. The findings of this study are expected to be applicable to various studies required to design and build ships and offshore plant facilities by applying sandwich panels.

Acknowledgements

This work was supported by a 2-Year Research Grant of Pusan National University.

Notes

Author name ORCID Contributions
Kim, Bong Ju 0000-0002-8234-1030 ①②③④⑤
Conceived of the presented idea or developed the theory
Carried out the experiment or collected the data
Performed the analytic calculations or numerical simulations
Wrote the manuscript
Supervised the findings of this study

Fig. 1.
Schematic diagram of general stiffened panel structures
joet-34-2-97f1.jpg
Fig. 2.
Lateral pressure distribution of the Suexmax-class tanker in ballast and full load condition (Kim et al., 2013)
joet-34-2-97f2.jpg
Fig. 3.
A general structure arrangement of sandwich panels and conventional stiffened panels (SPS Technology, 2020)
joet-34-2-97f3.jpg
Fig. 4.
A schematic diagram of the sandwich panel arrangement (Ramakrishnan and Sunil Kumar, 2016)
joet-34-2-97f4.jpg
Fig. 5.
Finite element modeling for rectangular sandwich panels with clamped boundary edges
joet-34-2-97f5.jpg
Fig. 6.
Schematic patterns of edge deformation according to the boundary conditions (BC)
joet-34-2-97f6.jpg
Fig. 7.
Load-deflection curves of sandwich panels under in-plane edge compression and lateral pressure with clamped edges (p = 0.15 MPa)
joet-34-2-97f7.jpg
Fig. 8.
Load-deflection curves of sandwich panels under in-plane edge compression and lateral pressure with clamped edges (p = 0.3 MPa)
joet-34-2-97f8.jpg
Fig. 9.
Load-deflection curves of sandwich panels under only lateral pressure with clamped edges (p = 0.15 MPa)
joet-34-2-97f9.jpg
Fig. 10.
Progressive yielding of the face plates of sandwich panel I-d under in-plane edge compression and lateral pressure with clamped edges (BC#1, p = 0.15 MPa)
joet-34-2-97f10.jpg
Fig. 11.
Progressive yielding of the face plate II (Convex) of sandwich panel I-a under in-plane edge compression and lateral pressure with clamped edges (BC#1, p = 0.15 MPa)
joet-34-2-97f11.jpg
Fig. 12.
Progressive yielding of the face plate II (Convex) of sandwich panel II-a under in-plane edge compression and lateral pressure with clamped edges (BC#1, p = 0.15 MPa)
joet-34-2-97f12.jpg
Fig. 13.
Progressive yielding of the face plates of sandwich panels (I-a, I-b and I-d) under in-plane edge compression and lateral pressure with clamped edges (BC#1)
joet-34-2-97f13.jpg
Fig. 14.
Load-deflection curves of sandwich panels under only lateral pressure with clamped edges (p = 0.3 MPa)
joet-34-2-97f14.jpg
Fig. 15.
The von Mises stress distribution of sandwich panels with clamped edges under lateral pressure (BC#1, p = 0.3 MPa)
joet-34-2-97f15.jpg
Fig. 16.
Progressive yielding of the face plates of sandwich panel I-c under in-plane edge compression and lateral pressure with clamped edges (BC#2, p = 0.3 MPa)
joet-34-2-97f16.jpg
Fig. 17.
Ultimate strength of sandwich panels under in-plane edge compression and lateral pressure with clamped edges defined by progressive yielding (p = 0.3 MPa)
joet-34-2-97f17.jpg
Fig. 18.
The ultimate strength comparisons of the design formula with FEA results for sandwich panels under in-plane edge compression and lateral pressure with clamped edges
joet-34-2-97f18.jpg
Table 1.
Principal dimensions of the target structure
Ls(m) Bs (m) D (m) Cb
261.0 48.0 23.2 0.843

Note: Ls, Ship legnth; Bs, Ship breadth; D, Ship depth; Cb, Block coefficient

Table 2.
Properties of the stiffened panels of Suezmax-class tanker with net scantlings
Suezmax class tanker a (mm) b (mm) B (mm) t (mm) Stiff. type No. of stiff. hw (mm) tw(mm) bf (mm) tf (mm) σY (MPa)

Plate Stiff.
Inner bottom (I.B.) 4,800 855 17,100 14.84 Tee 19 504 8.0 146.5 20.5 315 355
Outer bottom (O.B.) 4,800 855 17,100 19.49 Tee 19 503 8.5 147.0 21.0 315 355

Note: a, Length of stiffened panel; b, Breadth between longitudinal stiffeners; B, Breadth of stiffened panel; t, Plate thickness; σY, Yield strength

Table 3.
Selected sandwich panels in the present study
Panel no. a (mm) b (mm) a/b Face plate Core

tf (mm) E (GPa) v σY (MPa) ρp (kg/m3) tc (mm) Ec (MPa) vc ρc (kg/m3)
I-a 4,800 3,420 1.4 4.0 206 0.3 315 7,850 100.0 748 0.26 1,150
I-b 5.5 79.6
I-c 7.0 59.1
I-d 8.0 45.4
II-a 4,800 4,275 1.1 4.0 100.0
II-b 5.5 79.6
II-c 7.0 59.1
II-d 8.0 45.4
Table 4.
Details of clamped edge boundary conditions in the present study
BC number Node location Boundary conditions
BC#1 y = ± b/2 uz = rotx = 0, uy = const.
y = ± a/2 uz = roty = 0, ux = const.
x = 0, y = ± b/2 ux = 0
x = ± a//2, y = 0 uy = 0
BC#2 y = ± b/2 uz = rotx = 0, uy = free
y = ± a/2 uz = roty = 0, ux = free
x = 0, y = ± b/2 ux = 0
x = ± a//2, y = 0 uy = 0
Table 5.
Ultimate strength of sandwich panels obtained by nolinera FEA and design formula
a (mm) b (mm) tf (mm) tc (mm) p (MPa) σxu/σY Formula/FEA Panel no.

FEA (ANSYS) Formula
4,800 3,420 4.0 100.0 0.15 0.971 0.906 0.933 I-a
5.5 79.6 0.952 0.919 0.965 I-b
7.0 59.1 0.918 0.899 0.979 I-c
8.0 45.4 0.848 0.846 0.998 I-d

4.0 100.0 0.30 0.654 0.562 0.859 I-a
5.5 79.6 0.687 0.645 0.939 I-b
7.0 59.1 0.620 0.583 0.940 I-c
8.0 45.4 0.539 0.438 0.813 I-d

4,275 4.0 100.0 0.15 0.854 0.825 0.966 II-a
5.5 79.6 0.825 0.839 1.017 II-b
7.0 59.1 0.738 0.774 1.049 II-c
8.0 45.4 0.648 0.636 0.981 II-d

4.0 100.0 0.3 0.063 0.000 0.000 II-a
5.5 79.6 0.416 0.213 0.512 II-b
7.0 59.1 0.379 0.135 0.356 II-c
8.0 45.4 0.299 0.000 0.000 II-d

Note: E = 206 GPa, v = 0.3, σY = 315 MPa, Ec = 748 MPa, v = 0.26

References

ANSYS. (1999). Theory Reference (Release 5.6), Canonsburg, PA. ANSYS Inc.

Brooking, MA., & Kennedy, SJ. 2004 The Performance, Safety and Production Benefits of SPS Structures for Double Hull Tankers. International Coference on Design & Operation of Double Hull Tankers, Royal Institution of Naval Architects London, UK.
crossref
DNV-GL. (2016). Steel Sandwich Panel Construction (DNVGLCG-0154). Retrieved September 2019 from: https://rules.dnvgl.com/docs/pdf/DNVGL/CG/201604/DNVGL-CG-0154.pdf

Lloyd’s Register (LR). (2019). Rules for the Application of Sandwich Panel Construction to Ship Structure, Boca Raton, FL.

Kim, BJ. (2019). Analytical Solution for the Ultimate Strength of Sandwich Panels under In-plane Compression and Lateral Pressure. Journal of Ocean Engineering and Technology, 33(6), 535-546. https://doi.org/10.26748/KSOE.2019.087
crossref pdf
Kim, DK., Park, DH., Kim, HB., Kim, BJ., Seo, JK., & Paik, JK. (2013). Lateral Pressure Effects on the Progressive Hull Collapse Behaviour of a Suezmax-class Tanker under Vertical Bending Moments. Ocean Engineering, 63, 112-121. https://doi.org/10.1016/j.oceaneng.2012.12.040
crossref
Kim, DK., Kim, HB., Zhang, X., Li, CG., & Paik, JK. (2014). Ultimate Strength Performance of Tankers associated with Industry Corrosion Addition Ppractices. International Journal of Naval Architecture and Ocean Engineering, 6(3), 507-528. https://doi.org/10.2478/IJNAOE-2013-0196
crossref
Kim, UN., & Jang, JT. (2017). A Study on the Strength Evaluation Method of Plate Structures with Penetration-holes. Journal of the Society of Naval Architects of Korea, 54(6), 476-484. https://doi.org/10.3744/SNAK.2017.54.6.476
crossref
Momcilovic, N., & Motok, M. (2009). Estimation of Ship Lightweight Reduction by Means of Application of Sandwich Plate System. FME Transactions, 37(3), 123-128. Retrieved February 2020 from https://www.mas.bg.ac.rs/_media/istrazivanje/fme/vol37/3/03_mmotok.pdf

Ramakrishna, KV., & Sunil Kumar, PG. (2016). Applications of Sandwich Plate System for Ship Structures. IOSR Journal of Mechanical and Civil Engineering, International Conference on Emerging Trends in Engineering & Management. 83-90. Retrieved February 2020 from http://www.iosrjournals.org/iosrjmce/papers/ICETEM/Vol.%201%20Issue%204/60-83-90.pdf

SPS Technology. (2020). What is SPS. Retrieved February 2020 from https://www.spstechnology.com/what-is-sps

TOOLS
Share :
Facebook Twitter Linked In Google+ Line it
METRICS Graph View
  • 0 Crossref
  •   Scopus
  • 3,479 View
  • 65 Download


ABOUT
BROWSE ARTICLES
ARTICLE CATEGORY

Browse all articles >

PUBLICATION ETHICS
FOR CONTRIBUTORS
Editorial Office
President Office BD Rm. 1302, 13 Jungang-daero 180beon-gil, Dong-gu, Busan 48821, Republic of Korea
Tel: +82-51-759-0656    Fax: +82-51-759-0656    E-mail: ksoehj@ksoe.or.kr                

Copyright © 2024 by The Korean Society of Ocean Engineers.

Developed in M2PI

Close layer
prev next