J. Ocean Eng. Technol. Search

CLOSE


J. Ocean Eng. Technol. > Volume 28(4); 2014 > Article
Nam and Moon: Evaluation of dispersion degree of nanoparticles in TiO2/epoxy resin nanocomposites

Abstract

The purpose of this study was to evaluate the dispersion degree of particles using a nanoindentation test for titanium oxide nanoparticles/epoxy resin nanocomposites. Thus, the effects of the particle size and weight fraction, dispersion agent, and position of the sample on the modulus and degree of particle dispersion in the nanocomposites were investigated. As a result, the dispersion degree of large particles was found to be better than that of smaller particles in composites. It could be found that the aggregation or agglomeration of small particles with large surface energy occurred more easily in nanocomposites because of the large specific surface area. The moduli of the upper side of the film-shaped sample obtained from a nanoindentation test were low scattering, while the values for the bottom side were high scattering. Thus, the dispersion situation of the nanoparticles on the upper side of film-shaped samples could be considered to be better than that for the bottom side. This could be concluded due to the non-uniform nanoparticle dispersion in the same sample. The modulus obtained from nanoindentation test increased slightly with the content of nanoparticles and increased with the indented depth for the same sample. The latter is presumably due to the increase in the accumulated particles facing the indenter with the indented depth. The nanoindentation test was found to be a useful method to evaluate the dispersion status of nanoparticles in nanocomposites.

1. Introduction

Polymer/inorganic composites have been widely studied as one of the important sources for advanced materials. Polymeric materials are often reinforced by stiff fillers to improve mechanical properties. The efficiency of reinforcement depends on the aspect ratio and the mechanical properties of filler, and the adhesion between the matrix and the filler.
In the past decades, many researchers have focused on polymer nanocomposites in the potential applicability of the unique properties of materials in the nanosized system (Vollenberg and Heikens, 1989; Chan et al., 2002; Su et al., 2004; Park and Jana 2003; Gersappe 2002; Reynaud et al., 2001).
Nanocomposites show much improved mechanical properties over similar microsized systems. Because of very small size, nanoparticles have a high surface-to-volume ratio and provide high-energy surfaces. A desirable result of embedding nanoparticles into a polymer matrix is the enhanced bonding between the polymer matrix and nanoparticles, resulting from the nanoparticle’s high interfacial energy. Classical composite theory predicts that the composite mechanical properties increase monotonically with the weight fraction of particle.
Nanoparticles can significantly alter the properties of the polymer close to the particle surface due to the change in polymer chain mobility. It can enhance or restrict the chain mobility near the particle surface (Ma et al., 2005; Shah et al., 2005).
Epoxy resin is a widely used polymer matrix for advanced composites with its good stiffness, dimensional stability and chemical resistance. Also, it is widely used in the industry because easy production, light weight, high adhesive property and so on. The thermal and mechanical properties of epoxy resins as highly dependent on the cross linked three-dimensional microstructure formed during the curing process.
Many researchers found out that as the fraction of nanoparticles increases above a specific fraction level, the properties can be declined very sharply (Ou et al., 1998; Becker et al., 1996; Ash et al., 2001; Ng et al., 2001). Therefore, it is necessary to add the particles up to the specific fraction level. Specific fraction could be different according to the composites system such as particles and its sizes, particle dispersions, matrix resins, interface between particle and matrix resin and making processes. And the strengths of nanocomposites filled with high weight fraction of particle could be below the strength of neat resin due to the big particle clusters like aggregation or agglomeration (Ash et al., 2004). These clusters of nanoparticles in matrix could be defected and reduce to great mechanical properties of nanoparticles in the composites.
One major problem of nanocomposites is the uniformed dispersion of nanoparticles in the organic matrix avoiding macroscopic phase separation. And then the other problem is to evaluate the dispersion status of particles in nanocomposites. There are some methods such as the observation of optical microscope and SEM, observation of Laser Scanning Confocal Microscope(LSCM). The observation of optical microscope and SEM could be observed only small area of the surface and LSCM could be observed the small area of three dimension of sample. And evaluating area of these all methods is too small. Eventually, these methods are able to evaluate the dispersion status of particles in the micro area, not to evaluate the one in macro area of the sample.
Therefore, the purpose of this study is to evaluate the dispersion degree of particles in macro area of sample using nanoindentation test in titanium oxide nanoparticles /epoxy resin nanocomposites. So, the effects of particles size and weight fraction, dispersion agent and the position of the sample on the modulus and the dispersion degree of particles in the nanocomposites have been investigated.

2. Experimental

2.1 Materials and sample preparation

The materials used in this study are as follows. The titanium dioxide (TiO2) particles used were P25 (Evonik Degussa Co.) and Rcl9 (Millennium co.). The particle sizes for particle P25 and particle Rcl9 were approximately 20 nm and 250 nm, respectively, according to the manufacturer. There is no surface treatment for particle P25, while Al2O3 and SiO2 surface treatment is presented for particle Rcl9.
The epoxy resin used was the diglycidyl ether of the bisphenol A (DGEBA, Epon 828, Hexion co.). Aliphatic amine curing agent was used to prepare the epoxy matrix: i.e. polyoxypropylene diamine (Jeffamine D230) was used as the standard curing agent throughout this study. D230 had an average molecular weight of 230. Jeffamine D230 was obtained from Huntsman Corporation, TX, USA. And the dispersion agent for P25 nanoparticles was disper180 (Byk co).
The film-shaped sample for experimental tests of nanoparticle unfilled and filled composites were prepared as following procedures; First of all, the liquid epoxy resin was heated for about 1hr at 67℃ to lower the viscosity, and then degassed for 30 minutes in vacuum oven at 67℃. Nanoparticles measured by using balance (Metter co., 0.01mg) were added and then mixed for 30 minutes using a dispermat (Byk- Gardner) at 2000 rpm. After the mixture was degassed for 1.5 hours in a vacuum oven at 67℃, the curing agent was added and mixed by hand for 3.0 minutes using wood stick.
The liquid mixture in beaker was again degassed for 20 minutes in a vacuum oven at 67℃. After that, the liquid mixture was waited until becoming proper viscosity to form film in oven at 67℃.
The waited times were a little different according to the content of particles, e.g. in the case of unfilled one was 30 minutes. In the case of filled one, it needs to take a little longer time compared to the unfilled one. And the waited times were a little different according to the weight fraction of the filled nanoparticles and the amount of mixture.
And then the films were formed on the release paper on the vacuum plate using the drawdown technique. The formed films were cured at room temperature overnight, and then post-cured at 80℃ for 2hours and 125℃ for 3hours for a full cure in forced air circulating oven (Blue M, General Signal co.). It was allowed the samples to become cool to the room temperature in the oven before removal. The thickness of the formed films was approximately 90 μm.

2.2 Indentation test

Nanoindentation test is very useful in assessing several properties of an interfacial region and even very small local area. All nanoindentation tests were performed using a commercial nanoindenter (MTS, Nanoindenter XP). A Berkovich indenter, which has a three-sided pyramid with an area–to-depth function such as that of a Vickers indenter, was used. Loading was performed at 0.05 s−1 constant strain rate. The stiffness of the tip-sample contact was continuously measured during loading by imposing a small tip oscillation of 5 nm at a frequency of 45 Hz. The Poisson’s ratio of the nanocomposite was assumed to 0.35. Modulus was determined as the average modulus over an indentation depth 500 to 1000 nm, unless other stated, without a drift correction. The modulus reported in here was the average of 36 indents on all film-shaped samples. The indents were spaced 50μm apart in the X and Y directions. In addition, to investigate the effect of the indented depth on the modulus in nanoindentation test, modulus was measured in different indented depth such as 500 to 1000, 1500 to 2000, 2500 to 3000 and 3500 to 4000 nm.

2.3 Microscope observation

Optical microscope was used to observe nanoparticles dispersion situation in the film-shaped samples. The cover glass and oil with refraction index of approximately 1.50 were used to improve image clarify. Refraction index of the oil was almost the same as that of the matrix resin used in this study. The oil should be flowed to fill all contact area between film and the cover glass.
Laser Scanning Confocal Microscope (LSCM, Zeiss model LSM510) also was used to observe nanoparticle dispersion situation on the surface and subsurface of the film- shaped samples. The laser wavelength used in this study was 543 nm. The LSCM images presented in this paper are two-dimensional (2D) intensity projections and a single depth-profile image at a particular z-depth (depth-profile image). The 2D LSCM image is formed by summing the stack of images over the z direction, (512 pixel × 512 pixel) of the film-shaped samples. The pixel intensity level represents the total amount of back-scattered light. Darker areas represent regions scattering less light than lighter colored areas.

3. Results and Discussions

3.1 Indentation test
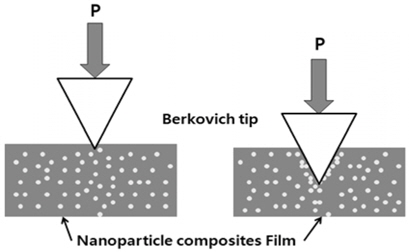
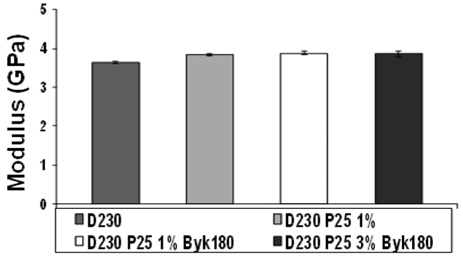
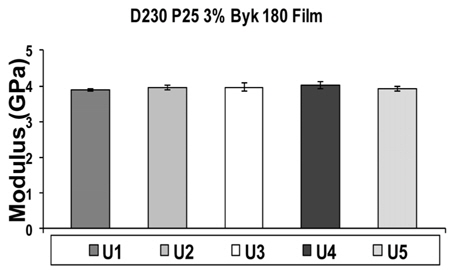
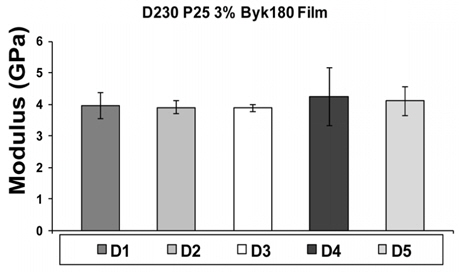
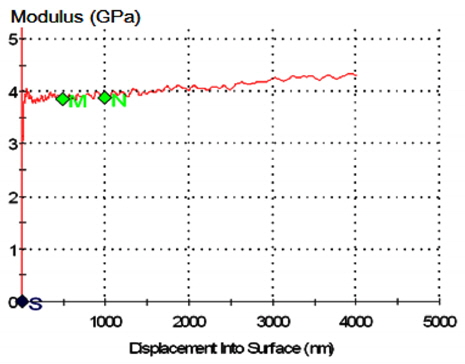
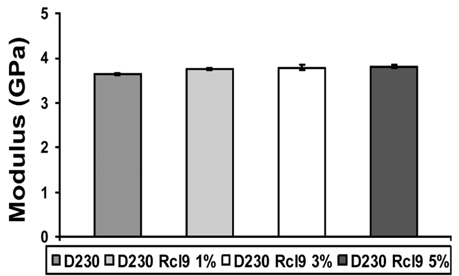
Figure 1 shows the schematic view of nanoindentation test in nanoparticles composites, and the indentation test was performed with the indented depth about 500~1000 nm. Using nanoindentation test technique, the dispersion tendency of nanoparticles in polymer could be investigated for the film-shaped samples.
Fig. 1

Schematic diagram of nanoindentation test in the nanocomposites

HOGHC7_2014_v28n4_338_f001.jpg
When the pyramid shaped indenter was pushed deeply, modulus could be changed due to the internal cumulated particles on facing indenter as seen in Fig. 1. If particles were not dispersed uniformly in polymer, the measured moduli could be big scattering. It could be have the different moduli at same sample. So, the dispersion degree of nanoparticles can be figured out through nanoindendation test. Unless otherwise stated, the modulus values of nanoindentation test showed to be measured the upper side of film-shaped sample.
Figure 2 presents the modulus of nanoindentation test of the film-shaped pure epoxy(D230) and nanocomposites(D230 P25 1%, D230 P25 1% Byk180, D230 P25 3% Byk180), which were filled with P25 particles, 1 wt%, and 1 wt% and 3 wt% with dispersant Byk180. Measured moduli of nanocomposites were higher than that of pure epoxy and increased slightly with the content of nanoparticles. Modulus of D230 P25 3% Byk180 was higher than the ones of other samples.
Fig. 2

Modulus obtained from nanoindentation test of the filmshaped samples

HOGHC7_2014_v28n4_338_f002.jpg
Unless otherwise notes, the samples of D230 P25 3% Byk180 would be used to evaluate the dispersion degree of particles using a nanoindentation test, optical microscope and laser scanning confocal microscope in the nanocomposites.
Figure 3 represents the modulus of nanoindentation test of the film-shaped sample, which was filled with P25 particles, 3 wt% with dispersant Byk180. Those average moduli were measured at different position (U1, U2, U3, U4, U5) on the upper side of film were almost same regardless of the measured position and standard deviations were also very small. This means the dispersion situation of nanoparticles on the upper surface of film-shaped sample was well.
Fig. 3

Modulus obtained from nanoindentation test on the upper side of the film-shaped sample

HOGHC7_2014_v28n4_338_f003.jpg
Figure 4 reveals the modulus of nanoindentation test of the film-shaped sample, which was filled with P25 particles, 3 wt% with dispersant Byk180. Those average moduli were measured at different position(D1, D2, D3, D4, D5) on the bottom side of film were very different at every measured position and standard deviations were also very big. This means the dispersion situation of nanoparticles on the bottom side of the film-shaped sample was worse than that of the upper side as can be seen in Fig. 3.
Fig. 4

Modulus obtained from nanoindentation test on the bottom side of the film-shaped sample

HOGHC7_2014_v28n4_338_f004.jpg
From figures 3 and 4, it could be considered that the dispersion situation of nanoparticles on the upper side of film-shaped samples was better than the one of the bottom side and nanoindentation test was one of useful methods to evaluate the dispersion status of particles in nanocomposites.
Figure 5 presents the typical curve of modulus changes for nanoindentation test according to the indented depth in nanocomposites, which was filled with P25 particles, 3 wt% with dispersant Byk180. As can be seen in Fig 5, the modulus increased slightly with the indented depth. This is presumably the cumulated particles on facing the indenter increased with the indenter depth as can be seen in Fig 1.
Fig. 5

Typical curve of modulus vs. displacement into surface in nanoindentation test

HOGHC7_2014_v28n4_338_f005.jpg
And modulus changes of nanoindentation test according to the indented depth in nanocomposites were shown in Table 1. Table 1 presents the modulus of nanoindentation test on the upper side of the film-shaped sample, which was filled with P25 particles, 3 wt% with dispersant Byk180. As mentioned in experimental section, the modulus reported in here was the average of 36 indents on all film-shaped samples. nanoindentation test was performed with the indented depth about 500~4000 nm and modulus was measured according to the indented depth.
Table 1

Modulus vs. indented depth on the upper side filmshaped samples with 3 wt% Byk180

HOGHC7_2014_v28n4_338_t001.jpg
These measured moduli increased slightly with the indented depth. This is also presumably the cumulated particles on facing the indenter increased with the indenter depth as can be seen in Fig. 1. And standard deviations were very low at each depth. This means the dispersion situation of nanoparticles on the upper side of the film-shaped sample was well.
Figure 6 shows the modulus of nanoindentation test on the upper side of film-shaped pure epoxy and nanocomposites, which were filled with 1 wt%, 3 wt% and 5 wt% of Rcl9 particles. In this figure, modulus increased slightly with the content of nanoparticles.
Fig. 6

Modulus obtained from nanoindentation test according to the weight fraction of particles

HOGHC7_2014_v28n4_338_f006.jpg
Figure 7 reveals the modulus of nanoindentation test on the upper side of film-shaped sample, which were filled with 5 wt% of Rcl9 particles. As mentioned in the experimental section, the modulus reported in here was the average of 36 indents on all film-shaped samples. nanoindentation test was performed with the indented depth about 500~4000 nm and modulus was measured according to the indented depth.
Fig. 7

Modulus obtained from the upper side of film-shaped sample with 5 wt% according to the depth of the indenter
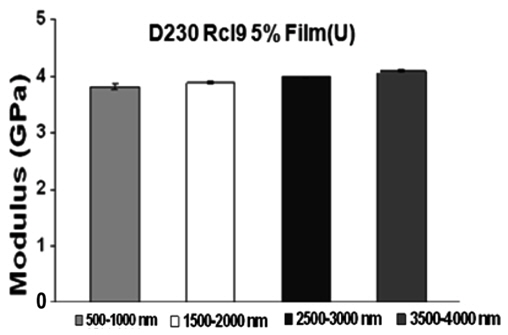
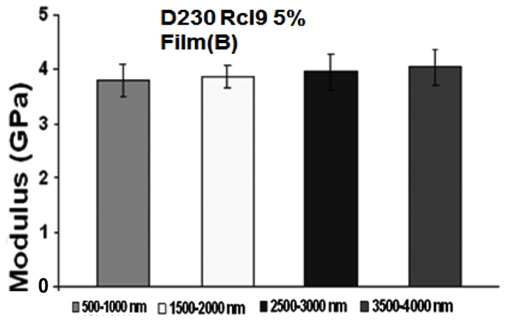
HOGHC7_2014_v28n4_338_f007.jpg
These measured moduli increased slightly with the indented depth. And standard deviations were very low at each depth. This means the dispersion situation of nanoparticles on the upper surface of film-shaped sample was well.
Figure 8 represents the modulus of nanoindentation test on the bottom side of film-shaped sample, which were filled with 5 wt% of Rcl9 particles. nanoindentation test was also performed with indented depth about 500~4000 nm and modulus measured according to the indented depth. These measured moduli increased slightly with the indented depth. This trend is the same as the result in the Fig. 7 and the reason is also same. However, standard deviations were much bigger than the ones on the upper side of film. This means the dispersion situation of nanoparticles on the bottom side of film-shaped sample was worse than that of the upper side.
Fig. 8

Modulus obtained from the bottom side of film-shaped sample with 5 wt% according to the depth of the indenter

HOGHC7_2014_v28n4_338_f008.jpg
From Fig. 3-4 and 7-8, it could be considered that the dispersion situation of nanoparticles on the upper side of film-shaped samples was better than the one of the bottom side, regardless of particle size. And the standard deviations of modulus in the small sized nanocomposites as can be seen in Fig. 3-4 were bigger than the ones in the big sized nanocomposites as seen Fig. 7-8. This means that the dispersion status of the big sized particles was better than the one of small sized particles due to the big surface energy in epoxy resin. Therefore, it could be found that nanoindentation test was one of useful methods to evaluate the dispersion status of nanoparticle in nanocomposites.

3.2 Indentation test

Using the optical microscope, it could be figured out the overall dispersion degree of particles in nanocomposites.
Figure 9 shows optical microscope photos of the upper sideof film-shaped samples, which were filled with P25 particles, 1 wt% (a), and 1 wt% and 3 wt% with dispersant Byk180(b, c).
Fig. 9

Optical microscope photos of the upper side of filmshaped samples

HOGHC7_2014_v28n4_338_f009.jpg
As can be seen in this figure, macroscopic dispersion in all samples was almost uniform, but microscopic dispersion was non-uniform. Comparing (a) with (b), in spite of using the same weight fraction, it was different from the sizes and numbers of clusters.
Dispersion status of nanoparticles in the sample with dispersant Byk180 was better than the one of sample with no dispersant. Big particle clusters size were about 10~20 μm. In the case of (c), it was bigger clusters than (b).
Figure 10 presents optical microscope photos of film-shaped sample, which was filled with P25 particles, 3 wt% with dispersant Byk180. Those photos show dispersion status of nanoparticles on the upper side and bottom side surface of film-shaped sample. As can be seen in this figure, the big clusters were formed much more in the bottom side (b) than the upper side (a) of the film. It is shown to difference in the degree of dispersion between the upper side and bottom side of film-shaped sample, also supported the results of nanoindentation test in Fig. 3-4.
Fig. 10

Optical microscope photos of film-shaped samples with 3 wt% Byk 180

HOGHC7_2014_v28n4_338_f010.jpg
Fig. 11 reveals the photos obtained from Laser scanning confocal microscope, (a) and (b) were the ones of before and after the indentation test. (a) was the nanoparticles dispersion photo of 4 μm subsurface of the upper-side in the film-shaped nanocomposites, which was filled with particles of P25, 3 wt% with dispersant Byk180, and shows the dispersion status of nanoparticle clusters in the subsurface layer of nanocomposites. It could be found that the dispersion status of particles affected strongly the results of nanoindetation test.
Fig. 11

LSCM photos of upper-side of film-shaped sample with 3 wt% Byk180

HOGHC7_2014_v28n4_338_f011.jpg
Figure 12 shows optical microscope photos of the upper side of film-shaped samples which was filled with 1 wt% of Rcl9 particles. In this figure, (a) was low magnification and (b) is high magnification photos of the same sample. In this figure, macroscopic dispersion was almost uniform, but microscopic dispersion was non-uniform with many small clusters. There were also resin and particles rich regions.
Fig. 12

Optical microscope photos of the upper side of filmshaped samples with 1 wt.%

HOGHC7_2014_v28n4_338_f012.jpg
Figure 13 presents optical microscope photos of film-shaped samples which were filled with 3 wt% and 5 wt% of Rcl9 particles. Those photos show the dispersion status of nanoparticle on the upper side of film-shaped sample. It is found that the large clusters were formed in film-shaped samples with 3 and 5 wt% of Rcl9 particles. This means the fraction of particles become above 1 wt%, the large clusters were formed. This contest of particles is probably a specific fraction level in this nanocomposites system.
Fig. 13

Optical microscope photos of film-shaped samples

HOGHC7_2014_v28n4_338_f013.jpg
In Fig. 9, 12 and 13, the dispersion situation of nanoparticles between the small and big size particles in the film-shaped sample was different. That is, the dispersion degree of big size particles was better than the one of small size particles in composites. Compared with the dispersion degree of big size particles in samples, it was found many big clusters like aggregation or agglomeration in small size particles nanocomposites. It could be found that the aggregation or agglomeration in small size particles with big surface energy owing to big specific surface area could be formed easily in nanocomposites

4. Conclusions

The purpose of this study is to evaluate the dispersion degree of particles using nanoindentation test in titanium oxide nanoparticles /epoxy resin nanocomposites. So, the effects of particle size and weight fraction, dispersion agent and the position of the sample on the modulus and the degree of particles dispersion in the nanocomposites have been investigated. The results were as follows.
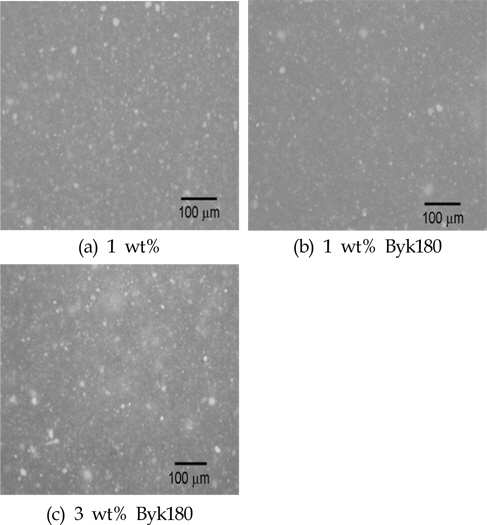
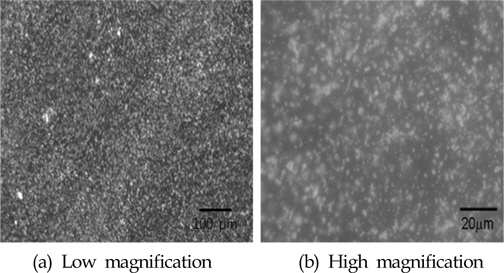
  • (1) The dispersion degree of big size particles was better than the one of small size particles in nanocomposites. It could be found that the aggregation or agglomeration in small size particles with big surface energy owing to big specific surface area could be formed easily in nanocomposites.

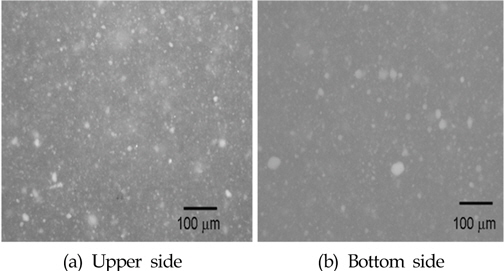
  • (2) Moduli of the upper side in the film-shaped sample obtained from nanoindentation test were low scattering, while the values of the bottom side were high scattering. It could be considered that the dispersion situation of nanoparticles on the upper side of film-shaped samples was better than the one of the bottom side. It could be concluded due to the non-uniformed nanoparticles dispersion in the same sample

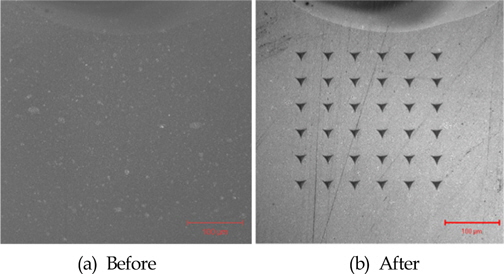
  • (3) Modulus obtained from nanoindentation test increased slightly with the content of nanoparticles and increased with the indented depth at the same sample. The latter is presumably due to the cumulated particles facing indenter increased with the indented depth.

  • (4) The nanoindentation test was one of useful methods to evaluate the dispersion status of nanoparticles in nanocomposites could be considered.

References

Ash, B.J., Stone, J., Rogers, D.F., Schadler, L.S., Siegel., Appl. (Investigation into the Thermal and Mechanical Beha- vior of PMMA/Alumina Nanocomposites, Materials Research Society Symposium Proceedings, 661, 2001). KK2.10.1-KK2.10.6.
crossref
Ash., B.J., Richard, W.S., Linda, S.S. (Mechanical Behavior of Alumina/Poly (methyl methacrylate) Nanocomposites, Macromolecules, 37, 2004). 1358-1369 http://dx.doi.org/10.1021/ma0354400.
crossref
Becker, C., Krug, H., Schmidt, H. (Tailoring of Thermomech-Anical Properties of Thermoplastic Nanocomposite by Surface Modification of Nanoscale Silica Particles, Materials Research Society Symposium Proceedings, 435, 1996). 237-242 http://dx.doi.org/10.1557/PROC-435-237.
crossref
Chan, C.M., W, J., Li, J.X., Cheung, Y.-K. (Polypropylene/Calcium Carbonate Nanocomposites, Polymer, 43(10):2002). 2981-2992 http://dx.doi.org/10.1016/S0032-3861(02)00120-9.
crossref
Gersappe, D.. (Molecular Mechanisms of Failure in Polymer Nanocomposites, Physics Review. Letters, 89, 2002). 058301-1-4 http://dx.doi.org/10.1103/PhysRevLett.89.058301.
crossref
Ma, D., Akpalu, Y.A., Li, Y., Siegel, R.W., Schadler, L.S. (Effect of Titania Nanoparticles on the Morphology of Low Density Polyethylene, Journal of Polymer Science Part B: Polymer Physics, 43, 2005). 488-497 http://dx.doi.org/10.1002/polb.20341.
crossref
Ng, C.B., Ash, B.J., Schadler, L.S., Siegel, R.W. (A Study of the Mechanical and Permeability Properties of Nano- and Micron-2 Filled Epoxy Composites, Advanced Composites Letters, 10, 2001). 101-111.

Ou, Y., Yang, F., Yu, Z. (A New Conception on the Toughness of Nylon 6/Silica Nanocomposite Prepared Via in Situ Polymerization, Journal of Polymer Science Part B, 36, 1998). 789-795 http://dx.doi.org/10.1002/(SICI)1099-0488(19980415)36:5<789::AID-POLB6>3.0.CO;2-G.
crossref
Park, J.H., Jana, S.C. (The Relationship Between Nano- and Micro-structures and Mechanical Properties in PMMA-epoxy-nanoclay Composites, Polymer, 44, 2003). 2091-2100 http://dx.doi.org/10.1016/S0032-3861(03)00075-2.
crossref
Reynaud, E., Jouen, T., Gauthier, C., Vigier, G., Varlet, J. (Nanofillers in Polymeric Matrix: a Study on Silica Reinforced PA6, Journal of Polymer, 42, 2001). 8759-8768 http://dx.doi.org/10.1016/S0032-3861(01)00446-3.
crossref
Shah, D., Maiti, P., Jiang, D.D., Batt, C.A., Giannelis, E.P. (Effect of Nanoparticle Mobility on Toughness of Polymer Nanocomposites, Advanced Materials, 17(5):2005). 525-528 http://dx.doi.org/10.1002/adma.200400984.
crossref
Su, S., Jiang, D.D., Wilkie, C.A. (Methacrylate Modified Clays and Their Polystyrene and Poly(Methyl Methacrylate) Nanocomposites, Polymers for Advanced Technologies, 15(5):2004). 225-231 http://dx.doi.org/10.1002/pat.456.
crossref
Vollenberg, P.H.T., Heikens, D.. (Particle Size Dependence of the Young's Modulus of Filled Polymers: 1. Preliminary Experiments, Polymer, 30, 1989). 1656-1662 http://dx.doi.org/10.1016/0032-3861(89)90326-1.
crossref


ABOUT
BROWSE ARTICLES
ARTICLE CATEGORY

Browse all articles >

PUBLICATION ETHICS
FOR CONTRIBUTORS
Editorial Office
President Office BD Rm. 1302, 13 Jungang-daero 180beon-gil, Dong-gu, Busan 48821, Republic of Korea
Tel: +82-51-759-0656    Fax: +82-51-759-0656    E-mail: ksoehj@ksoe.or.kr                

Copyright © 2024 by The Korean Society of Ocean Engineers.

Developed in M2PI

Close layer
prev next