Development of Empirical Formulas for Approximate Spectral Moment Based on Rain-Flow Counting Stress-Range Distribution
Article information

Abstract
Many studies have been performed to predict a reliable and accurate stress-range distribution and fatigue damage regarding the Gaussian wide-band stress response due to multi-peak waves and multiple dynamic loads. So far, most of the approximation models provide slightly inaccurate results in comparison with the rain-flow counting method as an exact solution. A step-by-step study was carried out to develop new approximate spectral moments that are close to the rain-flow counting moment, which can be used for the development of a fatigue damage model. Using the special parameters and bandwidth parameters, four kinds of parameter-based combinations were constructed and estimated using the R-squared values from regression analysis. Based on the results, four candidate empirical formulas were determined and compared with the rain-flow counting moment, probability density function, and root mean square (RMS) value for relative distance. The new approximate spectral moments were finally decided through comparison studies of eight response spectra. The new spectral moments presented in this study could play an important role in improving the accuracy of fatigue damage model development. The present study shows that the new approximate moment is a very important variable for the enhancement of Gaussian wide-band fatigue damage assessment.
1. Introduction
Much research has been performed continuously to fit a stress-range distribution and to predict fatigue damage for a Gaussian wide-band stress response. As a result, approximation models based on an empirical correction factor or numerical simulation have been proposed to solve wide-band spectrum issues. However, they still yield overestimated or underestimated fatigue damages when compared to time-domain rain-flow counting analysis.
The DNV rule (DNV, 2010) recommends cycle counting, an empirical model, and an analytic model for the Gaussian wide-band stress spectrum to carry out spectral fatigue analysis. The rain-flow counting method is mainly used for cycle counting. The Wirsching-Light correction method (Wirsching and Light, 1980), Dirlik model (Dirlik, 1985), and Single Moment method (Larsen and Lutes, 1991) were suggested as empirical models. The analytic model presents the Jiao-Moan model (Jiao and Moan, 1990) which can be applied to a narrow-band bi-modal distribution. Lloyd’s rule (LR, 2018) recommends a multi-peak short-term spectral calculation method proposed by Park et al. (2014) and Dirlik (1985) in fatigue analysis for dynamic responses such as springing or whipping.
A probability density function (PDF) for the Gaussian wide-band stress spectrum has not been defined theoretically. Instead, several efforts to develop an approximation formula that follows a numerical simulation-based rain-flow counting stress distribution have been carried out (Rychlik, 1987; Zhao and Baker, 1992). Larsen and Lutes (1991) developed The Single Moment model that is applicable to a wide-band spectrum. This model considers the generalized 2/m-order spectral moment using the slope m of the S-N curve. However, since it cannot reflect the interaction between low-frequency and high-frequency modes, the accuracy of fatigue damage is low.
Recently, a mathematical re-interpretation of a Single Moment model was attempted using a projection by projection (PbP) approach, which is called a nonlinear coupling rule (Benasciutti et al., 2013). This method discretizes a wide-band stress response spectrum into a myriad of small bands. Assuming that each small band is an independent narrow band for the frequency domain, it estimates cumulative fatigue damage using the spectral discretization method and Rayleigh PDF. Gao and Zheng (2019) derived a quadratic coupling method with three variables through numerical simulation and rain-flow counting to solve the inaccuracy of a bi-modal spectrum sincethe Single Moment model overlooks the interaction between low-frequency and high-frequency modes. Zheng et al. (2020) extended the bi-modal process to a tri-modal process based on a discrete spectral method and coupling coefficient equation.
Research results have recently shown that the accuracy of fatigue damage prediction for a numerical simulation-based approximate empirical model is relatively low. Research works for bi-modal or tri-modal spectra have been actively carried out for the development of a new method. For the Dirlik, Benasciutti, and Park models, associated research for numerical simulation-based approximations has been sluggish for a long time. For this reason, we attempted to develop empirical formulas by adopting new approximate spectral moments to improve the accuracy of prediction of the stress-range distribution and fatigue damages for a wide-band spectrum through analysis of other research, which can be easily applied to actual project engineering.
Fig. 1 shows an example of the rain-flow counting stress-range distribution for a Gaussian wide-band spectrum. As shown in the figure, the stress range is categorized into a low range, medium range, and high range. To enhance the accuracy of fatigue damage assessment, it is necessary to reflect the characteristics of the rain-flow counting distribution very well. First of all, it is necessary to determine the approximate spectral moment that is close to the simulation-based rain-flow counting moment. The new approximate spectral moment is highly important because it is considered as the input variable in the constitutive equation of the fatigue model. So far, no research has been published that defines the rain-flow counting moment as a theoretical solution. From the results of recent research, the rain-flow counting moment is defined as the spectral moment or bandwidth parameter, but it can be seen that there is a limit to increasing the accuracy of fatigue damage.
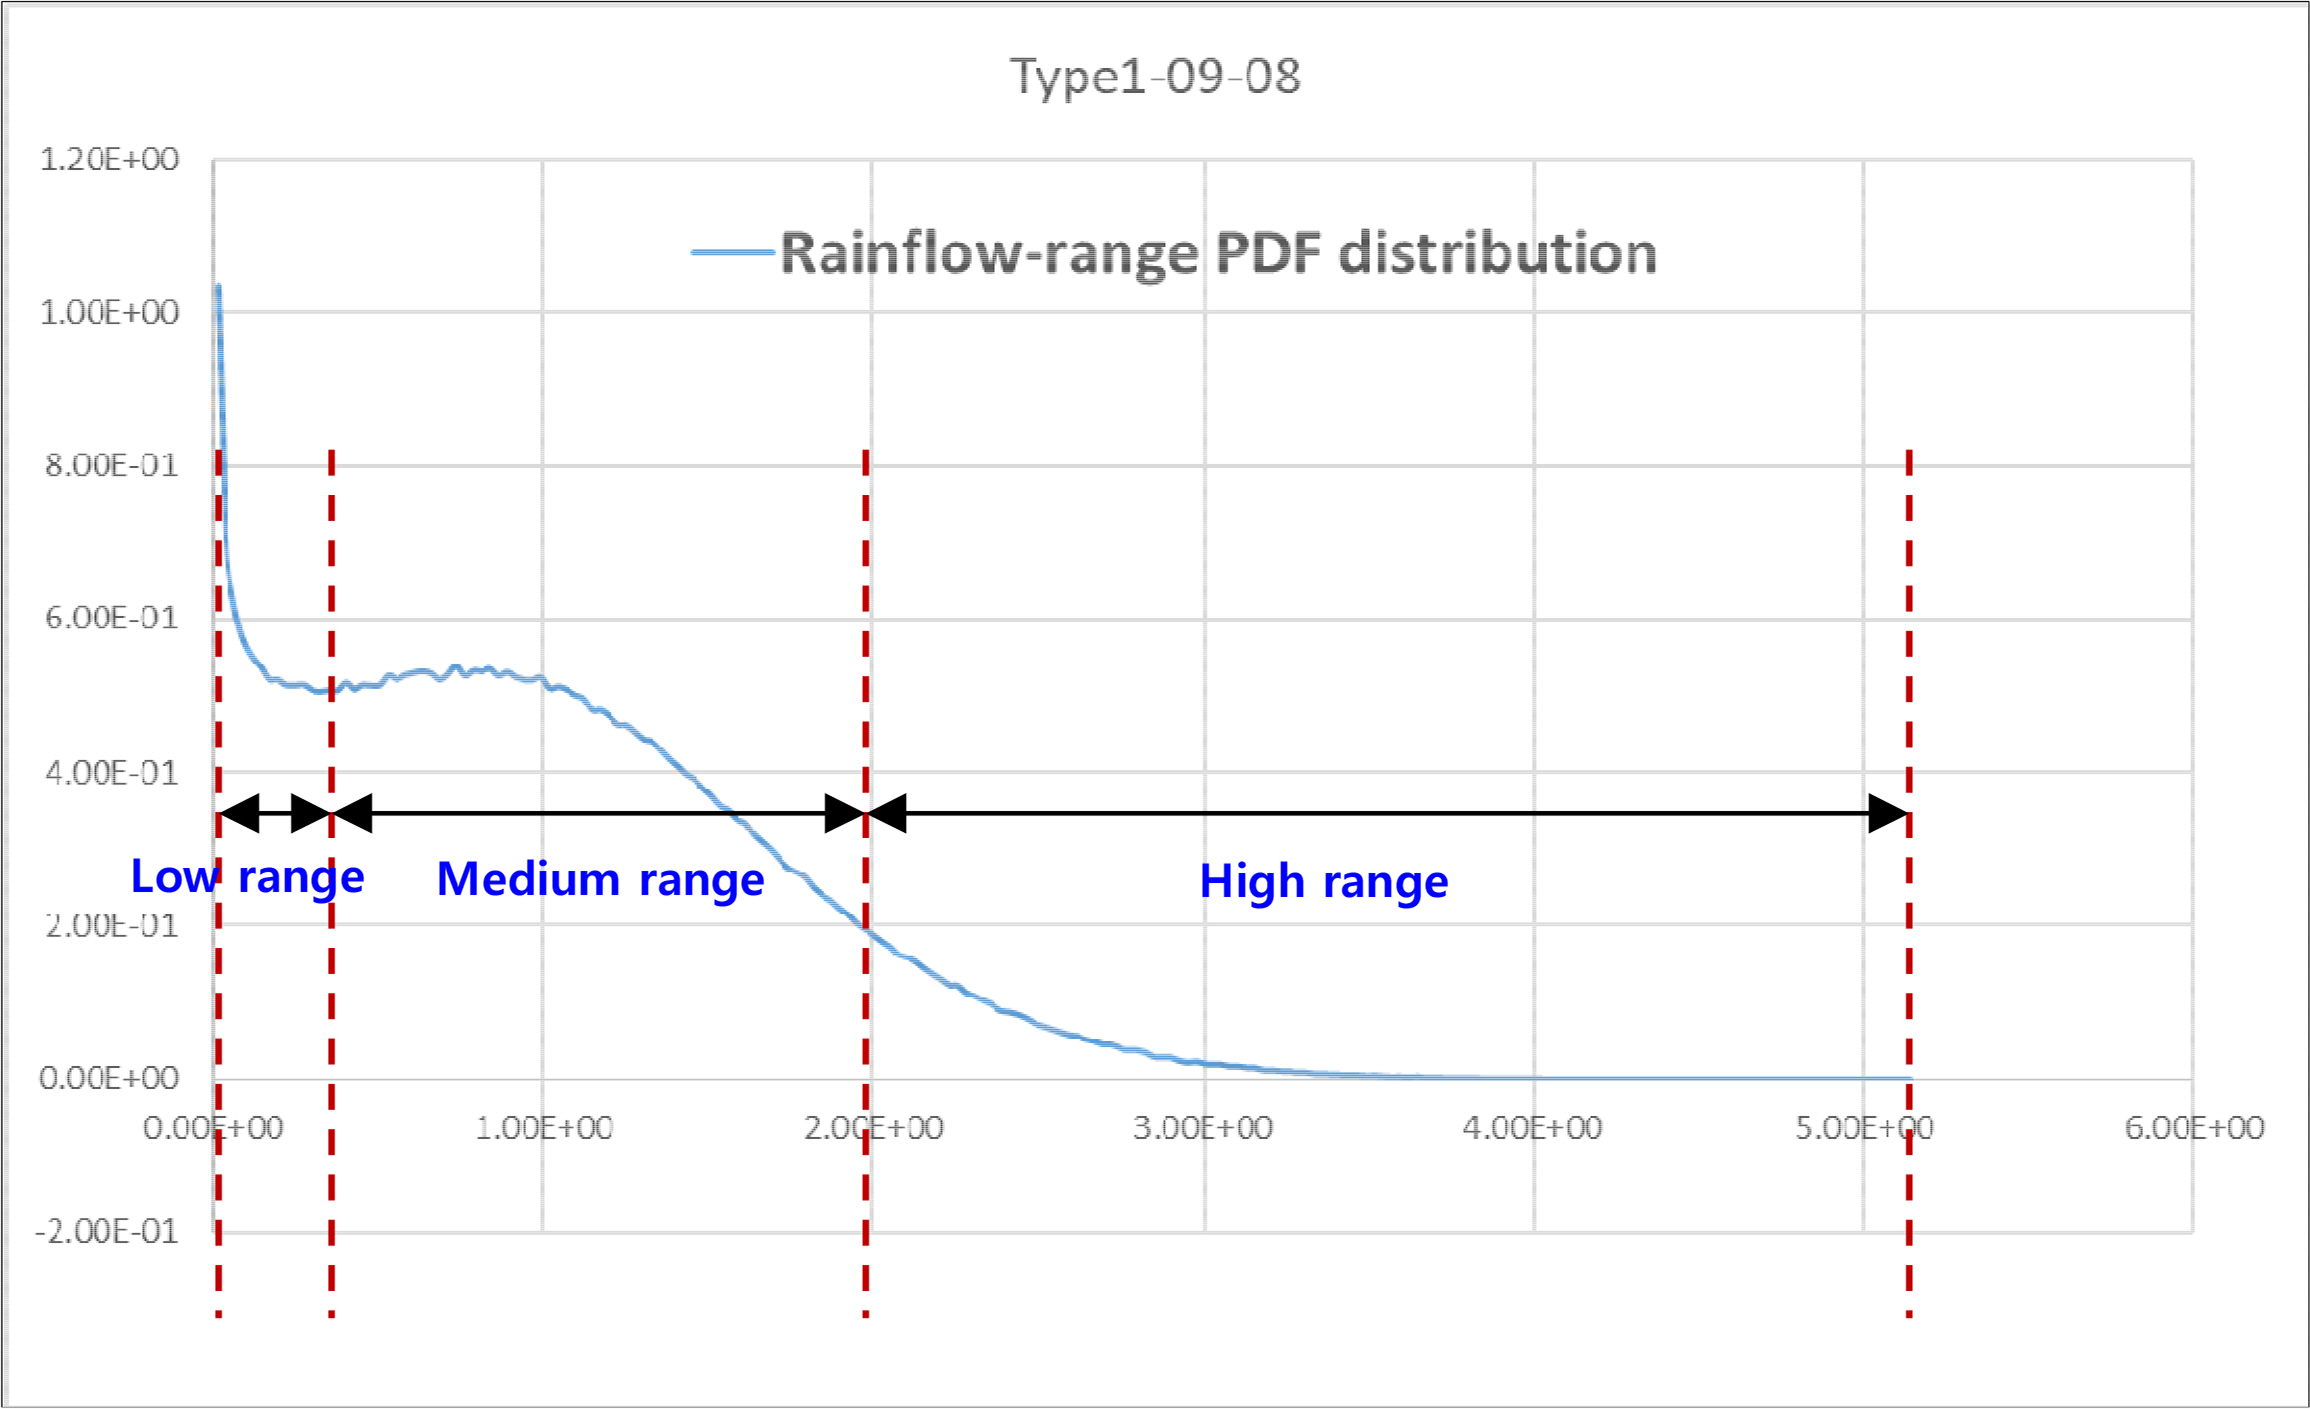
Stress-range categories in the rain-flow counting distribution
We developed an empirical formula for an approximate spectral moment that is close to the rain-flow counting stress range (∆σ) distribution. This paper describes the detailed development process and calculation procedure of the step-by-step study and comparison of several candidate formulas. In addition, a special parameter or exponential special parameter and two exponential bandwidth parameters are introduced and are combined to develop approximate spectral moments. Fig. 2 shows the development flowchart of empirical formulas for the approximate spectral moments proposed in this study.
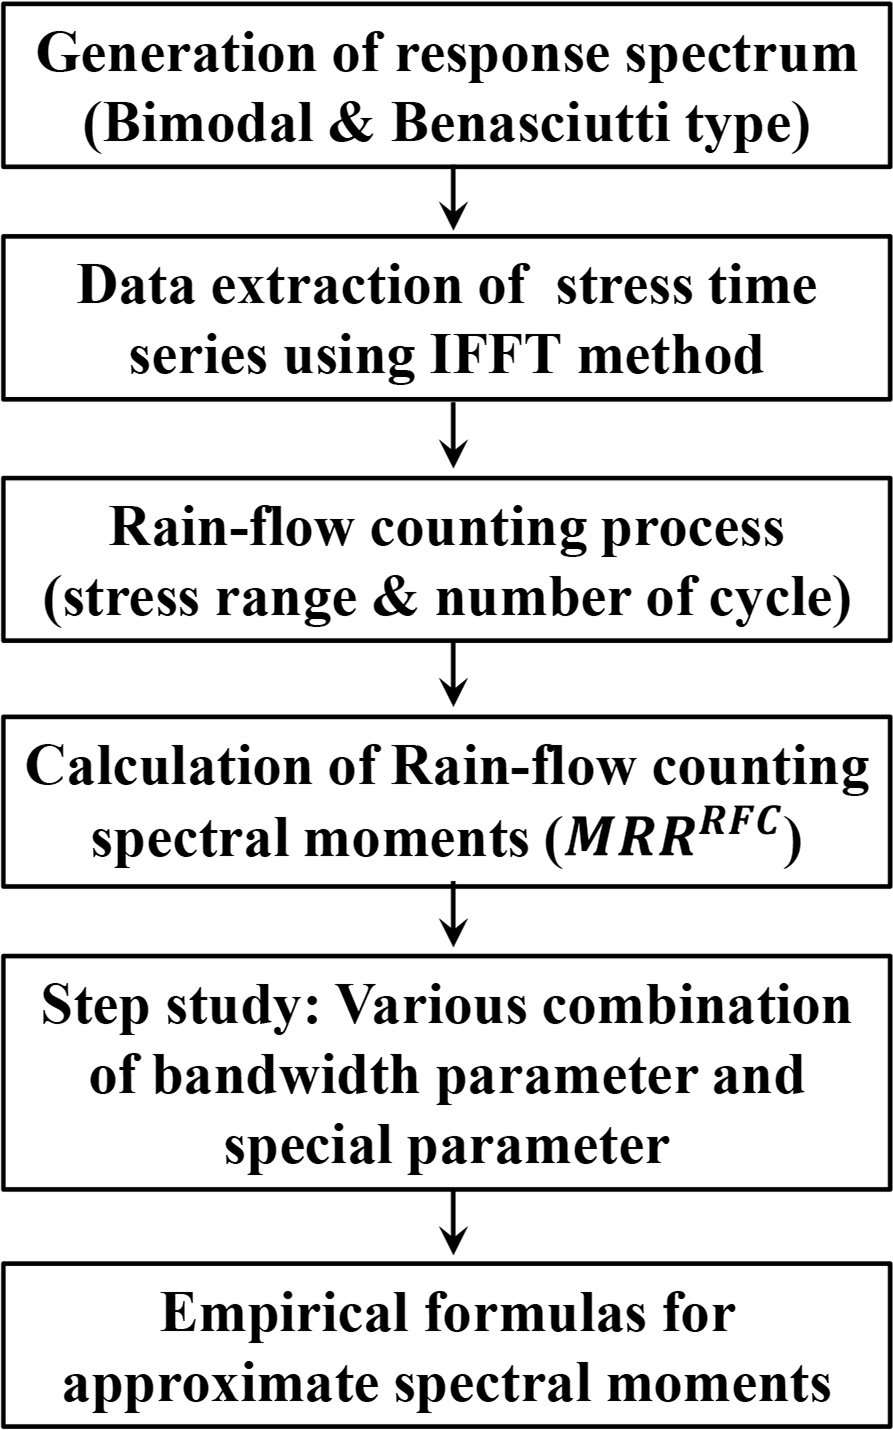
Flowchart to develop empirical formulas for the approximate spectral moments
2. Data Processing
2.1 Generation of Response Spectrum
Data processing follows the same spectrum models and numerical calculation method as those specified by Park et al. (2014) as the resultant outputs should be compared under the same input data conditions. Two representative spectra are selected to implement the stress response generation. Fig. 3 shows an ideal bi-modal spectrum proposed by Lutes and Larsen (1990). This spectrum has two peaks with low and high frequencies. Assuming that each spectrum is distributed in a narrow band, the variance is made to be 1,000 and 500 (Park et al., 2014). The spectrum area ratio Ar and frequency ratio Fr are:
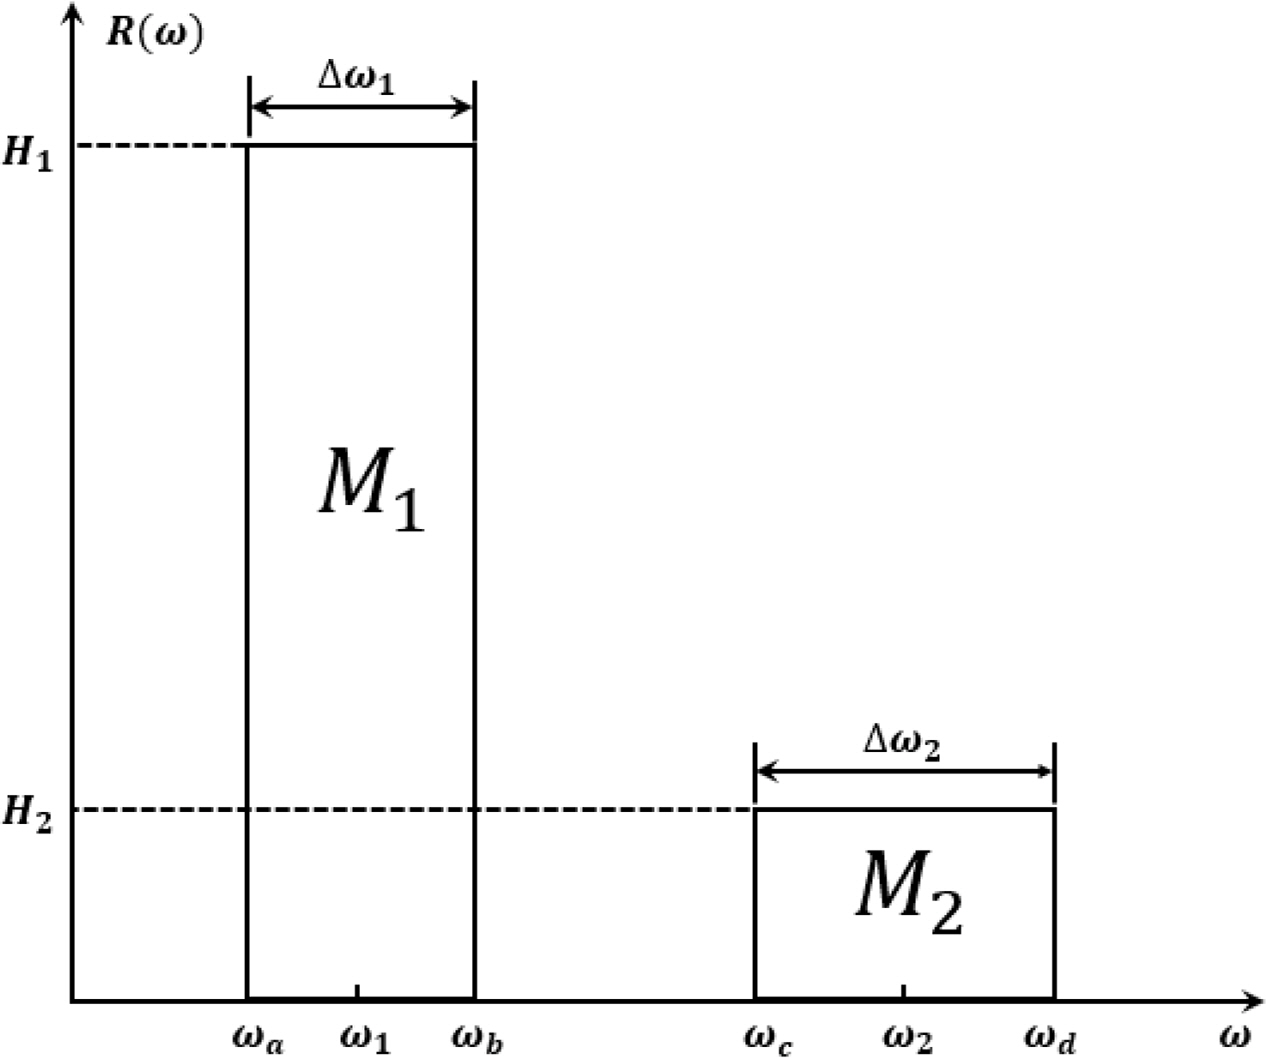
Bi-modal spectrum for response generation
Fig. 4 shows the five spectra proposed by Benasciutti (2004) (i.e., constant, linear, double symmetrical, and two kinds of anti-symmetric parabolic). Several assumptions are required to generate a stress response spectrum. The 0-order spectral moment (or variance) of all spectra is 1,000, and two bandwidth parameters α1 and α2 are within the range of 0.2–0.9 and 0.1–0.8, respectively (Park et al., 2014). The spectral bandwidth parameter αn and the nth order spectral moment mn are defined as follows.
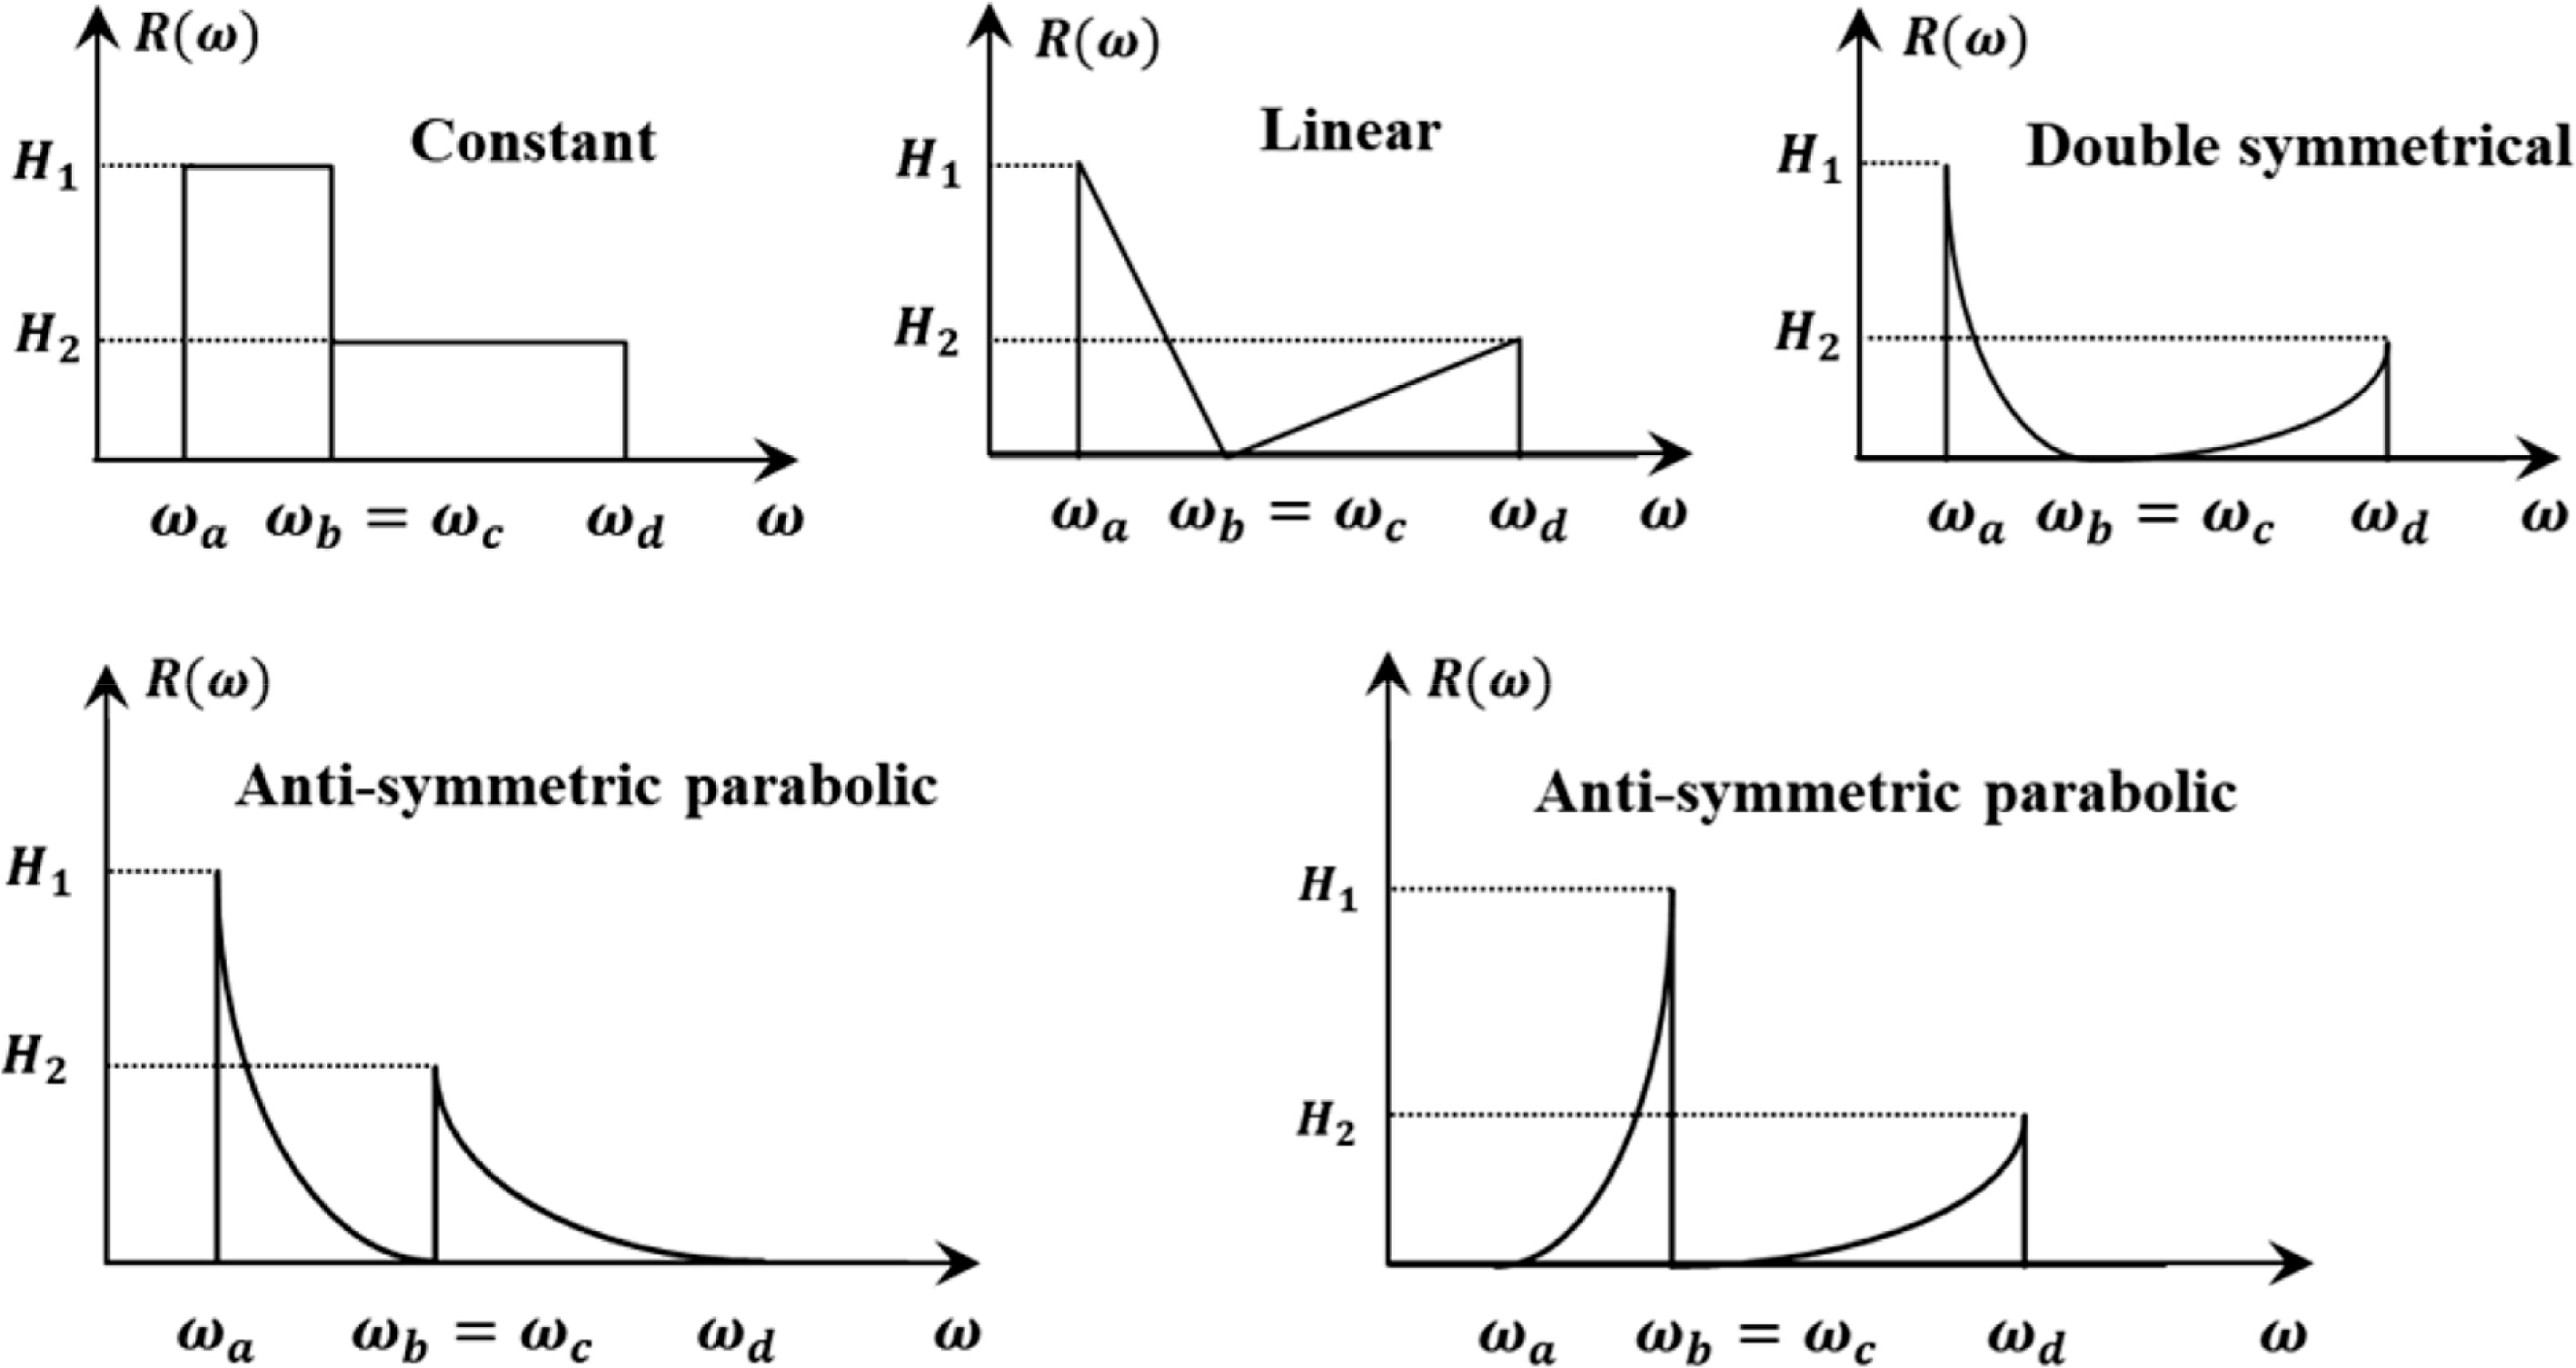
Benasciutti spectrum for response generation
where ω = Wave frequency
Sa(ω) = Response spectrum of stress amplitude a
Since the stress response spectrum is assumed to be a dimensionless quantity, the resulting stresses become a dimensionless quantity.
2.2 Data Extraction of Stress Time History
Time history data from the stress response is extracted using the Inverse fast Fourier transform (IFFT) method as follows:
where R(ωi) is the response spectrum, ωi is the angular frequency, ϕi is the phase angle, t is time, and n is the number of frequencies. The angular frequency and phase angle are generated by a random number giving an equal distribution within the allowable range. In the process of extracting the time history of stress data, the stresses with the shortest period should be taken into account so as not to miss them. Therefore, it is important to select a reasonable and appropriate time increment in order to accurately capture the maximum and minimum of the stress during the IFFT process.
Fig. 5 shows the numerical procedure for extracting time history data as described in Park et al., (2014). Through this process, it is possible to obtain random time history data with a sufficiently long period in the time domain. In the simulation, 10 blocks are repeatedly considered, and 20 sub-blocks are iteratively processed in one block. The duration period is 3 hours, and the phase angle and frequency interval are set randomly as the sub-block changes.
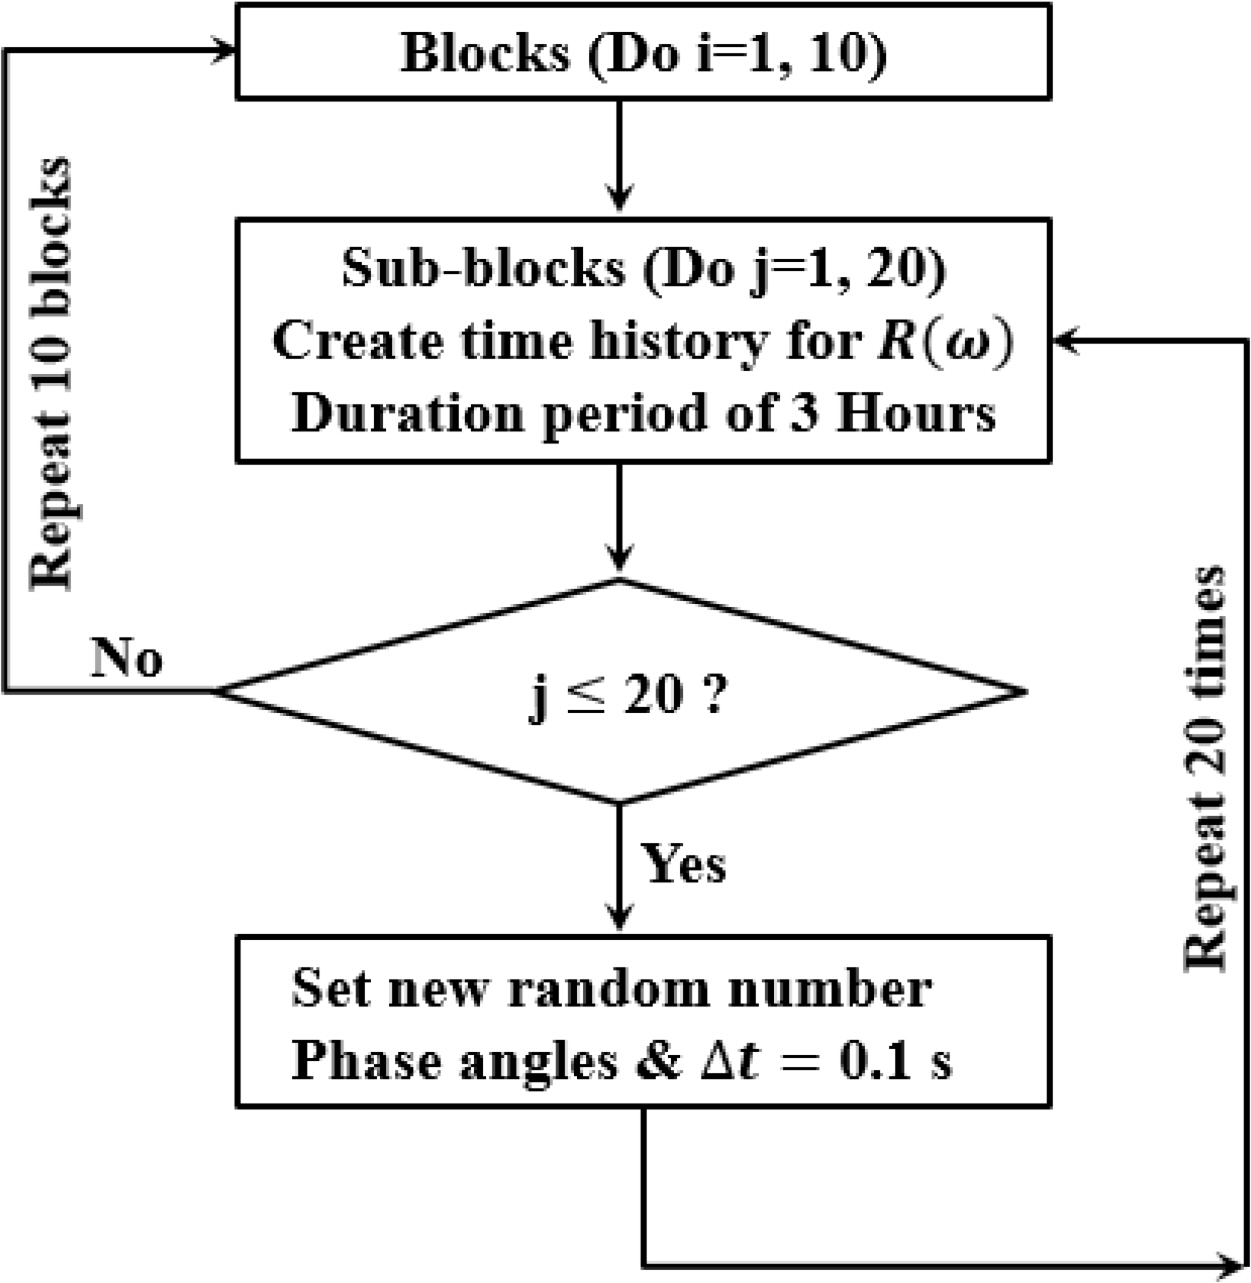
Numerical simulation flowchart for time history data generation
2.3 Rain-Flow Counting Process
To calculate the stress range and number of cycles from the time history data, we considered the rain-flow counting process according to the standard procedure described in ASTM E1049-85 (ASME, 2005). The PDF can be obtained by performing a rain-flow counting process for the stress range and number of cycles calculated from each block, as shown in Fig. 5. Finally, the PDF is obtained by taking the average of the PDF of 10 blocks.
3. Step Study of Approximate Spectral Moment
3.1 Definition of Rain-Flow Counting Moment
To increase the accuracy of fatigue damage calculation, an approximate PDF with the same distribution as the rain-flow counting PDF must be obtained. For this purpose, it is preferable to obtain the rain-flow counting moment (MRRRFC) through numerical simulation and then to obtain an approximate spectral moment that is close to the rain-flow counting moment. For the response spectrum, the rain-flow counting moment is defined as follows (Dirlik, 1985):
As can be seen from the equation above, the rain-flow counting moment is a non-dimensional value of the rain-flow counting PDF from a standard Rayleigh PDF. ExistingFatigue models define the rain-flow counting moment using spectral moments or bandwidth parameters (Dirlik, 1985; Park et al., 2014). From the results of recent studies, it can be seen that there is a limit to increasing the accuracy of fatigue damage. In this regard, it is necessary to develop new empirical formulas for approximate spectral moments. If approximate spectral moments can be accurately and efficiently obtained, a stress-range distribution close to the exact value can be obtained, and the accuracy of the fatigue damage prediction can be dramatically improved.
3.2 Existing Approximate Spectral Moment
Dirlik (1985) and Park et al. (2014) presented approximate spectral moments as a combination of bandwidth parameters through a parametric study based on numerical simulation. The first and second-order approximate spectral moments presented by Dirlik (1985) are as follows.
The approximate spectral moment suggested by Park et al. (2014) is as follows.
Approximate spectral moments have been presented up to the third-order term, and no research has been published for fourth-order or higher terms. Increasing the order of the approximate spectral moment greatly contributes to the accuracy of the stress distribution in the high stress range where the Vanmarcke parameter (Vanmarcke, 1972) is close to 1.0, and eventually, the accuracy of the fatigue damage estimation can be increased. Therefore, several step-by-step studies need to be carried out to develop approximate spectral moments that are close to the rain-flow counting moment.
3.3 Step 1: Combination of Bandwidth Parameter
For the purpose of simply defining the approximate spectral moment so that it can be applied to the actual design, a combination with the constants b and c in the bandwidth parameter is assumed as follows.
To find the optimal values of b and c using the bandwidth parameter, the range of exponents is determined while excluding the range of low accuracy of the R-squared values through parametric studies:
Regression analysis is performed for 40 cases using MRRRFC(q) obtained from numerical simulation. To show the difference between MRRRFC(q) and
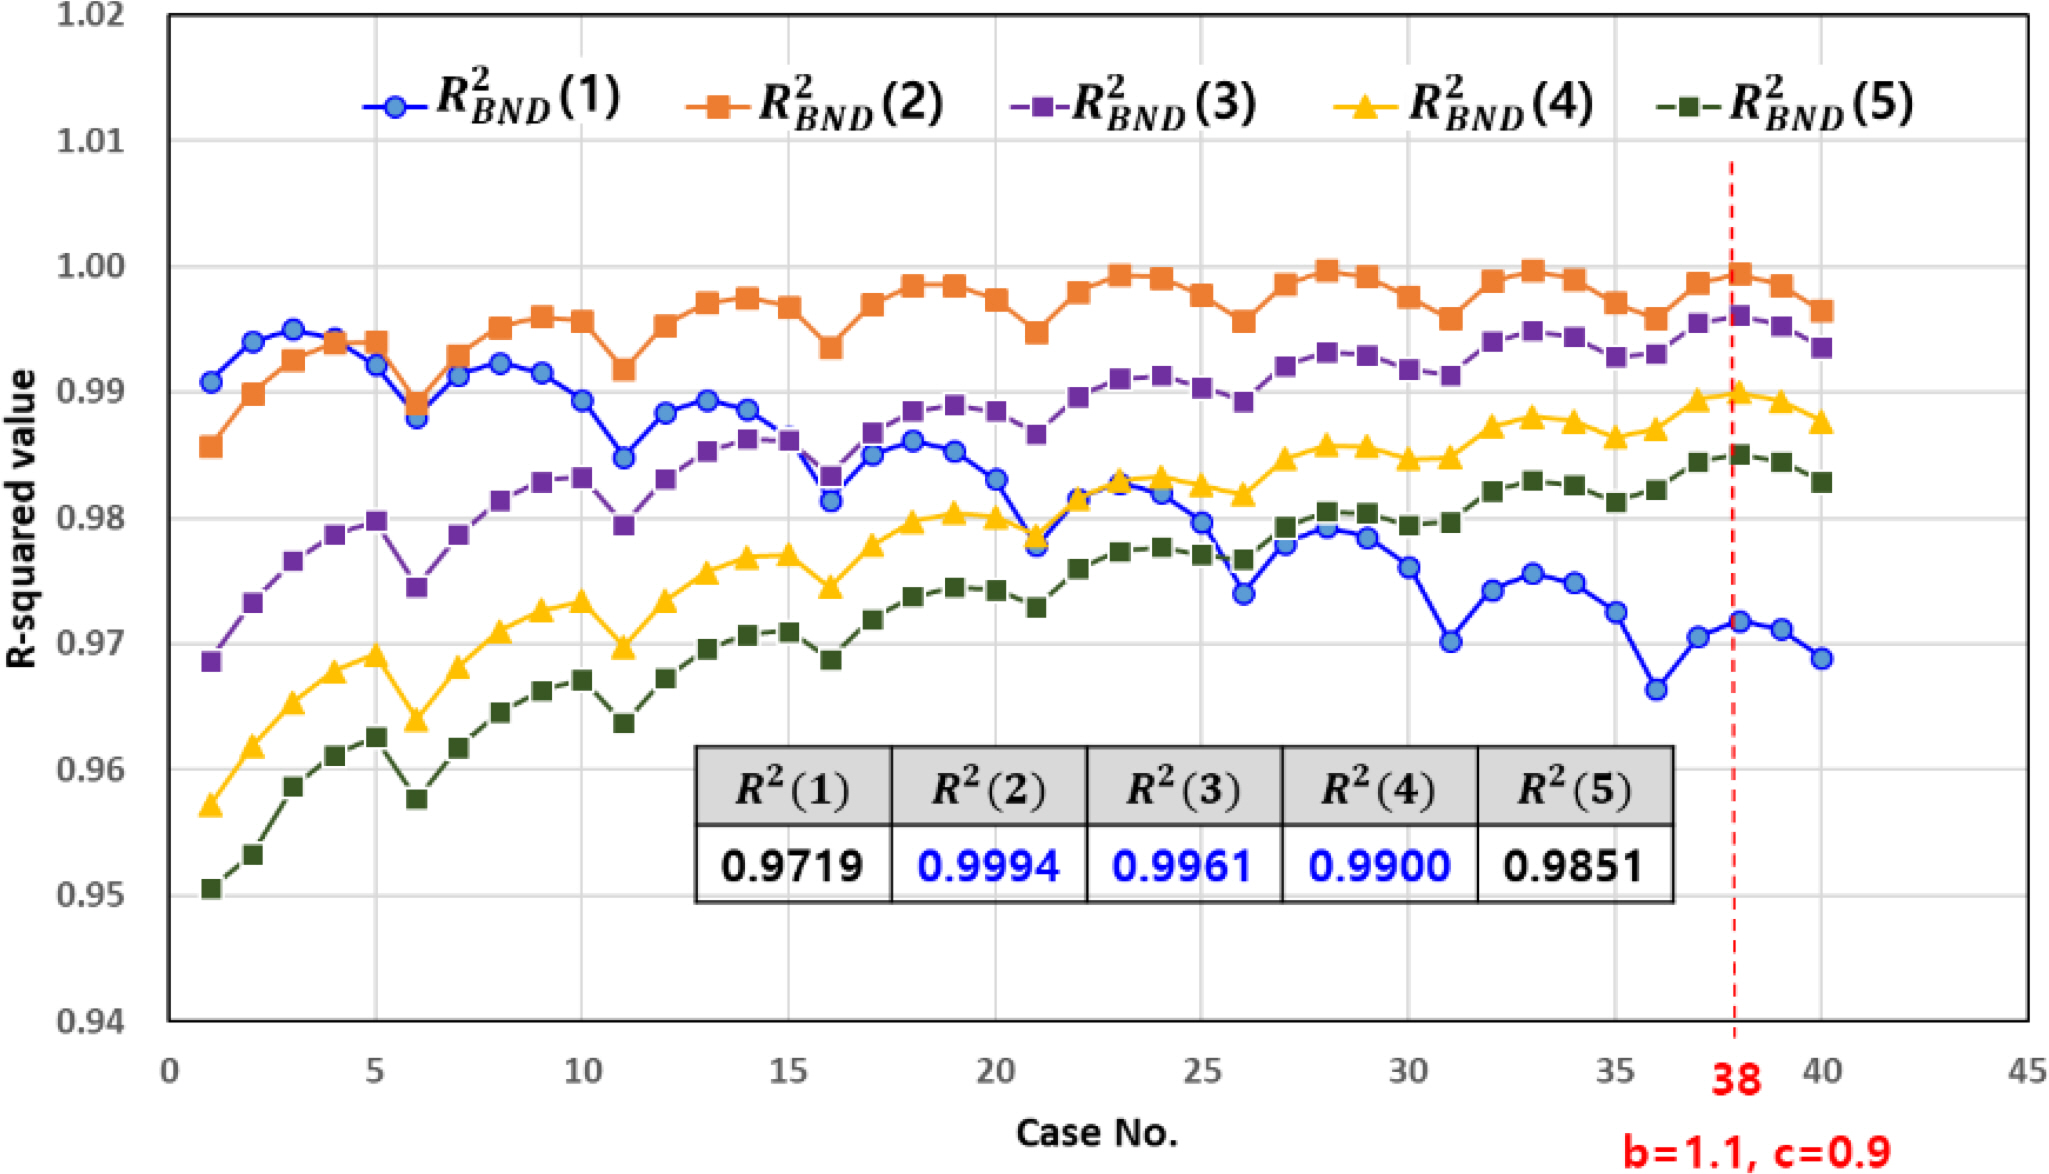
R-squared value distribution between MRRRFC(q) and
From the R-squared values in Fig. 6, the accuracy of the remaining spectral moments except for both the first and fifth-order spectral moments is above 99%. As the constants b and c increase, the R-squared values of the first spectral moment gradually decrease. On the other hand, the R-squared values of the remaining spectral moment increase until b is 1.1 and c is 0.9. However, it decreases after that. As for the first-order spectral moment, it can be seen that the R-squared value is maximized when b is 0.4 and c is 0.9.
3.4 Step 2: Combination of Special Parameter
Since there is a limit to obtaining the moment equivalent to the MRRRFC(q) by combining only the bandwidth parameters, a special parameter was used (Jun and Park, 2020):
k = 0.01 to 2.5, 0.01 interval
The range of coefficient k is considered the same as the range of bandwidth parameter αk. An iterative numerical calculation is performed in consideration of the following three conditions, and the R-squared values are confirmed through regression analysis between the special parameter and MRRRFC(q) using the rain-flow counting moment obtained from the numerical simulation. In this study, the moment
Table 1 shows the R-squared distribution between

R-squared values between
3.5 Step 3: Combination of a Special Parameter and Exponential Bandwidth Parameters
The approximate moment
Using MRRRFC(q) obtained from the numerical simulation, the R-squared values between MRRRFC(q) and
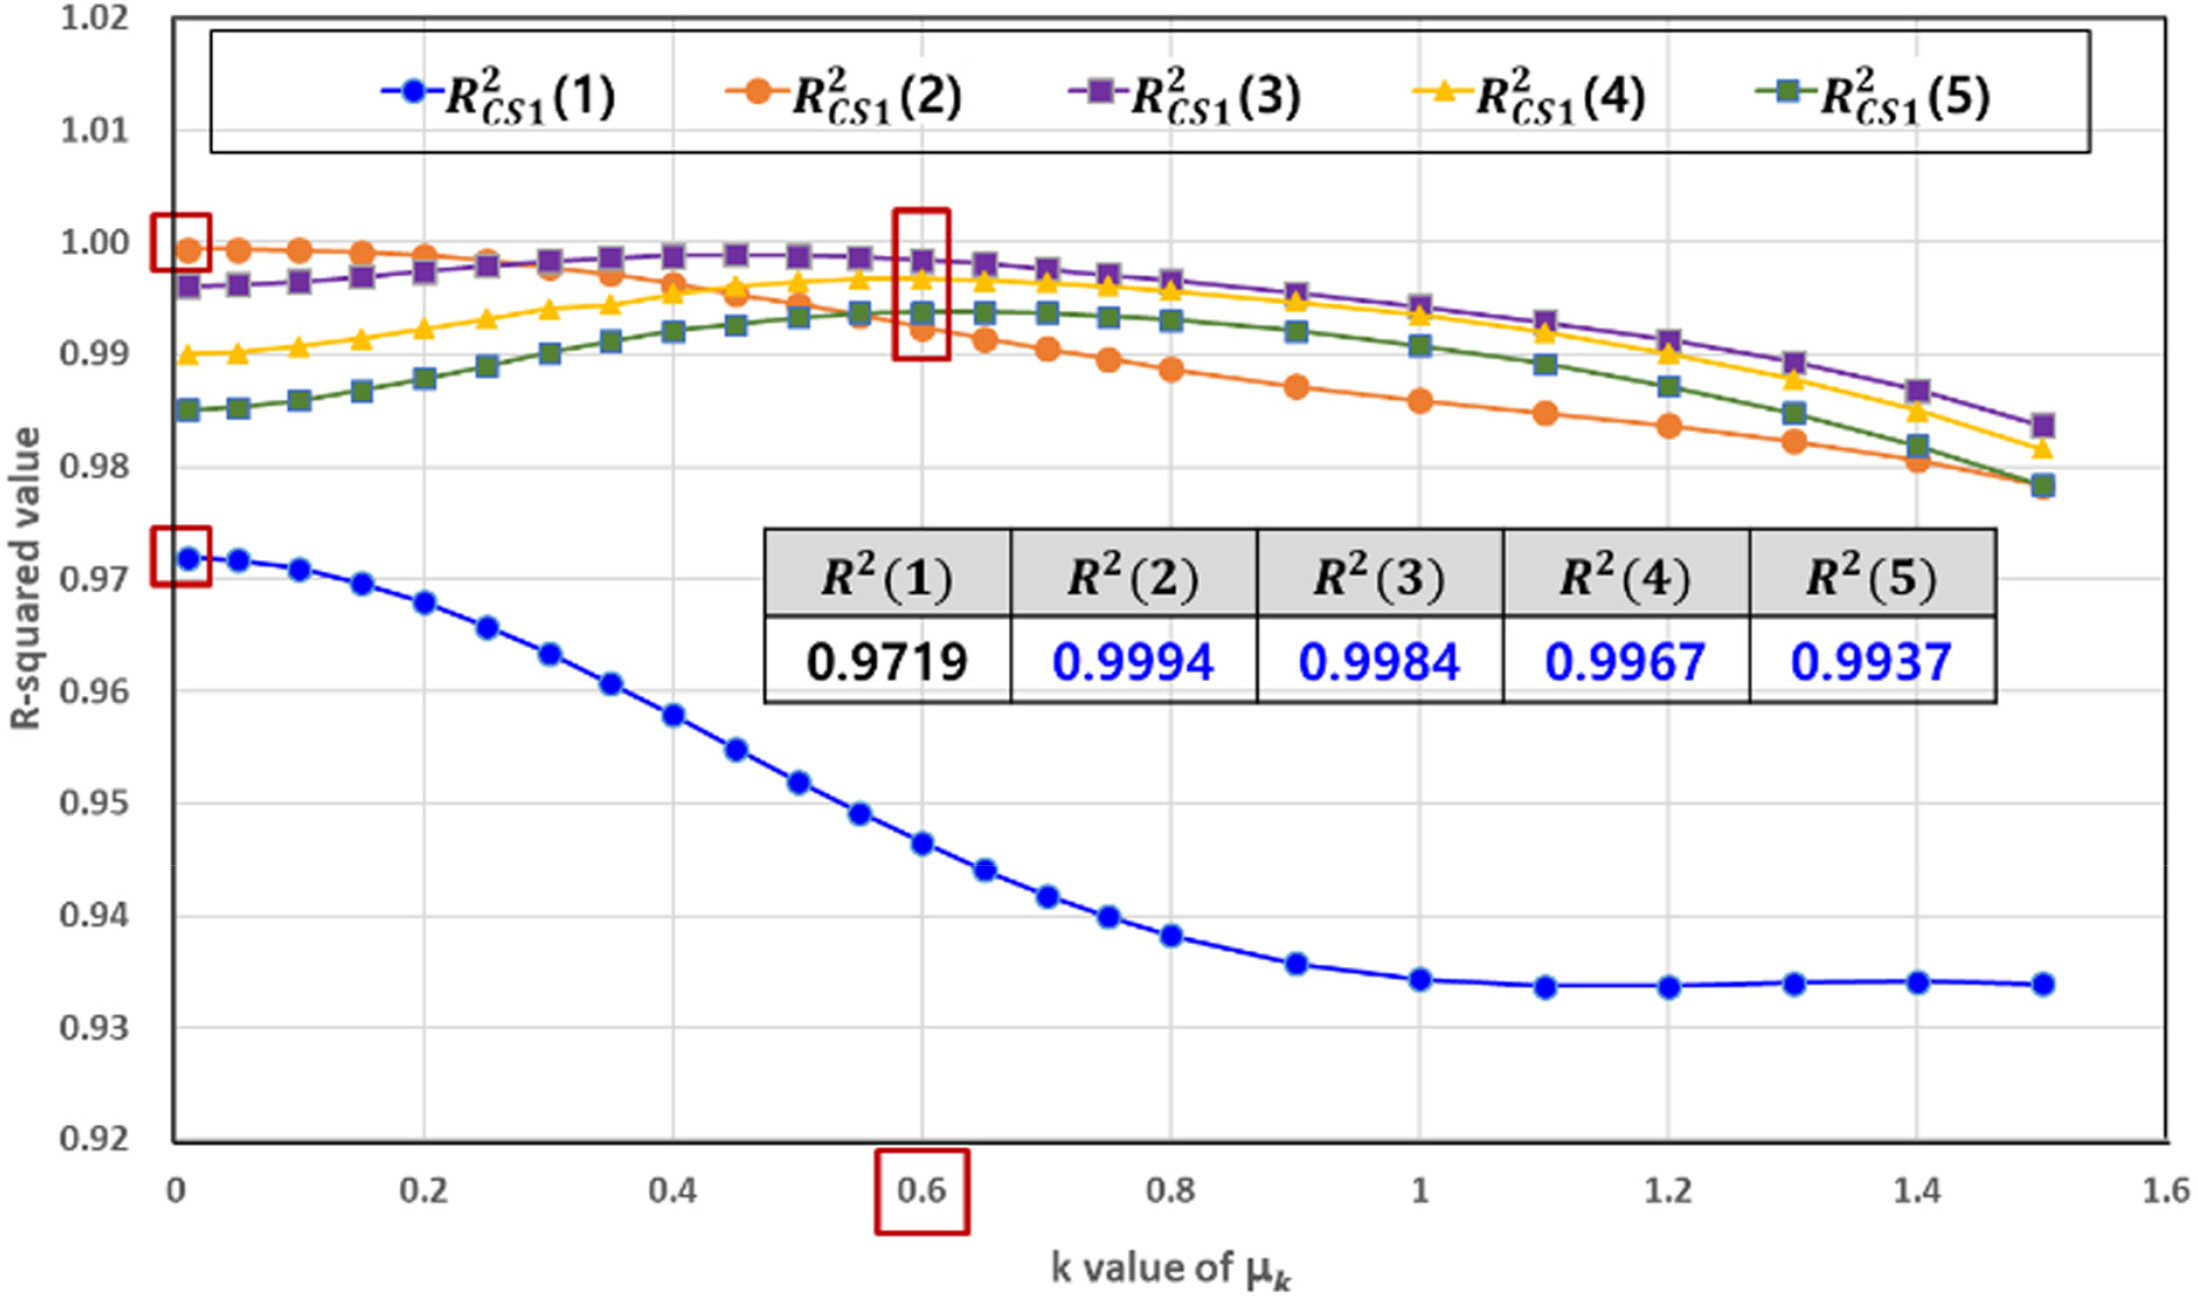
R-squared value distribution between MRRRFC(q) and
In the case of the 1st and 2nd-order spectral moment, the maximum R-squared values are shown when the coefficient k is 0.01. As the coefficient k increases, the R-squared values of the spectral moment decrease. This means that it is more advantageous not to consider the special parameter for the 1st and 2nd-order spectral moments. When the coefficient k is 0.6, the R-squared values of the remaining spectral moments show the maximum values and give more accurate results than the approximate spectral moment
3.6 Step 4: Combination of an Exponential Special Parameter and Exponential Bandwidth Parameters
The approximate moment
For the purpose of finding the optimal value of the exponent a of the special parameter, the final range below is determined while excluding the range with low accuracy of the R-squared values through a parametric study:
Using the MRRRFC(q) obtained from the numerical simulation, the R-squared values that show the difference between MRRRFC(q) and
The results are shown in Fig. 8 and are summarized below:
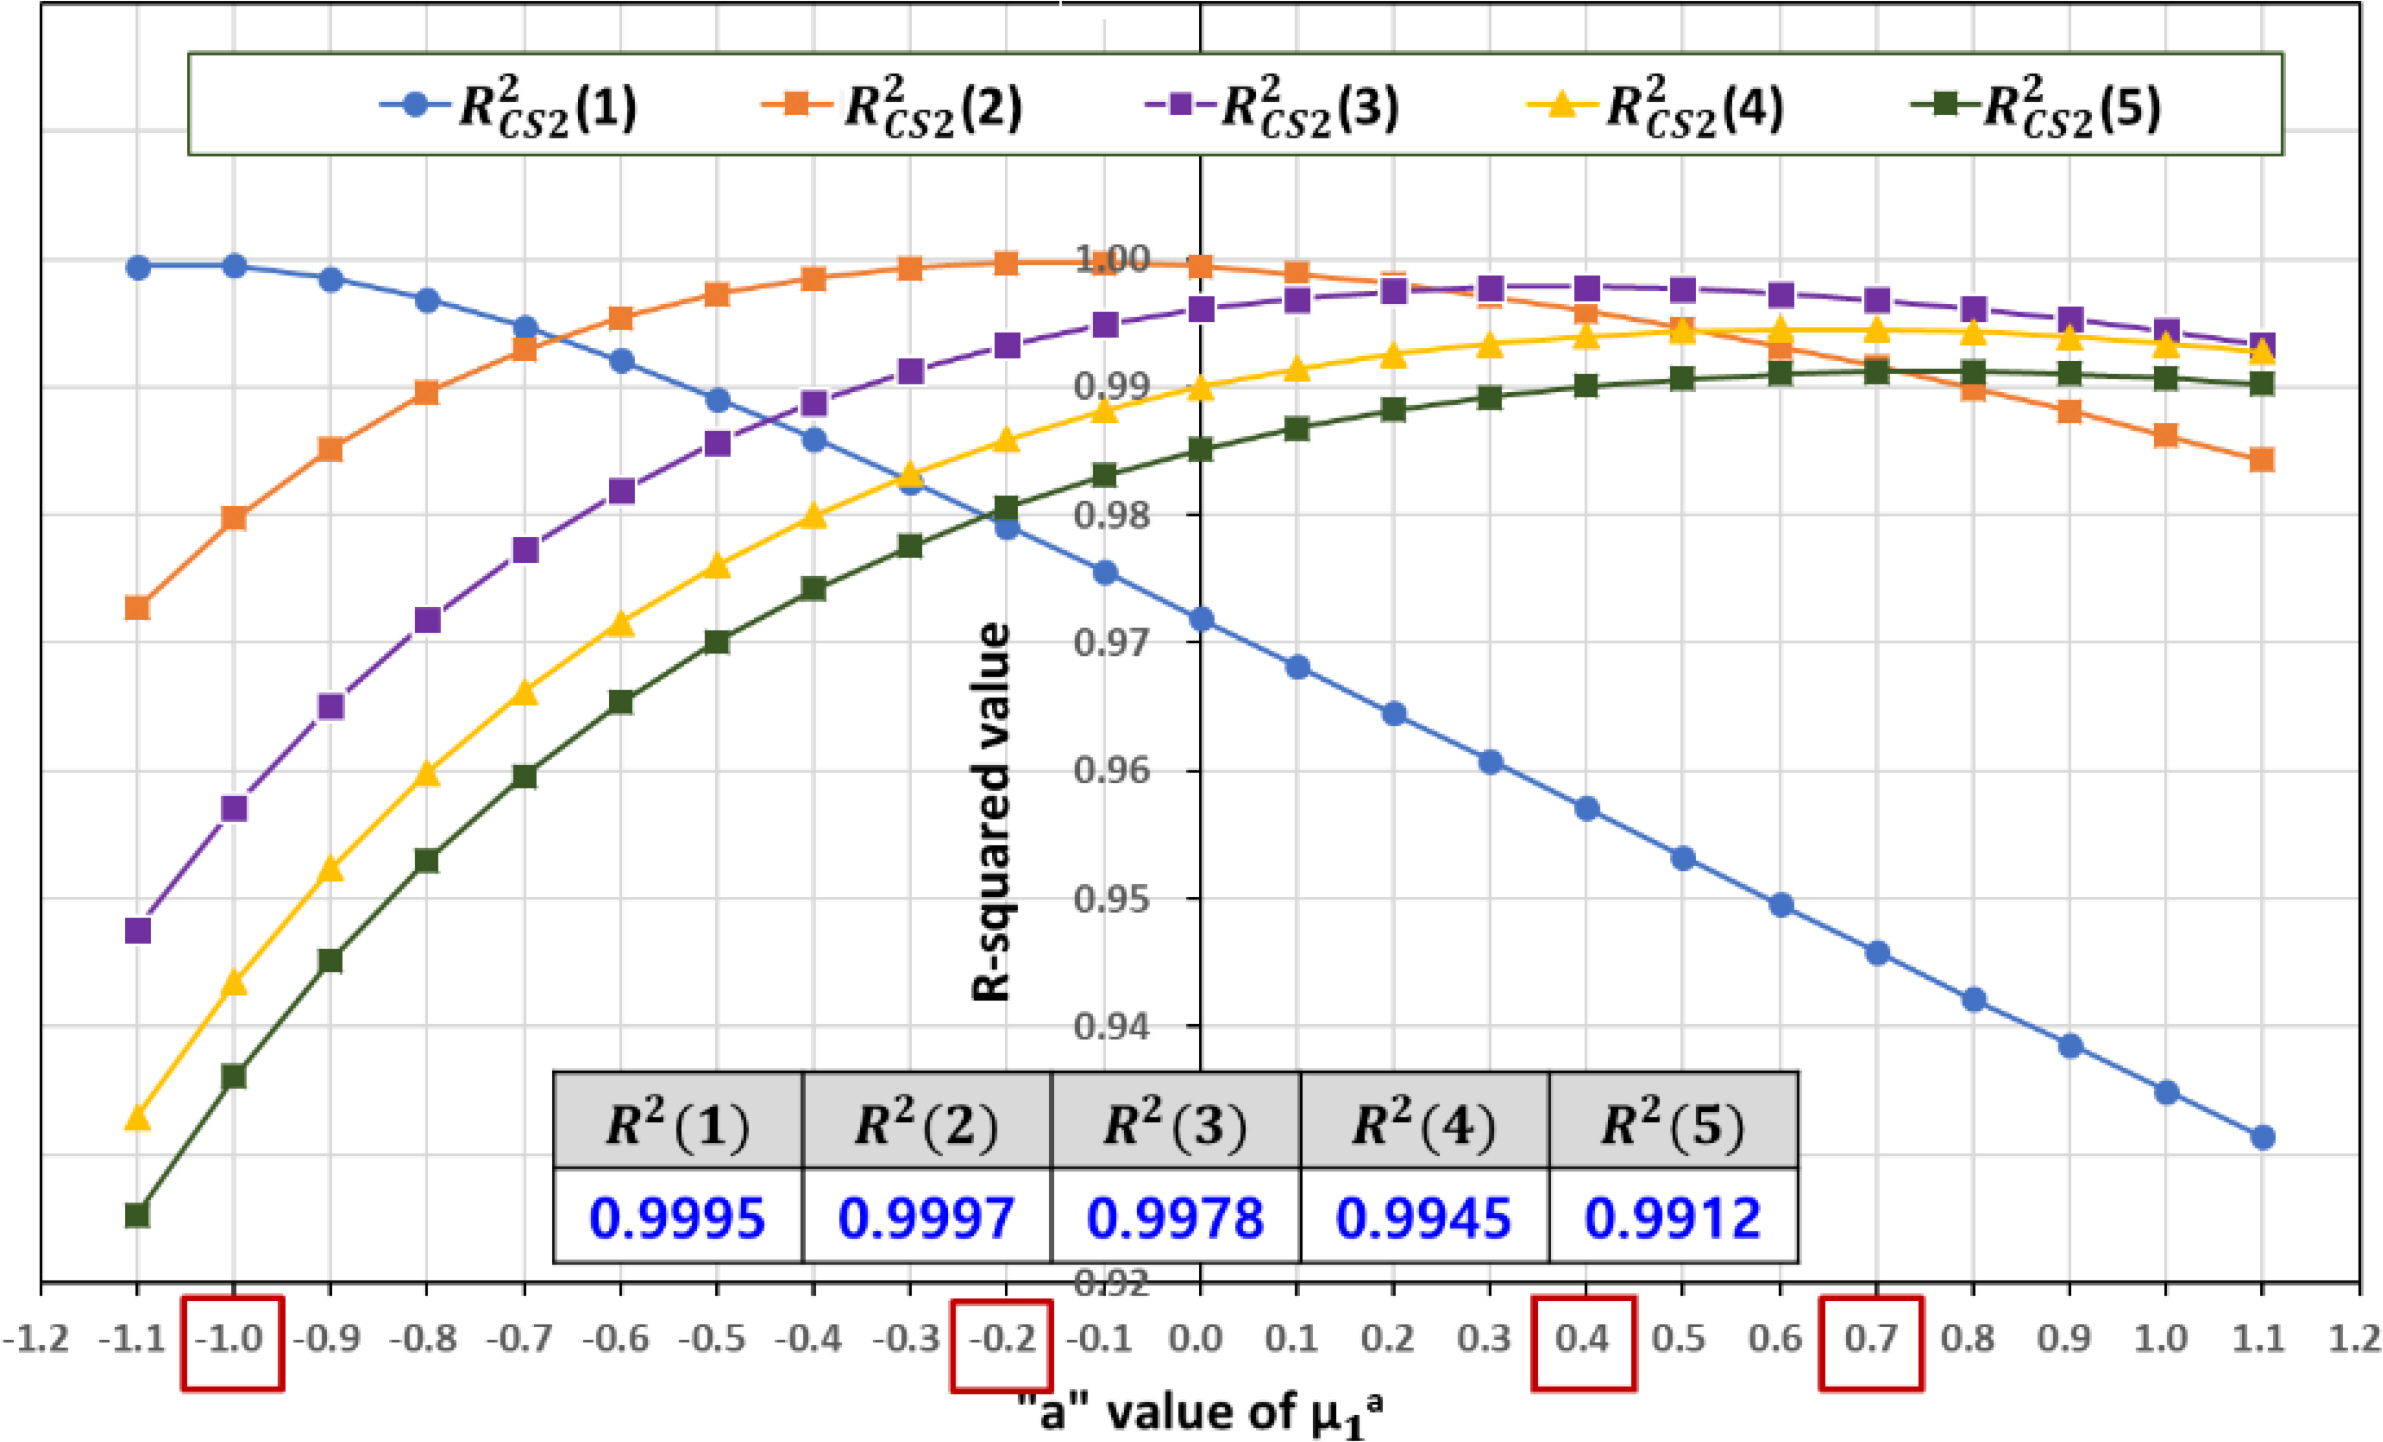
R-squared value distribution between MRRRFC(q) and
From the R-squared values in Fig. 8, it can be found that the accuracy of the remaining spectral moments except for both the fourth-order and the fifth-order spectral moments is above 99.7%. As the exponent a increases, the R-squared values of the first spectral moment decrease. On the other hand, the R-squared values of the remaining spectral moment show a tendency of increasing as the exponent a increases and then decreasing as it passes a specific value. As for the spectral moments from the first-order to the fifth-order, it can be seen that the R-squared value is maximized when the exponent a is −1.0, −0.2, 0.4, and 0.7.
4. Comparison
4.1 Four Candidate Formulas
Based on the results obtained from the step-by-step study in the previous section, the rain-flow counting moment MRRRFC(q) and the highest equivalent approximate moment
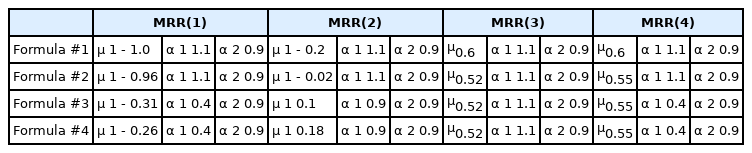
Four candidate formulas for approximate spectral moments
4.2 Comparison of Candidate Formulas
The rain-flow counting response distribution calculated from the numerical simulation is regarded as the real value. Several comparison studies were carried out using four empirical equations. Table 3 shows the comparison results of R-squared values between the rain-flow counting moment and approximate spectral moment using four formulas. Fig. 9 shows a comparison of the PDF between empirical formula #2 and the rain-flow counting spectral moment for two representative spectra mentioned in section 2.1.

Comparison of R-squared values using four formulas
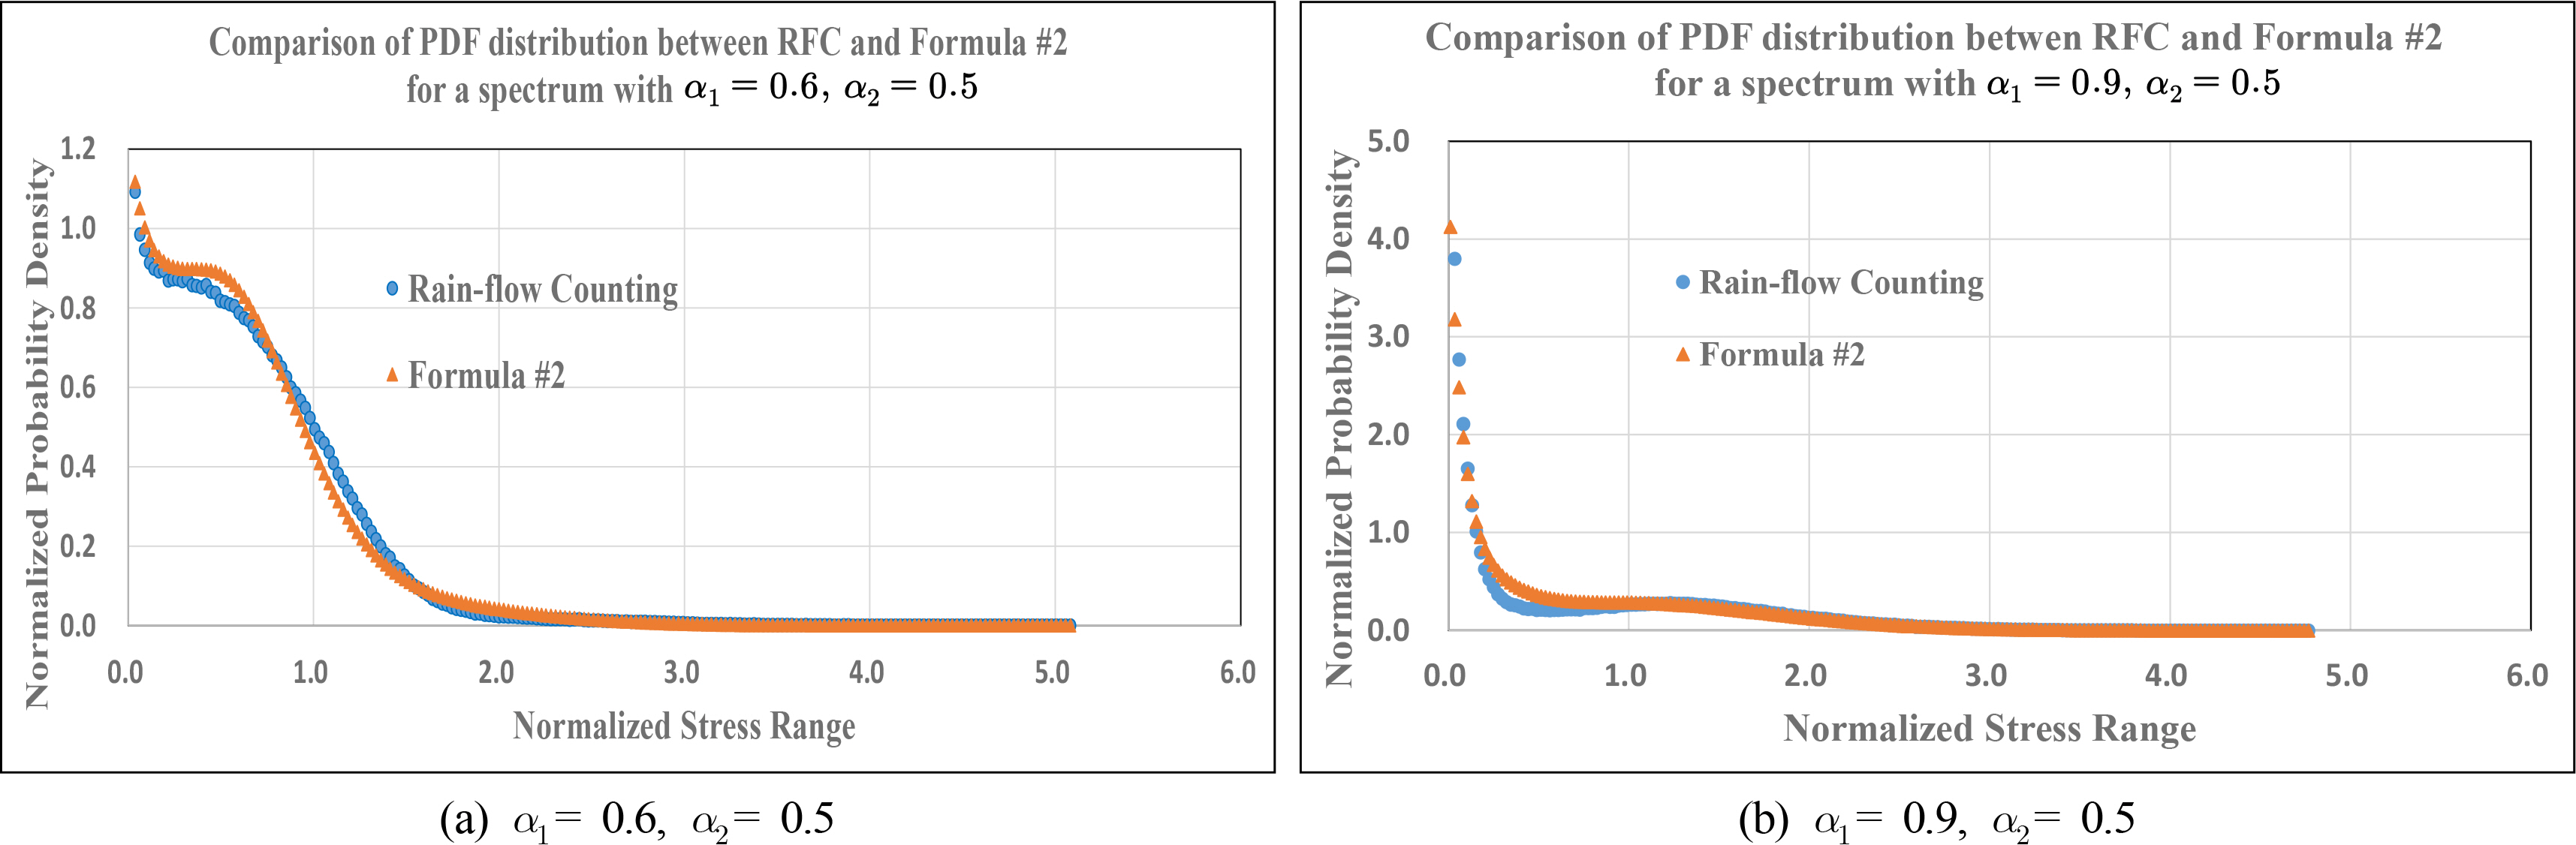
Comparison of PDF between empirical formula #2 and rain-flow counting moment.
Fig. 10 shows the comparison of the relative distance from rain-flow counting distribution of four formulas compared with two models (Dirlik model and Park model) to confirm the suitability and accuracy.
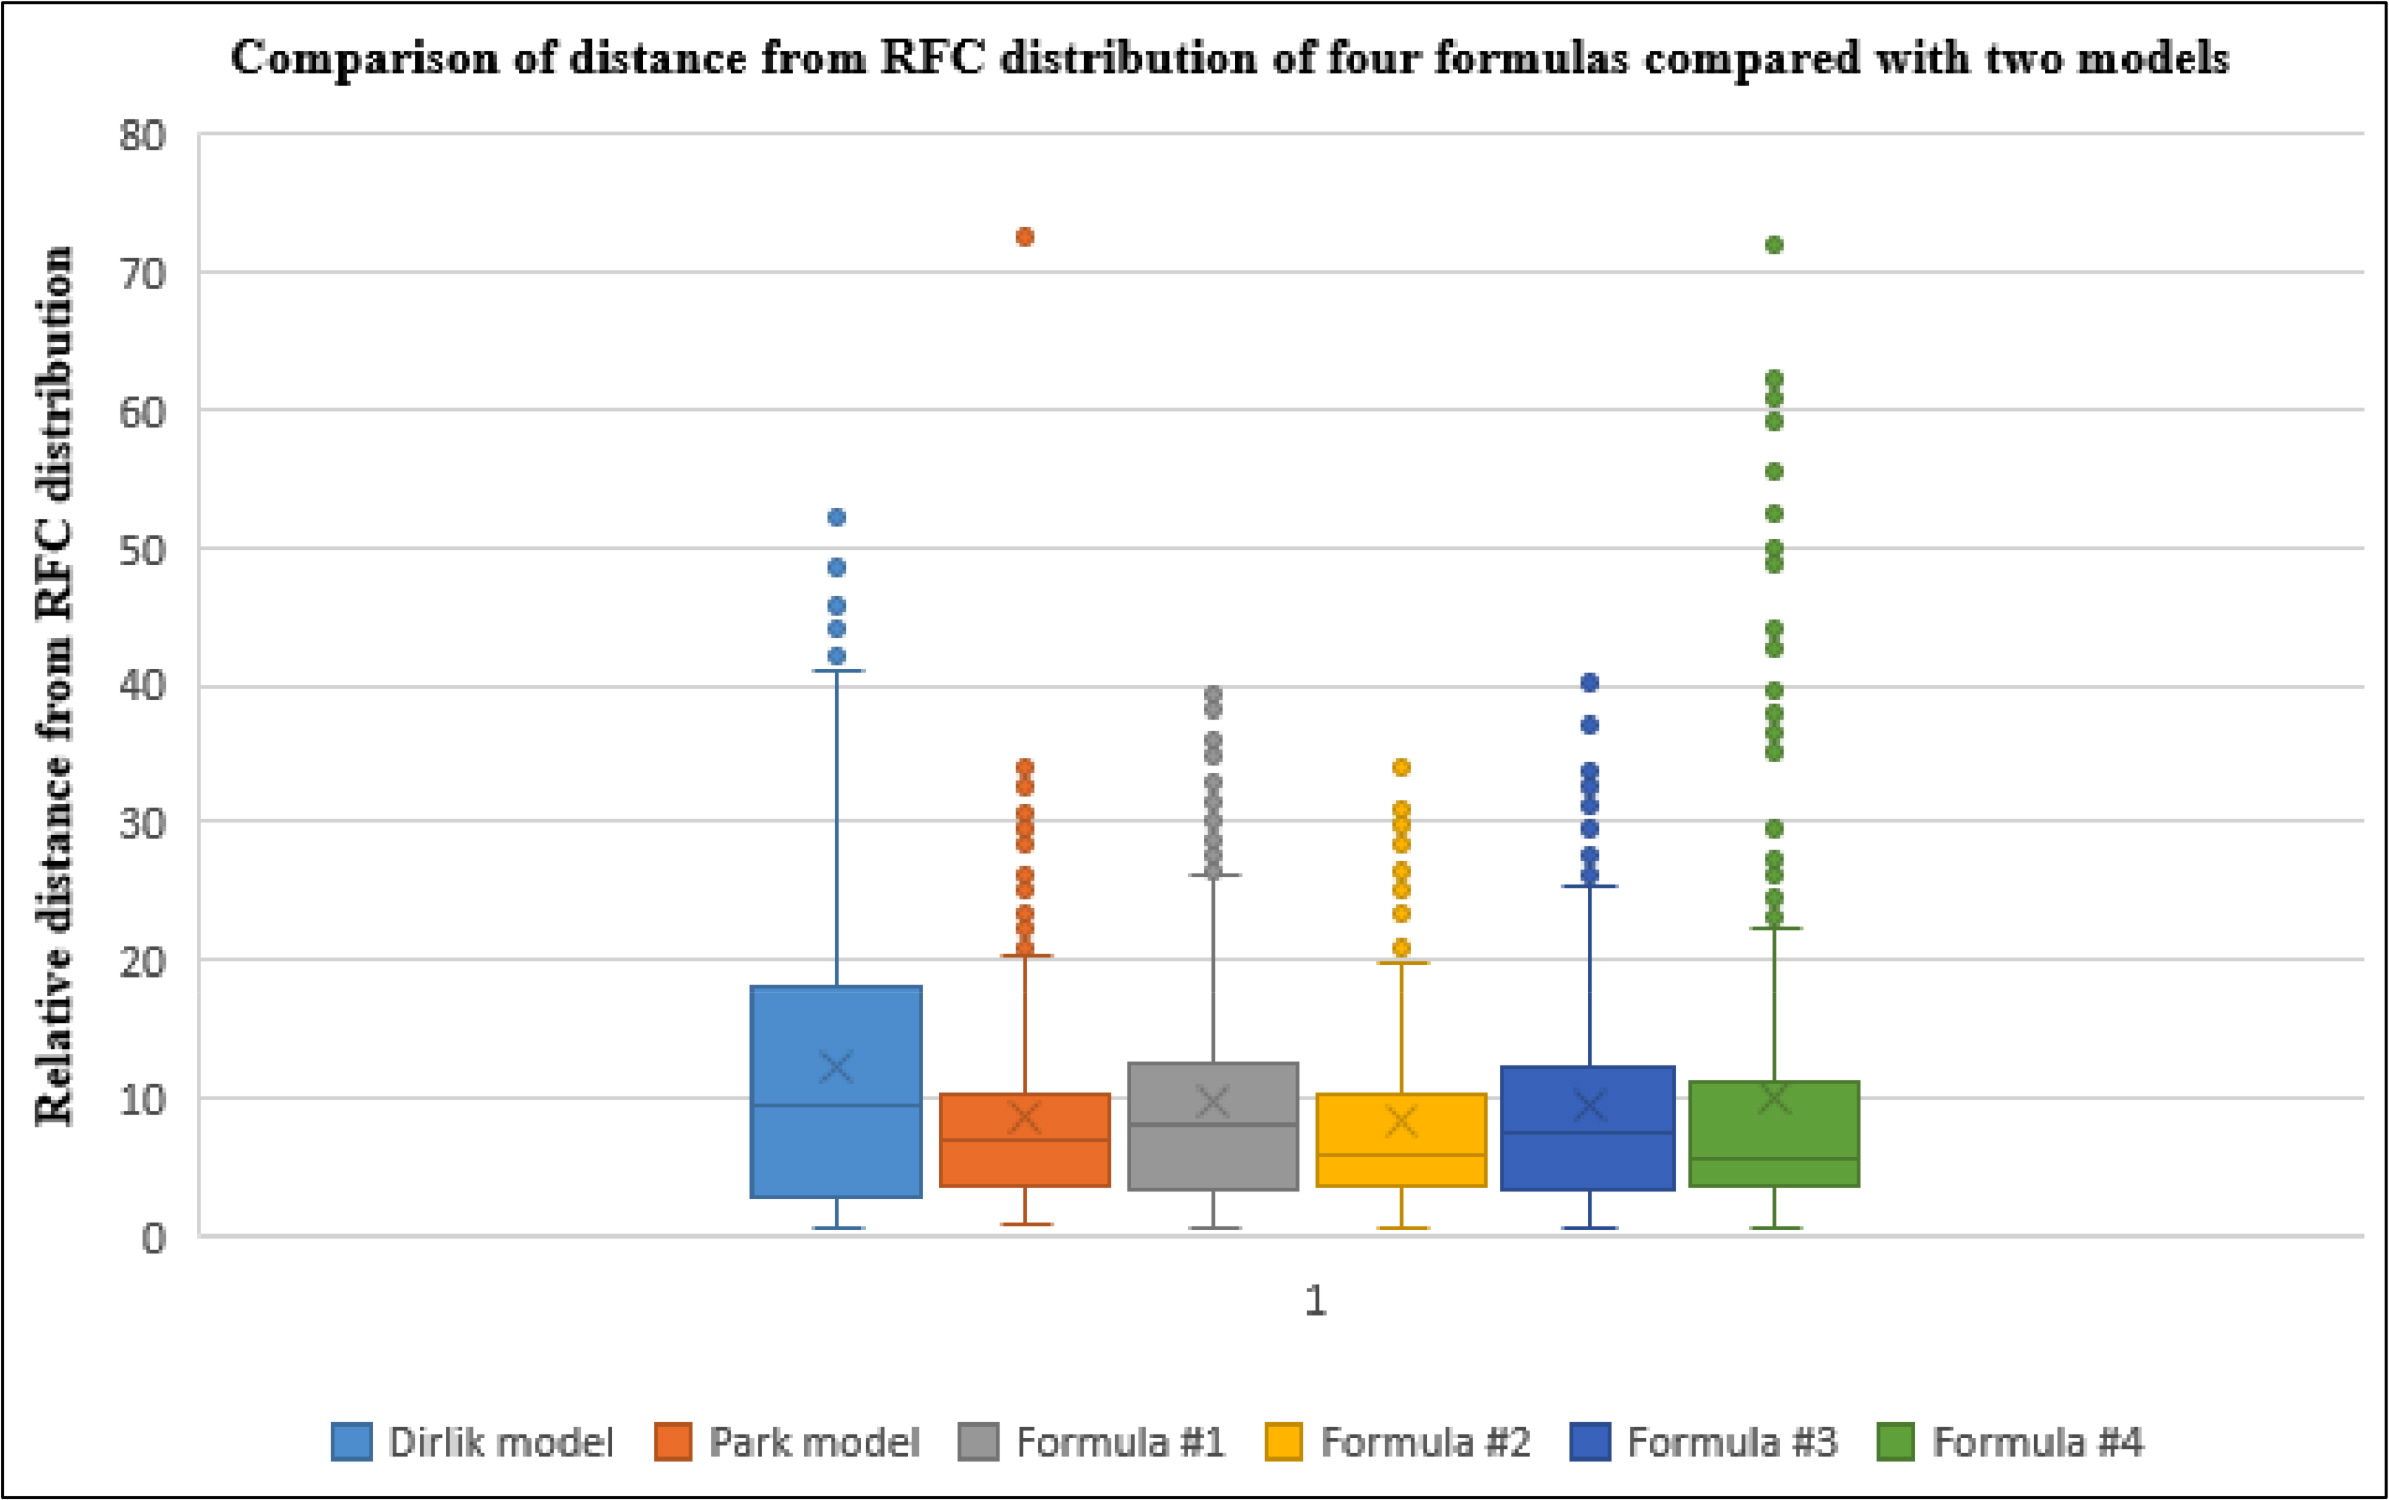
Comparison of distance from RFC distribution of four formulas compared and two other models
To evaluate the error rates for relative distance, the root mean square (RMS) method was used as shown in Eq. (30).
N = Total number of spectra
Table 4 shows a quantitative comparison of distance between the two models and four formulas using the RMS method. As a result, it was confirmed that formula #2 gives the closest distribution to the rain-flow counting distribution.

Comparison of RMS values for relative distance error between existing models and four formulas
Table 5 summarizes the comparison results based on the PDF distribution and relative distance error rate between the rain-flow counting distribution and four formulas using eight spectra. By extending to the fourth-order spectral moment that the other model did not consider, the contribution to the rain-flow counting (RFC) distribution in the high range is large, and the fatigue damage accuracy can be improved. The approximate spectral moments obtained from this study can be applied as significant input variables in the constitutive equation of the fatigue model.
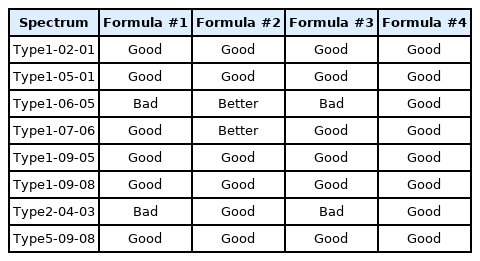
Comparison of four formulas using eight spectra
5. Conclusions
From the results of previous studies, when increasing the order of the spectral moment, the PDF distribution in the Gaussian wide-band range close to a Vanmarcke parameter of 1.0 approaches the rain-flow counting distribution, so the accuracy of the fatigue damage assessment can be improved. In this study, we developed a new approximate spectral moment
Whereas other studies considered only the 2nd or 3rd-order approximate spectral moments, this study contributed to increasing the accuracy of fatigue damage assessment by extending them to 4th–order terms or higher.
The previous models considered the approximate spectral moment with the spectral moment m0 – m4 or the linear combination of the bandwidth parameters α1 and α2. In this study, a special parameter or exponential special parameter was combined with the bandwidth parameter through a step-by-step study to develop several empirical formulas.
In addition, simplicity and convenience were considered for an actual engineering application, and stability and accuracy of the fatigue analysis solution can be enhanced by applying approximate spectral moments with the R-squared values of more than 97% comparing with rain-flow counting moments.
Notes
This research was supported by the BB21 plus funded by Busan Metropolitan City and Busan Institute for Talent & Lifelong Education (BIT)