CFD Study for Wave Run-up Characteristics Around a Truncated Cylinder with Damper
Article information

Abstract
In this study, numerical simulations for a single fixed truncated circular cylinder in regular waves were conducted to investigate the nonlinear wave run-up under various dampers and wave period conditions. The present study used the volume of fluid (VOF) technique to capture the air-water interface. The unsteady Reynolds-averaged Navier–Stokes (URANS) equation with the k–∊ turbulence model was solved using the commercial computational fluid dynamics (CFD) software STAR-CCM+. First, a systematic spatial convergence study was conducted to assess the performance and precision of the present numerical wave tank. The numerical scheme was validated by comparing the numerical results of wave run-up on a bare truncated cylinder with the experimental results, and a good agreement was achieved. Then, a series of parametric studies were carried out to examine the wave run-up time series around the truncated cylinder with single and dual dampers in terms of the first- and second-order harmonic and mean set-up components. Additionally, the local wave field and the flow velocity vectors adjacent to the cylinder were evaluated. It was confirmed that under short wave conditions, the high position of the damper led to a noticeable increase in the wave run-ups with significant changes in the first- and second-order harmonic components.
1. Introduction
The offshore wind energy industry has undergone rapid and substantial growth, marking a significant expansion over the past decades. Forecasts from reputable sources indicate that the global offshore wind energy sector has the potential to reach a capacity range of 380 GW to 394 GW by the year of 2032, which would represent a six-fold increase in offshore wind capacity over the next decade (Musial et al., 2023). Nowadays, platform developers prefer to select deep-water regions (over 60 meters) to install floating offshore wind turbines (FOWTs) because of the abundant wind resources. On the other hand, the harsh environment in deep water regions may pose a risk to offshore structures. Therefore, depending on the installation site, various floating offshore structures, such as semi-submersible platforms, tension leg platforms (TLPs), and spar platforms, have been considered as supporting structures for FOWTs. Among these options, approximately 80% of projects plan to use semi-submersible platforms (Musial et al., 2023). In general, these platforms are primarily supported by large columns, and dampers are commonly attached to the bottom of the FOWT to improve motion performance. The cylindrical columns typically generate significant diffraction effects when exposed to incident waves, which rapidly amplify local free-surface elevation around these cylindrical structures. Platform designers must consider two principal localized free surface effects based on this phenomenon: air gap and wave run-up (Morris-Thomas and Thiagarajan, 2004).
According to the DNV-RP-C103 (DNV GL, 2015), the air gap indicates the distance between the highest wave crest and the bottom of the deck box. The design of offshore platforms must satisfy the criteria for a sufficient air gap so that the maximum height of the wave run-up can always be maintained below the platform deck. A 1.5-meter margin is commonly suggested as the critical value for the air gap (API, 2001). An insufficient air gap may induce wave impact or ingress on the deck and upper structures. On the other hand, an excessive air gap may increase fabrication costs and decrease the stability of the offshore platform (Morris-Thomas and Thiagarajan, 2004). The wave run-up is induced by the rapid amplification of the local free surface elevation due to the interaction between the incident waves and the columns of offshore platforms. When an incident wave impinges on the column, it undergoes a significant transformation, where the momentum of incident waves in the vertical direction (upward) increases instantaneously. Finally, this extra momentum flux transforms into a rapid wave amplification at the interaction point between the wave and body surfaces.
The wave run-up problem of offshore structures is an important issue that platform designers focus on because the precise predictions of this phenomenon are crucial for the air gap requirement. In particular, many studies have investigated the wave run-up problems around a truncated cylinder using experimental and numerical methods. Regarding numerical simulations, potential flow analysis has been widely used to predict wave run-up and wave impact. Havelock (1940), who used an analytical solution based on linear wave theory, conducted the earliest studies on the wave-body diffraction problem around a truncated cylinder in deep water. Omer and Hall (1949) and MacCamy and Fuchs (1954) extended Havelock’s work to shallow and arbitrary water depths, respectively. Morris-Thomas and Thiagarajan (2004) conducted a model test and potential flow calculations to discuss the wave run-up on a fixed truncated cylinder with zeroth-, first-, second-, and third-order harmonic analysis in monochromatic progressive waves. They reported that distinct nonlinear effects should be predicted by high-order diffraction theory in long waves. On the other hand, compared to potential analysis, computational fluid dynamics (CFD) simulations could provide more accurate predictions of wave run-up by considering both nonlinear and viscous effects. Numerous scholars have conducted CFD simulations on the wave diffraction problem of a truncated circular cylinder. Kim et al. (2011) proposed a hybrid numerical wave tank (NWT) model by matching the potential far-field wave solutions and near-field CFD solutions based on the ALE finite-element method (FEM). The simulation results of wave run-up showed good agreement with the model test data. Koo et al. (2014) applied the commercial CFD code STAR-CCM+ to investigate the wave run-up height and depression depth around a circular cylinder under various Froude numbers (Fn). Mohseni et al. (2018) conducted a CFD simulation using OpenFOAM to investigate the physics of wave scattering and wave run-up around a truncated cylinder, considering various wave steepness. They reported that the formation of lateral edge waves becomes more significant with high-steepness waves.
In offshore engineering, various dampers are commonly attached to the base of the supporting column to improve the motion performance of FOWTs. Semi-submersible FOWT platforms, including WindFloat (Roddier et al., 2010), OC4-DeepCWind (Robertson et al., 2014), Tri-floater (Lefebvre and Collu., 2012), and Dutch Tri-floater (Huijs et al., 2014), all share a common design feature. They are composed of three circular truncated cylinders which are attached with the dampers. In addition to the improvement of the motion response, the presence of dampers also amplifies the wave run-up, which is undesirable.
The present study examined the effects of various types of dampers on the nonlinear wave run-up around a fixed truncated cylinder by conducting a series of CFD simulations. Section 2 describes the numerical method to construct a numerical wave tank (NWT) with a truncated circular cylinder in regular waves. Section 3 assesses the accuracy of the present numerical scheme, and a spatial convergence study was performed based on the Grid Convergence Index (GCI) method. The validity of the present NWT was confirmed by comparing the wave run-up around a bare truncated cylinder with existing experimental results (Nam et al., 2008). Section 4 discusses the effect of three types of dampers on the wave run-ups around a truncated cylinder. The changes in the first- and second-order harmonic components and mean values of the wave run-up were analyzed, respectively.
2. Numerical Method
2.1 Numerical Method
Wave run-up around a truncated cylinder with various dampers was numerically analyzed. The numerical simulations were conducted with the CFD software STAR-CCM+ (Ver.15.04.008). The governing equations consist of a continuity equation (Eq. (1)) and a three-dimensional momentum equation, assuming air and water are incompressible viscous Newtonian fluids. The unsteady Reynolds- averaged equation of Navier-Stokes equation (URANS) is expressed as Eq. (2):
2.2 Grid System and Analysis Method
A truncated cylinder model with a scale ratio of 50.314 was selected for this study, matching the experimental model used by Nam et al. (2008) in their model test. During the test, five wave probes were attached to the surface of the truncated cylinder. These wave probes were positioned at 0°, 45°, 90°, 135°, and 180° with respect to the direction of the incident wave. Fig. 1 presents the top view of the wave probes.

Position of wave probes on the truncated cylinder
Fig. 2 shows the computational domain and boundary conditions. The length and width of the entire computational domain were 4.5 times the wavelength and 1.5 times the wavelength, respectively. The water depth was set to one wavelength to approximate the deep-water condition. The computational domain was divided into two parts: an inner zone to examine the physics of wave run-up and a forcing zone to ensure accurate wave generation upstream and prevent reflected waves at the boundaries. The length of the forcing zone is twice the wavelength in the downstream and half the wavelength in the upstream and the lateral boundaries, respectively. Fig. 3 presents the side view of the grid system. The relaxation zone incorporates gird damping and numerical forcing zones to prevent the reflected waves from downstream. The grid size in the computational zone was chosen as 150 grid points per wavelength and 20 grid points per wave height, respectively. Fig. 4 shows the detailed cell configuration near the damping plates.
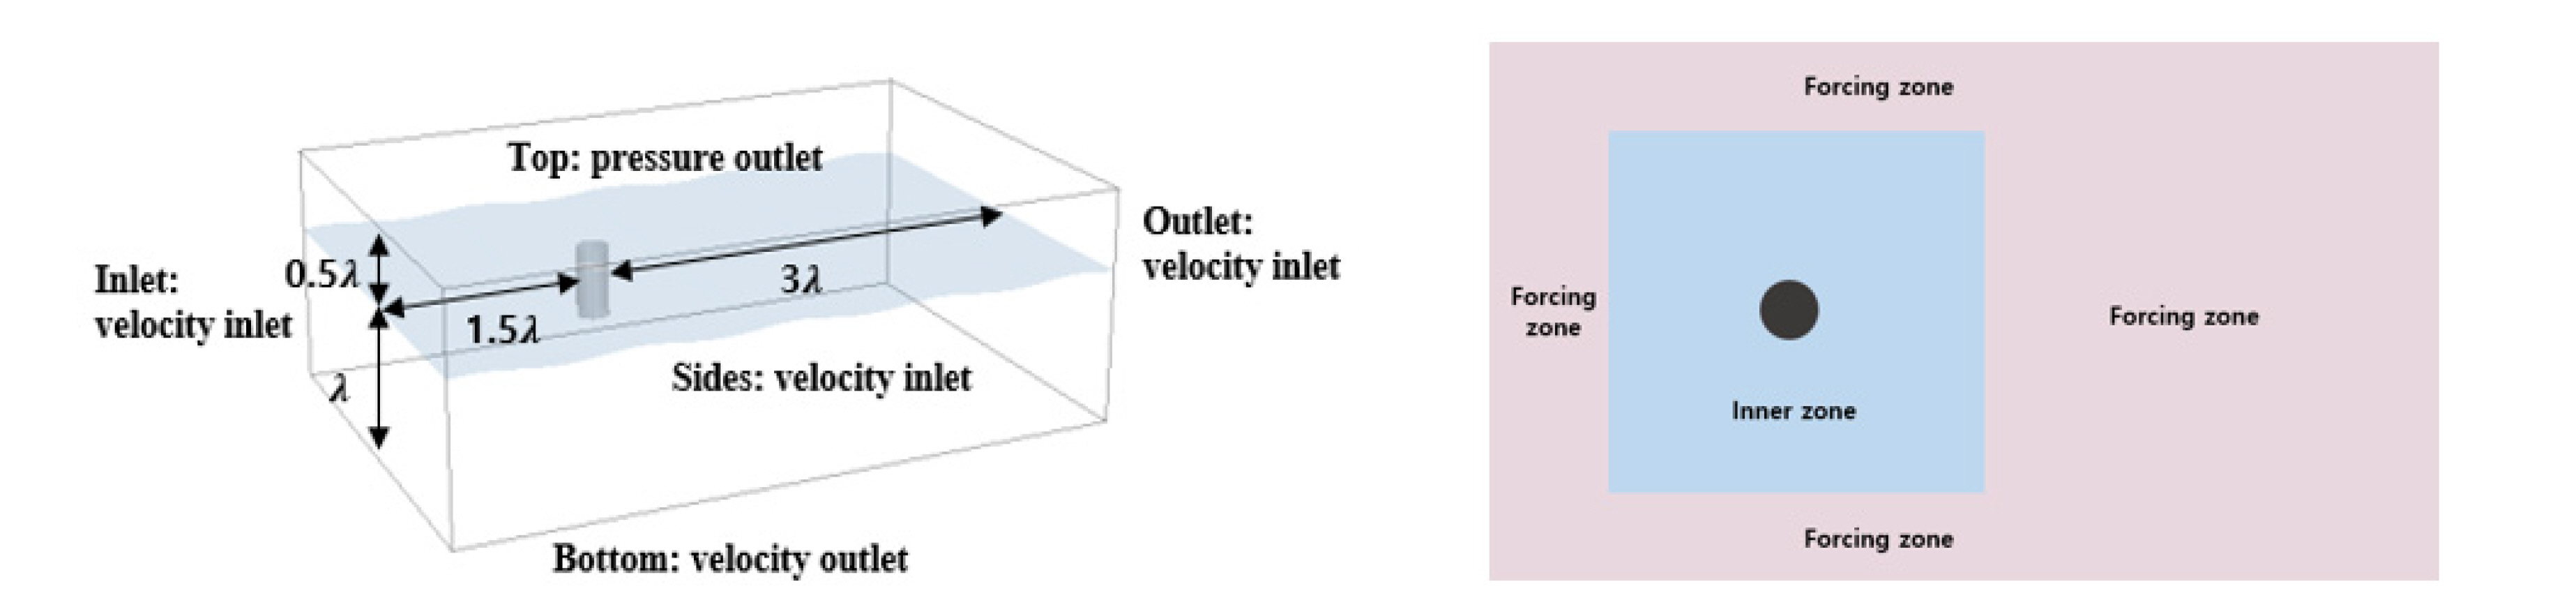
Computational domain and boundary conditions
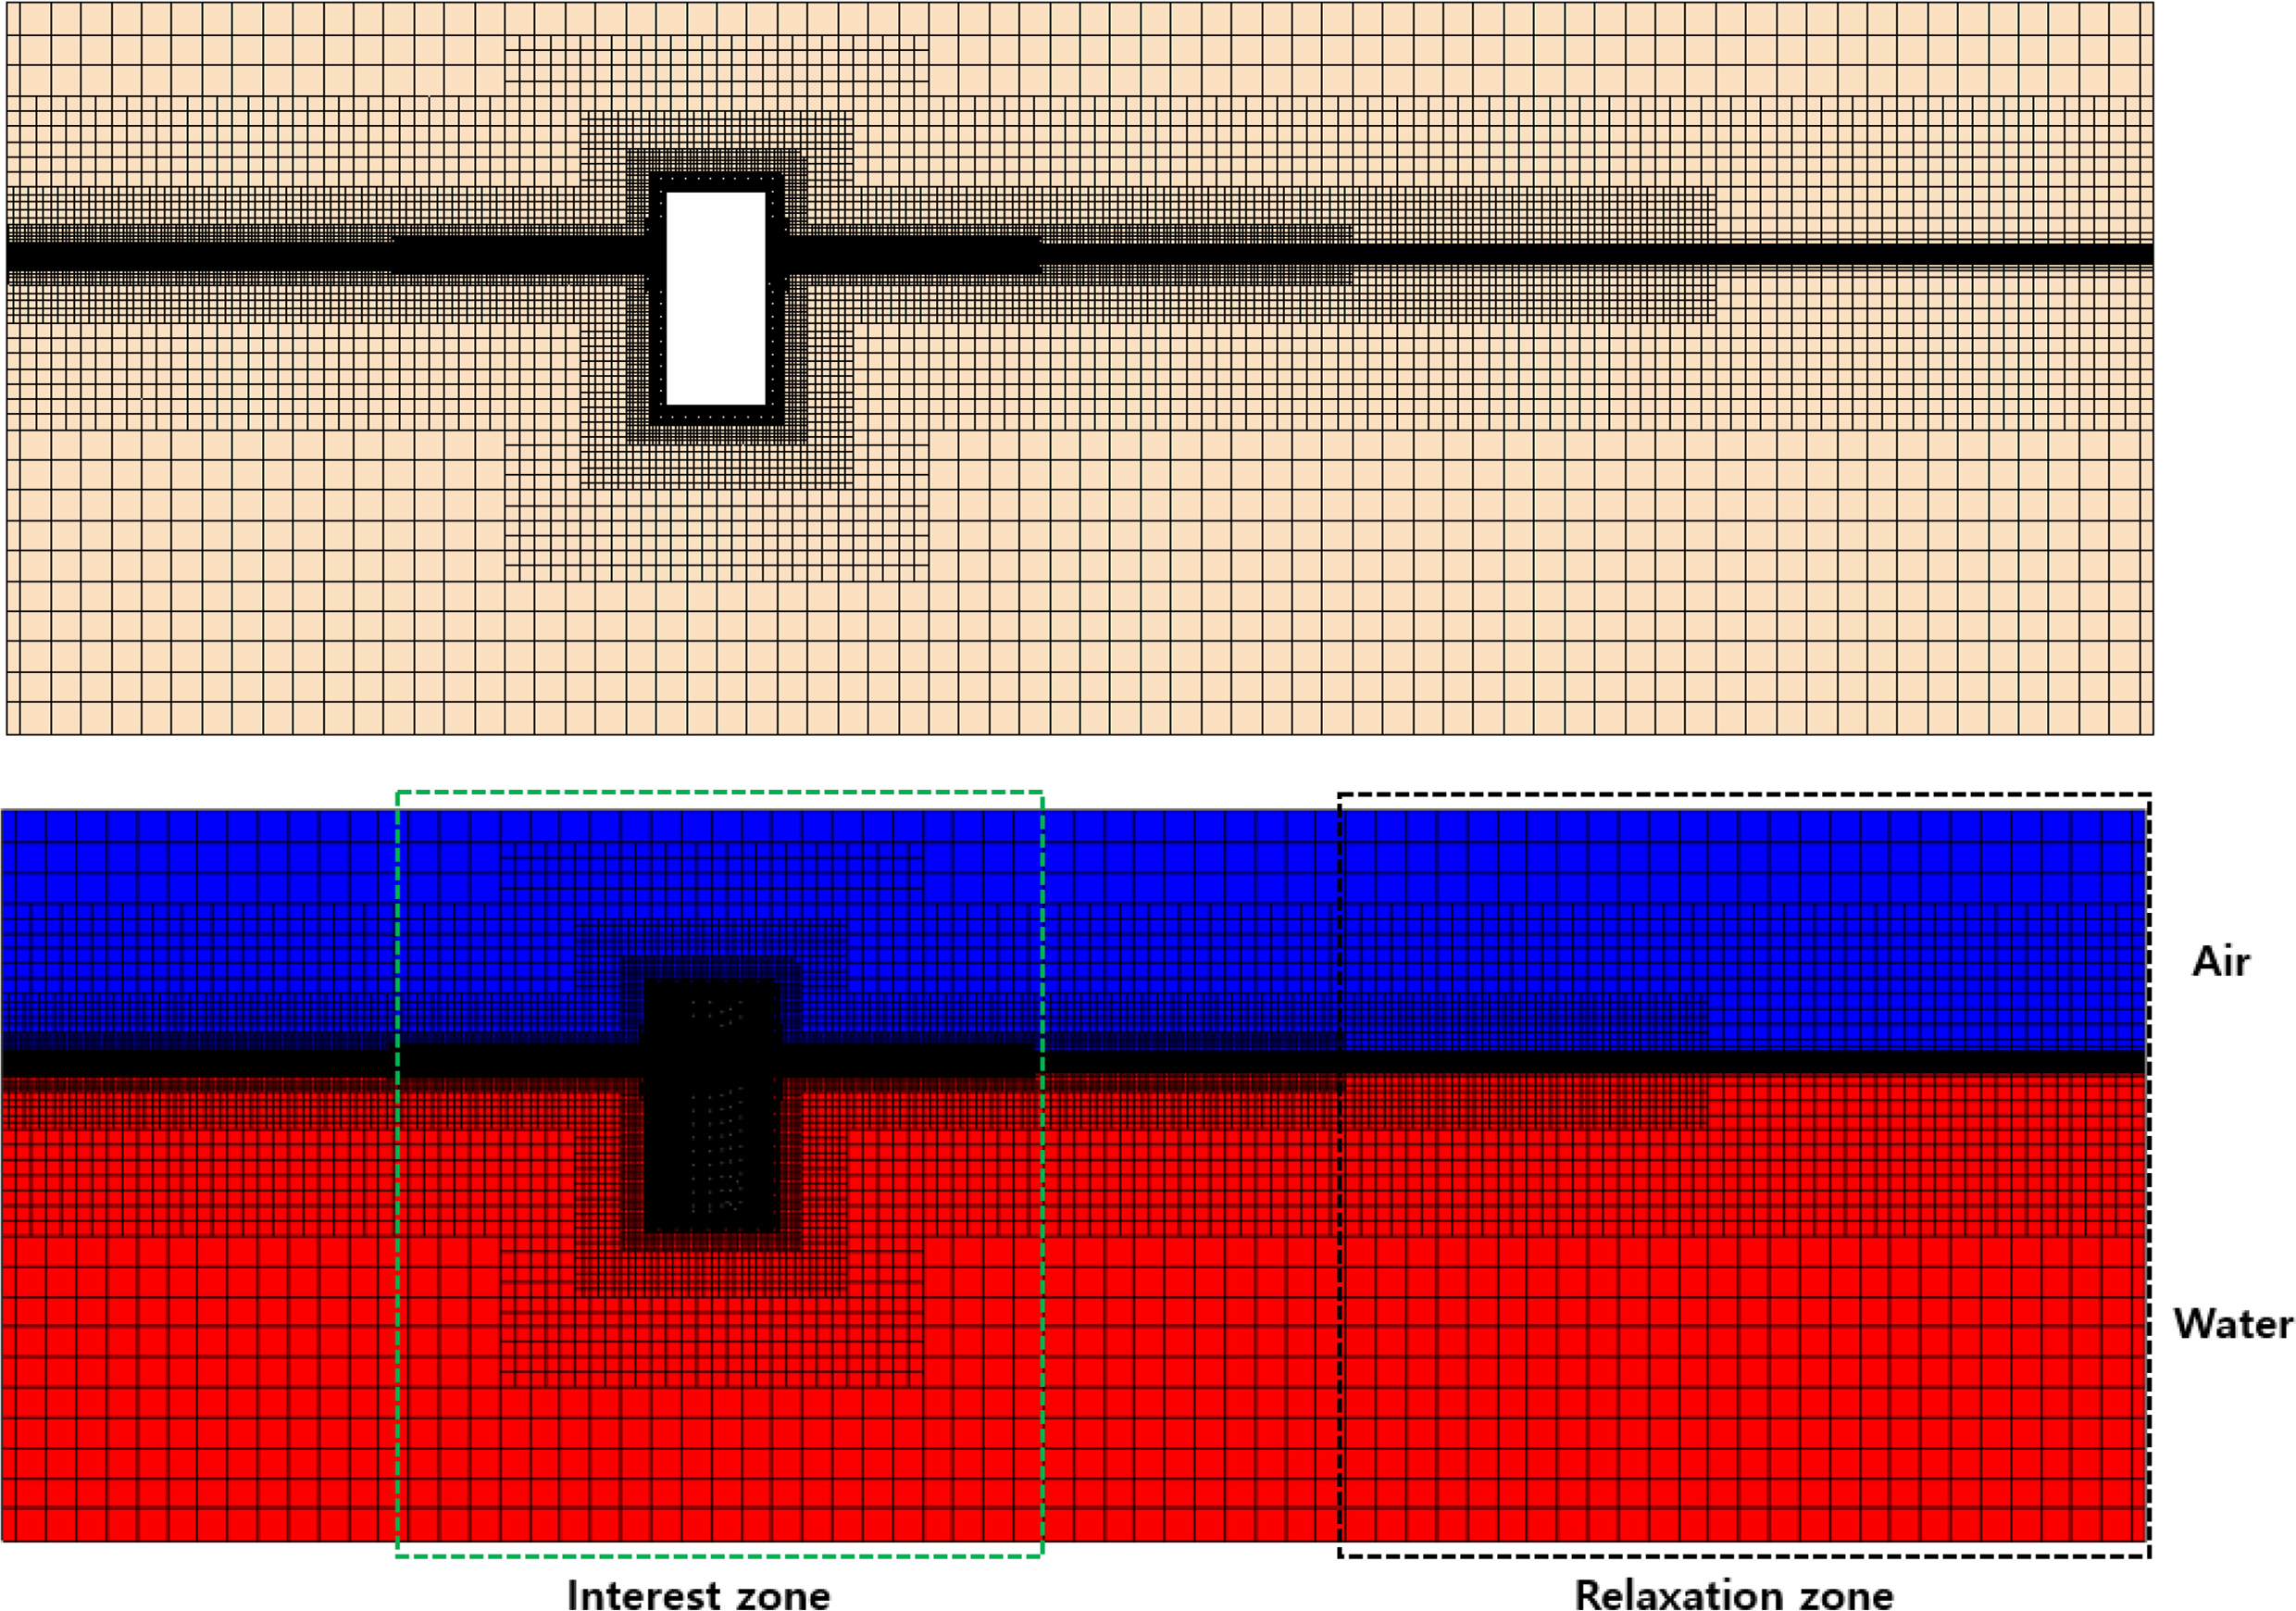
Grid system
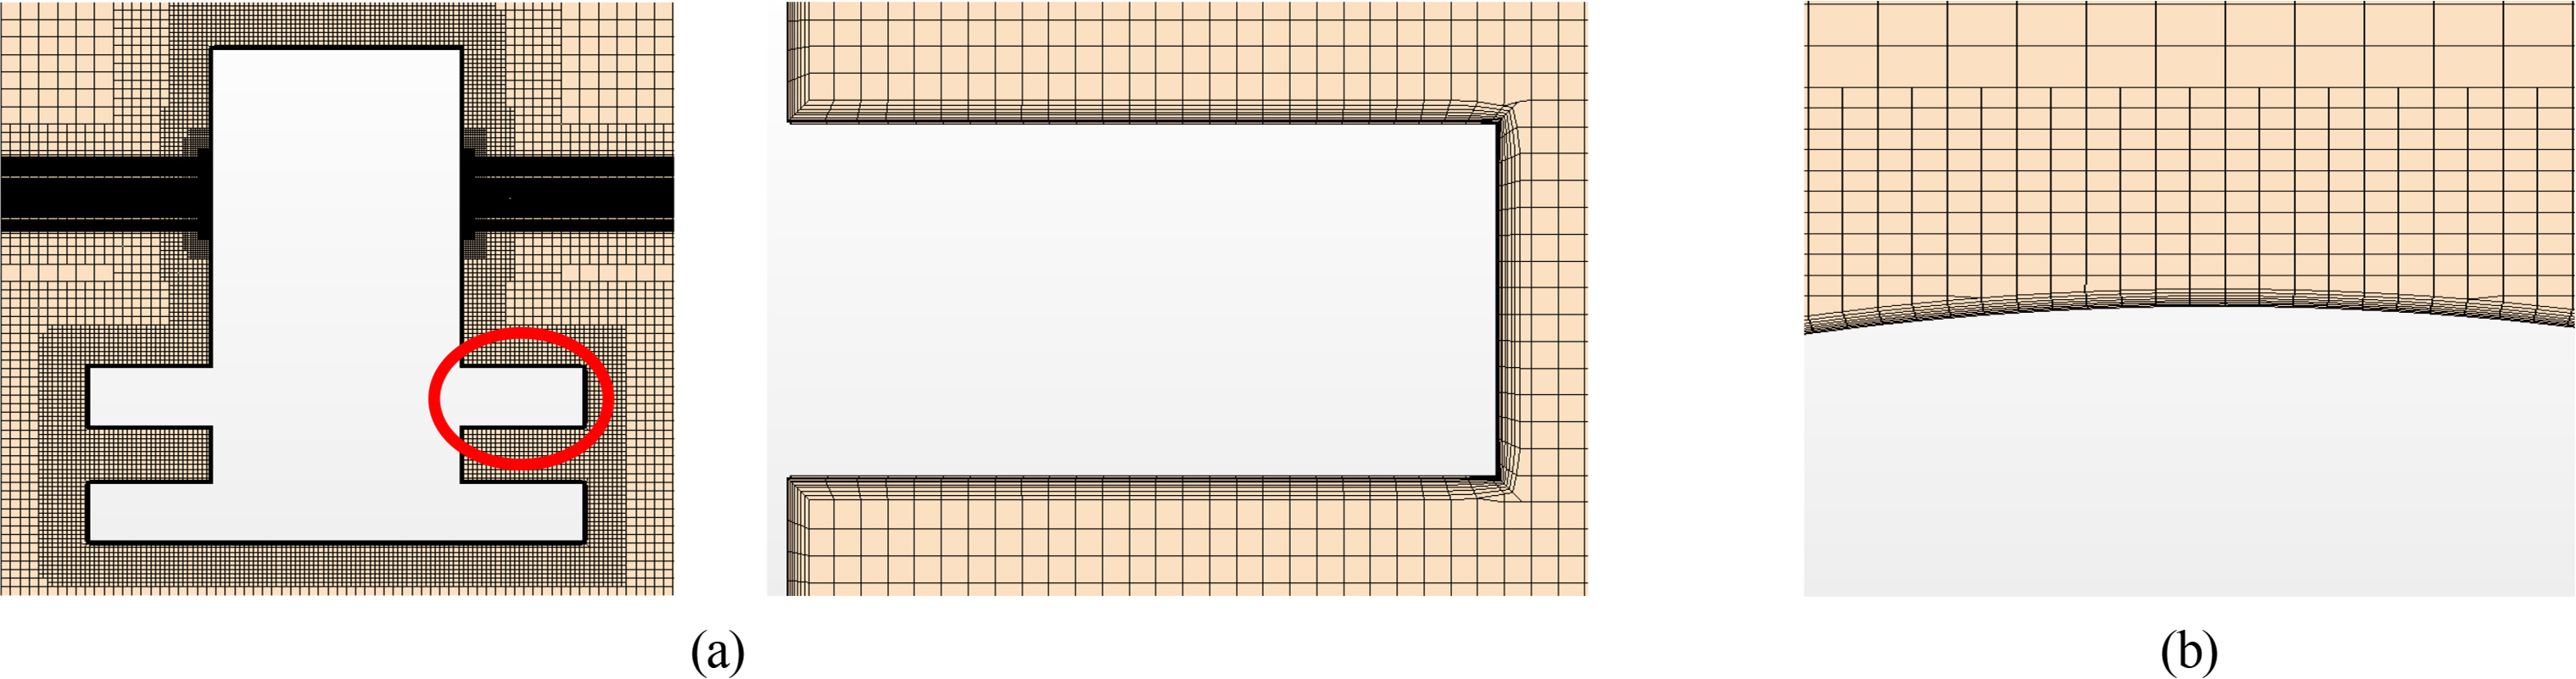
Grid configuration adjacent to the damping plate: (a) side view and (b) top view
The Discrete Fourier transform (DFT) method was applied to extract the first- and second-order harmonic components of wave run-up. Fig. 5 gives an example of the harmonic components of the wave elevation. The first-(η1), second- (η2), and third- (η3) order harmonic components of the wave run-up are effectively extracted using DFT.
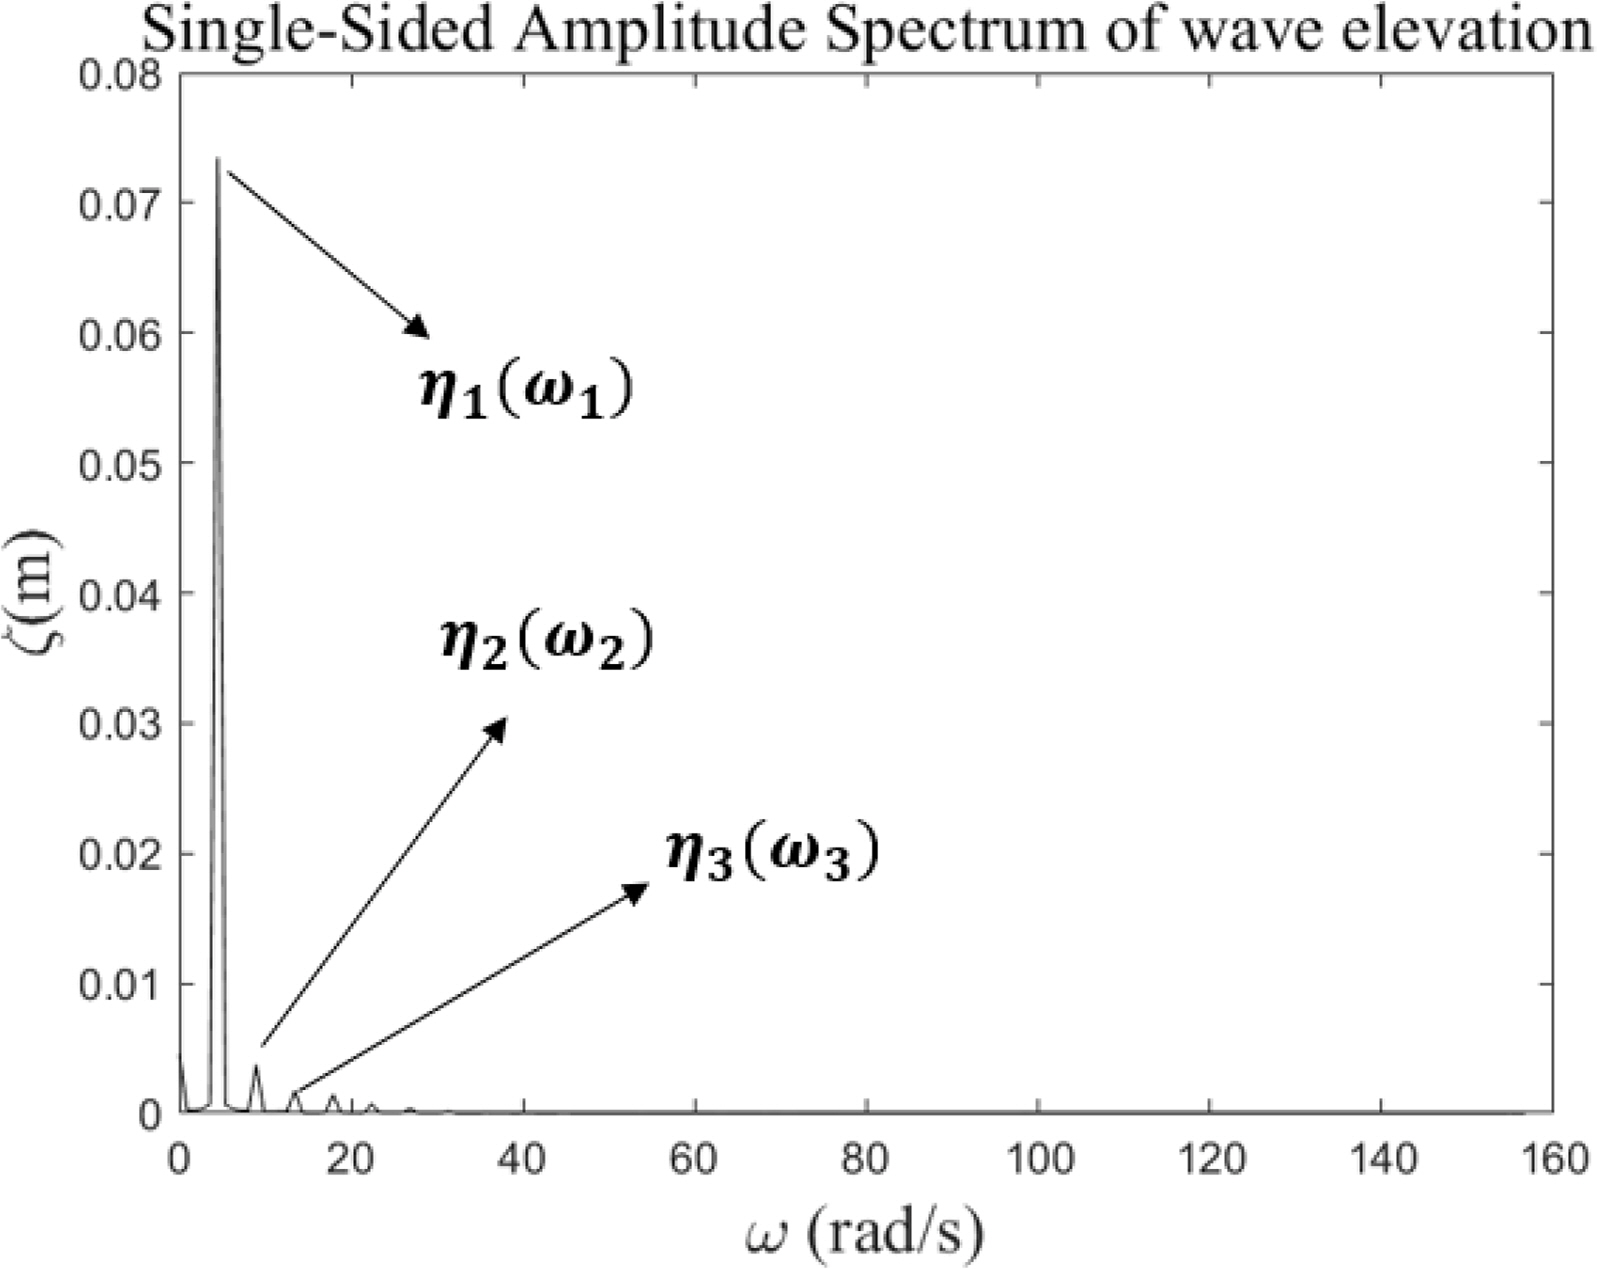
DFT results for the wave run-up time series (ω: wave frequency, ζ: wave amplitude)
3. Numerical Validation
3.1 Verification of Incident Waves
Nam et al. (2008) conducted experiments under 24 regular wave conditions, including six different wave periods (T = 7 s, 8 s, 9 s, 10 s, 11 s, and 12 s) with four different wave steepness values (
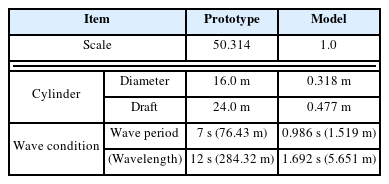
Dimensions of truncated cylinder and wave conditions
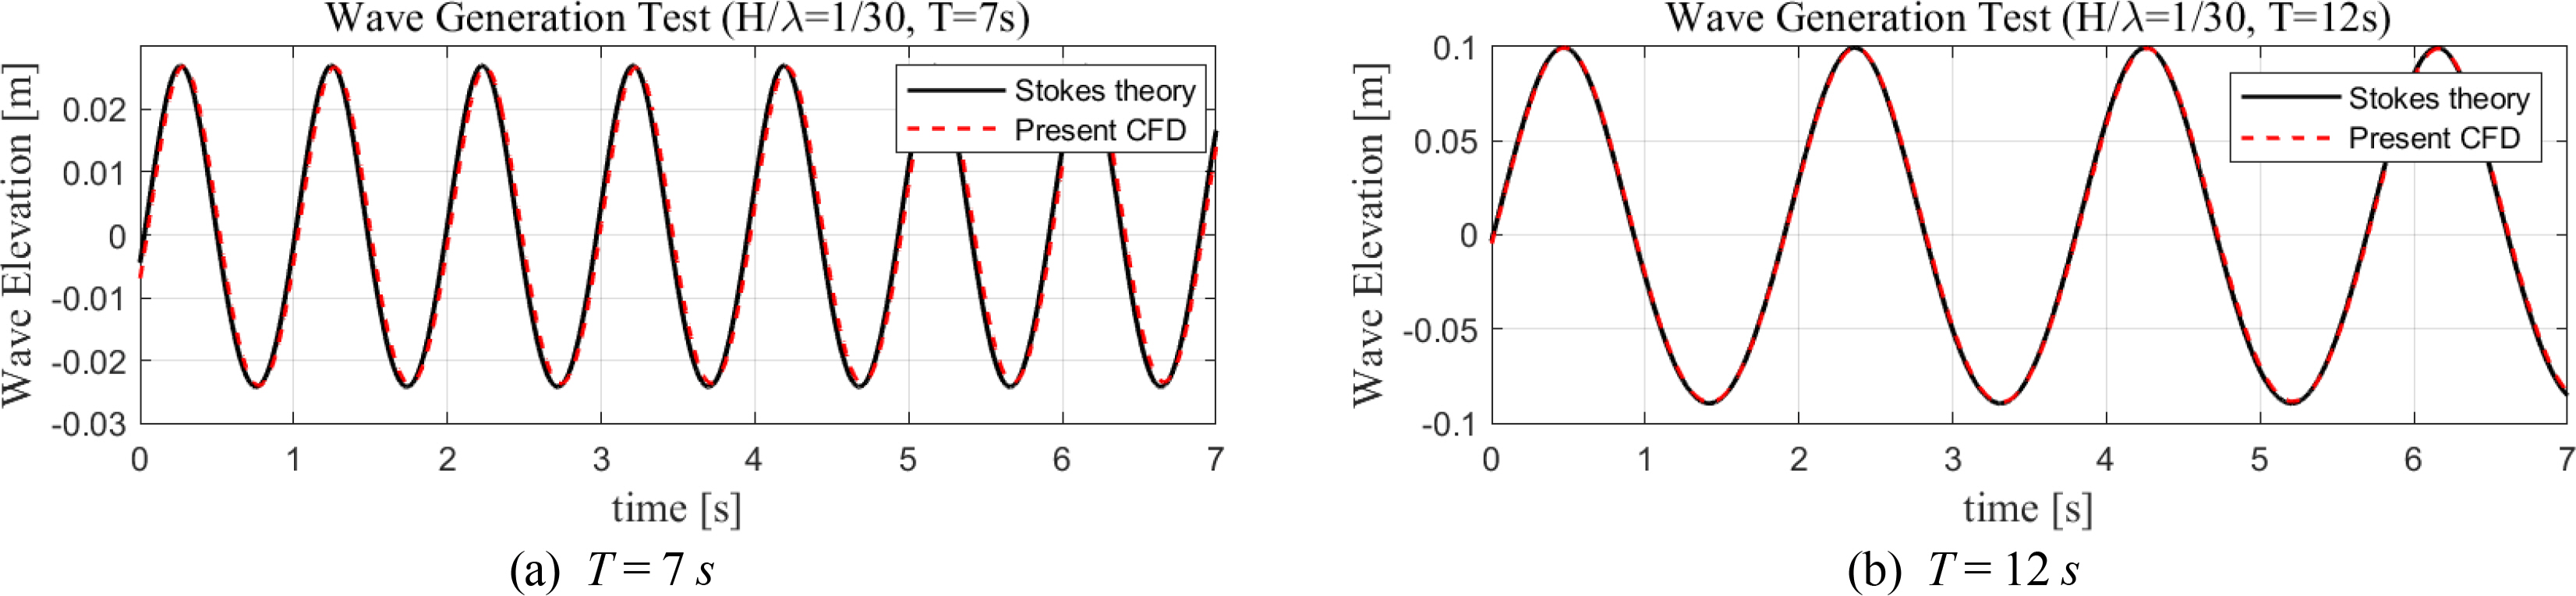
Simulation tests of regular waves were conducted to verify the accuracy of wave generation in the present numerical wave tank. The calculated wave elevation time series was compared directly with the analytic solutions based on the fifth-order Stokes theory (Fenton, 1985). Fig. 6 compares the wave elevations between the simulation and theory. Table 2 lists the discrepancies between the wave elevations of theory and simulation. These results suggest that the present numerical wave tank can accurately generate the desired regular waves and effectively control wave dissipation.
Comparison of the time history of wave generation (H/λ =1/30)

Comparison of wave elevation between theory and simulation
3.2 Convergence Study
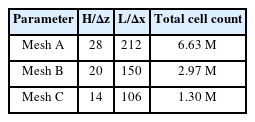
As for spatial convergence in CFD simulations, the GCI method was used to estimate the discretization errors. In the present study, convergence analysis was performed with a focus on the crest values of the wave run-up around the truncated cylinder under the conditions of T =7 s and H/λ = 1/30. Three different meshes (Meshes A, B, and C) were considered, with a refinement factor (r) chosen as √2. Table 3 provides detailed information for three mesh resolutions.
Spatial discretization for grid convergence study
The changes in the numerical solution between Meshes A and B are denoted as ∊BA =(ηB − ηA), and the changes between Meshes B and C are denoted as ∊CB =(ηC − ηB), respectively. Based on the GCI method, the convergence ratio (R), order of accuracy (P), and GCI index were calculated using the following equations:
The GCI index indicates an error band, representing how far the solution deviates from the asymptotic value. Therefore, a small GCI index indicates that the computation is within the asymptotic range. NASA (AIAA, 1998) proposed a principle to ensure that the grids are within the asymptotic range of convergence by checking that

Convergence statics for the normalized first-order harmonic components of wave run-up
3.3 Validation of Wave Run-Up on a Bare Truncated Cylinder
Before conducting the CFD simulations for a cylinder with dampers, it is necessary to ensure the accuracy of the present numerical method. The validation of wave run-up and harmonic analysis around a bare truncated cylinder (without a damper) was performed by comparing the results of the present CFD simulations with the experimental data (Nam et al., 2008). The simulations for wave run-up were conducted for 10 wave periods, and the harmonic components were extracted using DFT over a time window of the last five periods. The first- and second-order harmonic components, as well as mean values of wave run-up, were directly compared to facilitate a precise comparison.
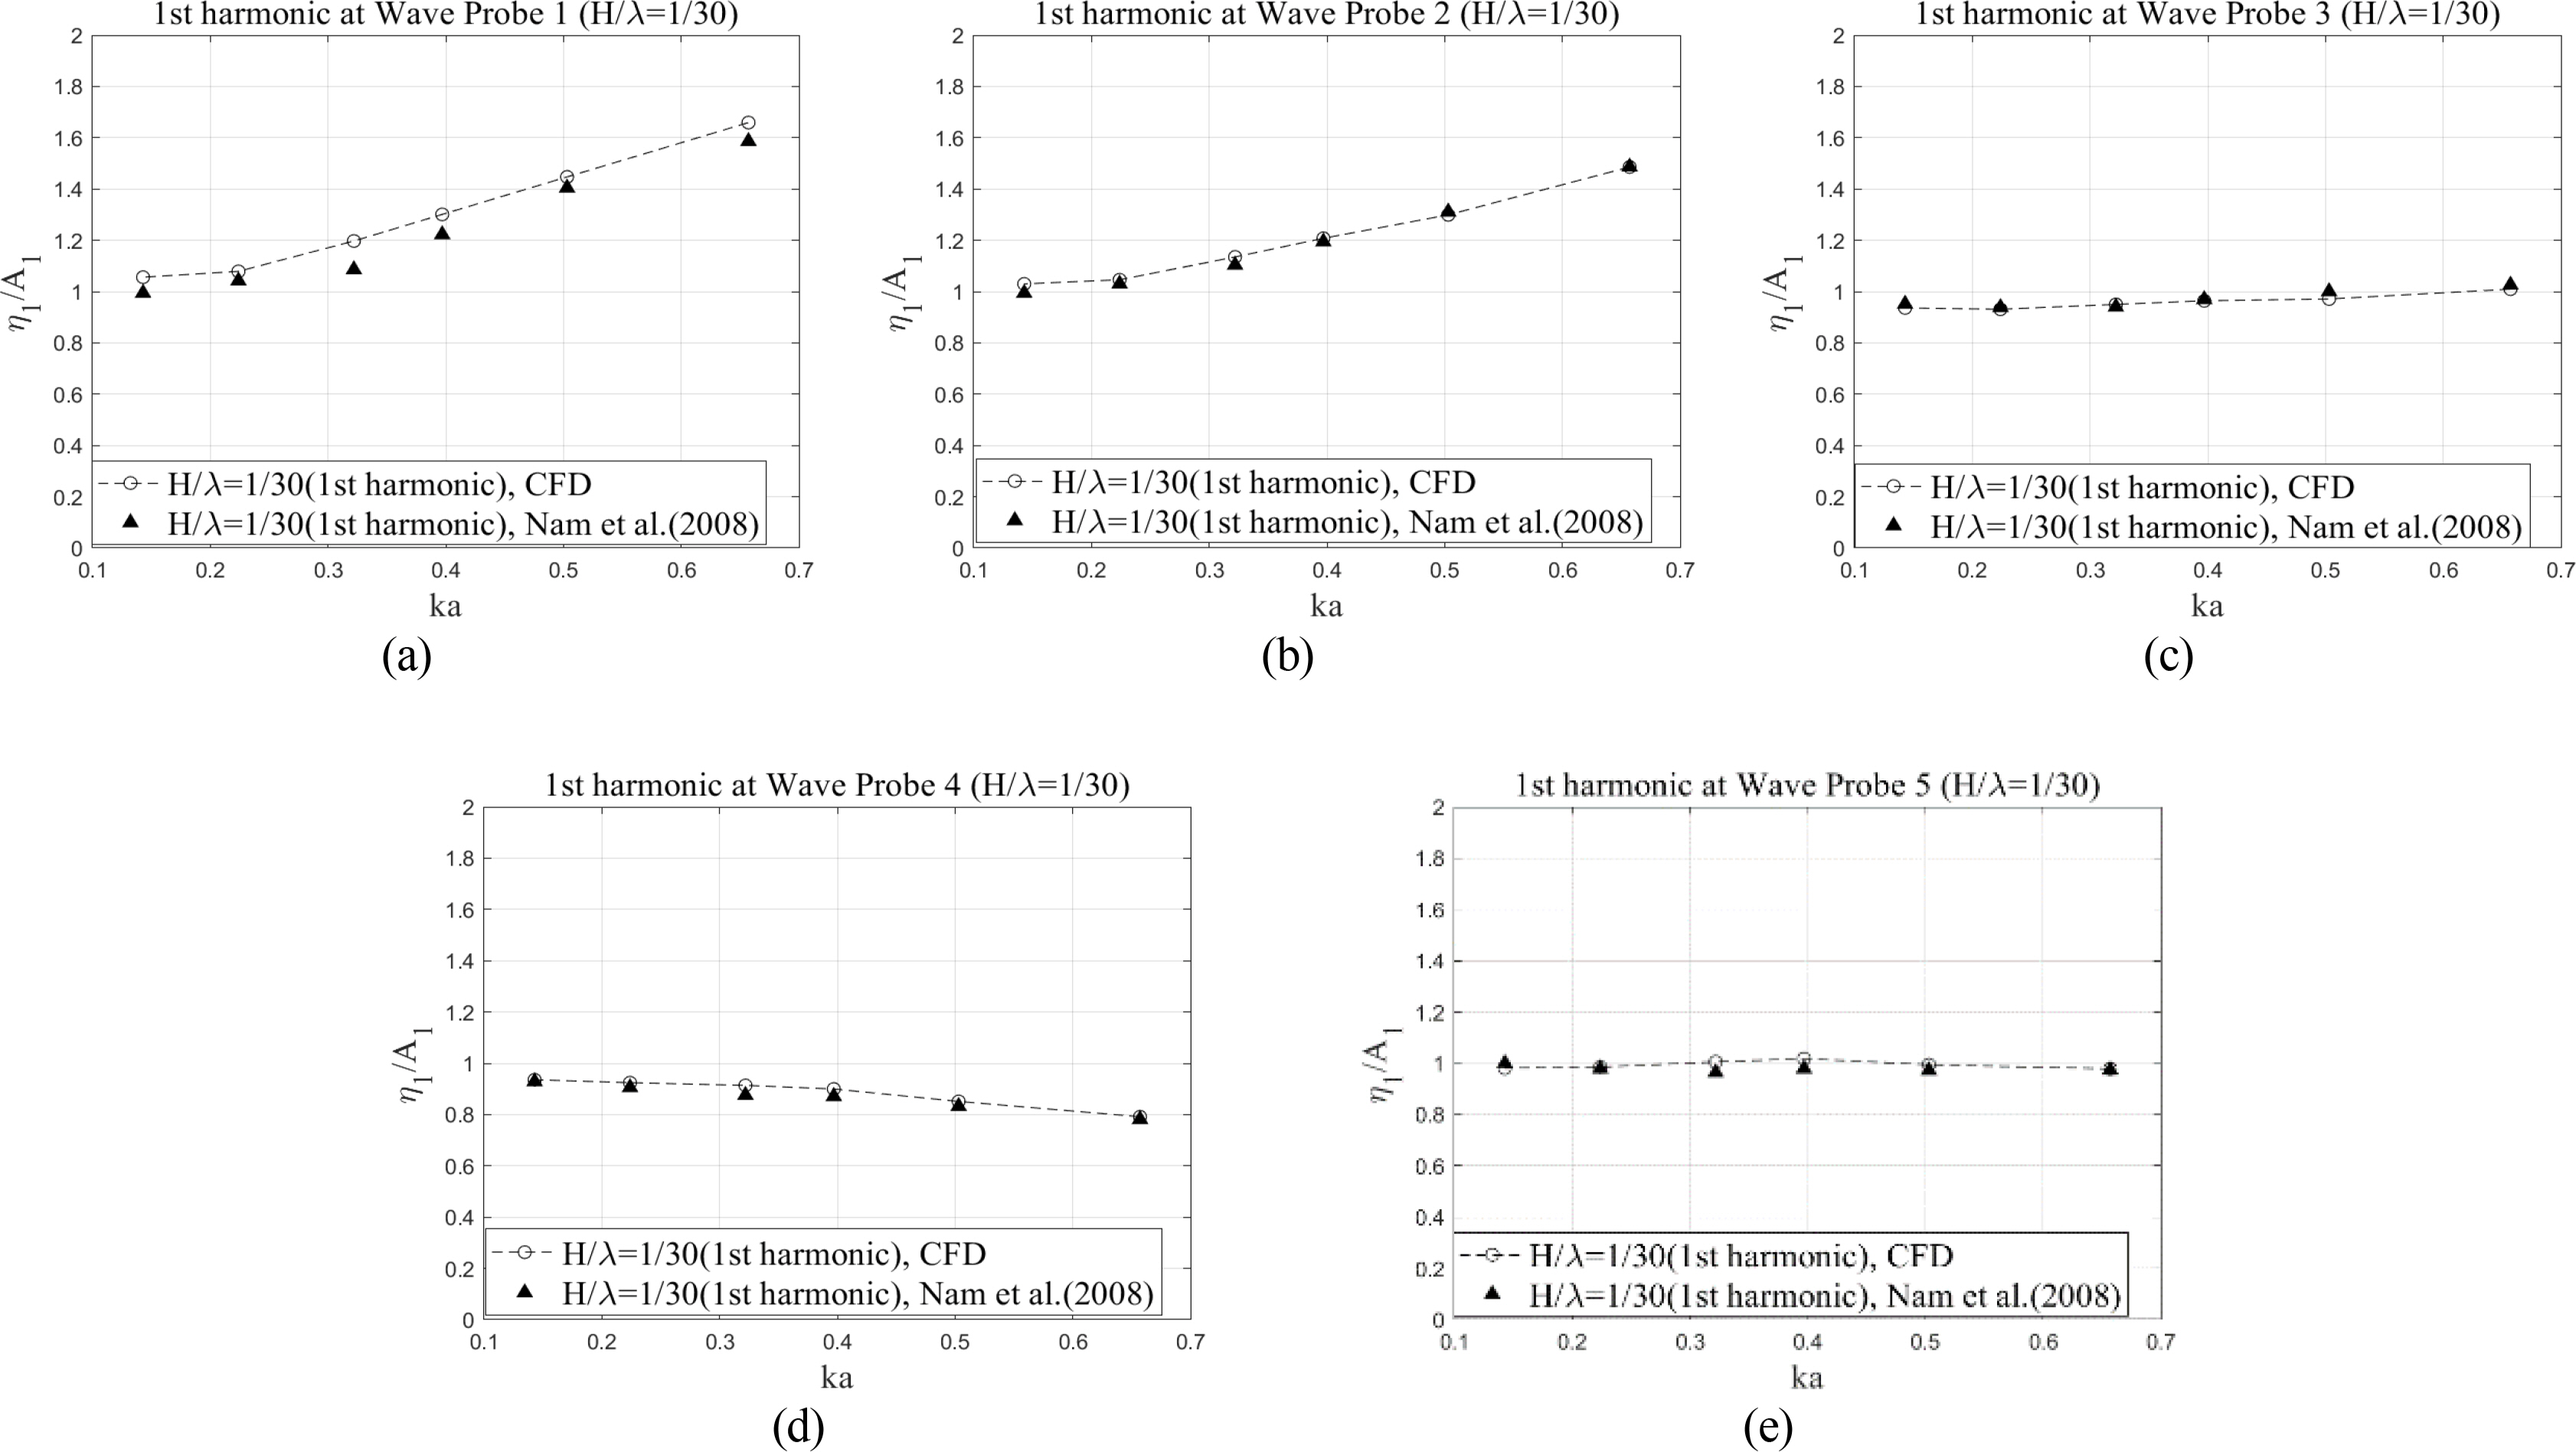
The first-order harmonic component represents the amplitude (η1) of wave run-up corresponding to the fundamental wave frequency (ω). In the present study, the first-order harmonic component of wave run-up around the cylinder was normalized to the first-order harmonic amplitude of the incident wave (A1). Fig. 7 compares normalized first-order harmonic components of wave run-up on the surface of the cylinder with respect to various scattering parameters (ka).
Comparison of the first-order harmonic components of wave run-up between EFD & CFD results
The second-order harmonic component indicates the amplitude (η2) of wave run-up corresponding to the double wave frequency (2ω). Regarding the second-order harmonic components, the nonlinear interaction was more significant, particularly for short waves at the rear and shoulder points, and for long waves at the front and rear points of the truncated cylinder (Mohseni et al., 2018). The mean set up/down denotes the average time history for the free surface elevation. Both the mean set-up/down and the second-order harmonic components of the wave run-up were normalized to
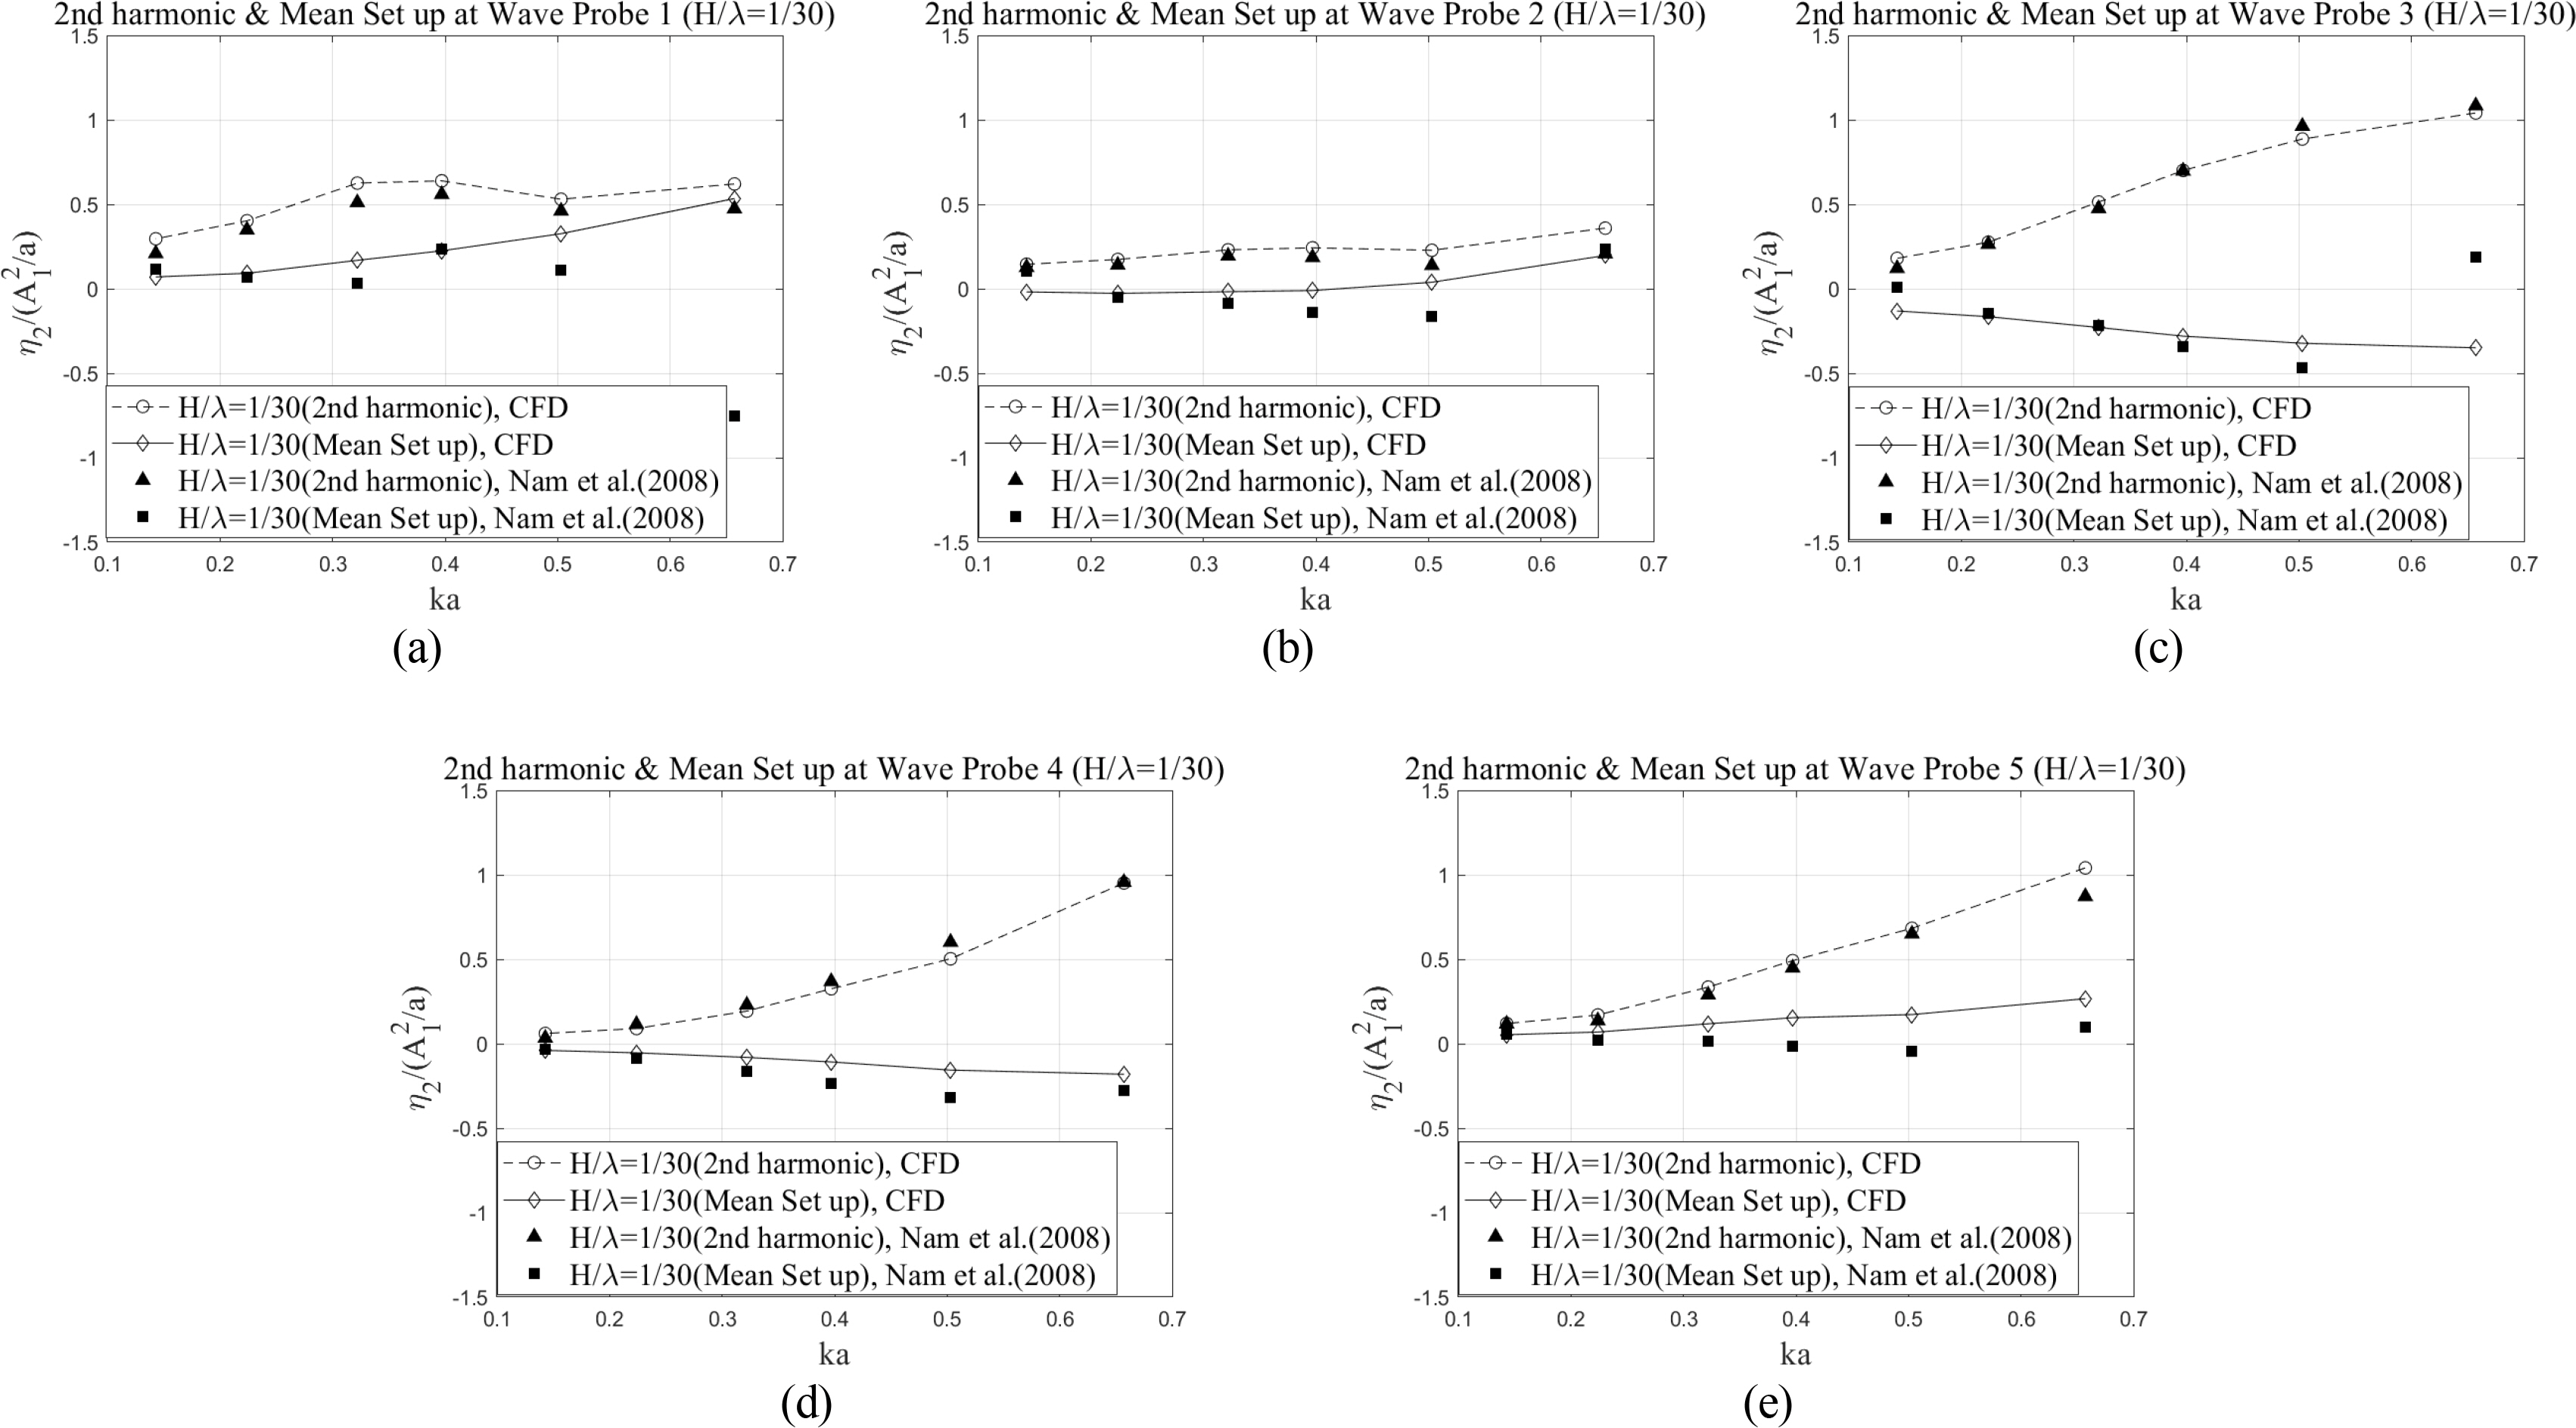
Comparison of the second-order harmonic components and mean set-up components of wave run-up between EFD and CFD results
The present CFD results for the first- and second-harmonic components agreed well with the experimental results. When the incident wave encounters the truncated cylinder, the wave propagation may be more or less disturbed because of the presence of the cylinder, causing some of the waves to be strongly reflected in front of the cylinder. This explains the relatively large wave run-up at WP1 (Fig. 7(a)). Moreover, the first-order harmonic components of wave run-up increased as the scattering parameter increased at wave probe 1, as reported by Morris-Thomas and Thiagarajan (2004). In the case of long waves, the first-order harmonic components at all the wave probes were close to one since the characteristic length of the truncated cylinder is relatively small compared to the incident wavelength. Furthermore, the mean set up/down of the free surface between the experiment and the present CFD results also matched well, except for several cases of short waves at the front and rear positions of the cylinder (Figs. 8(a) and 8(c)).
4. Results and Discussion
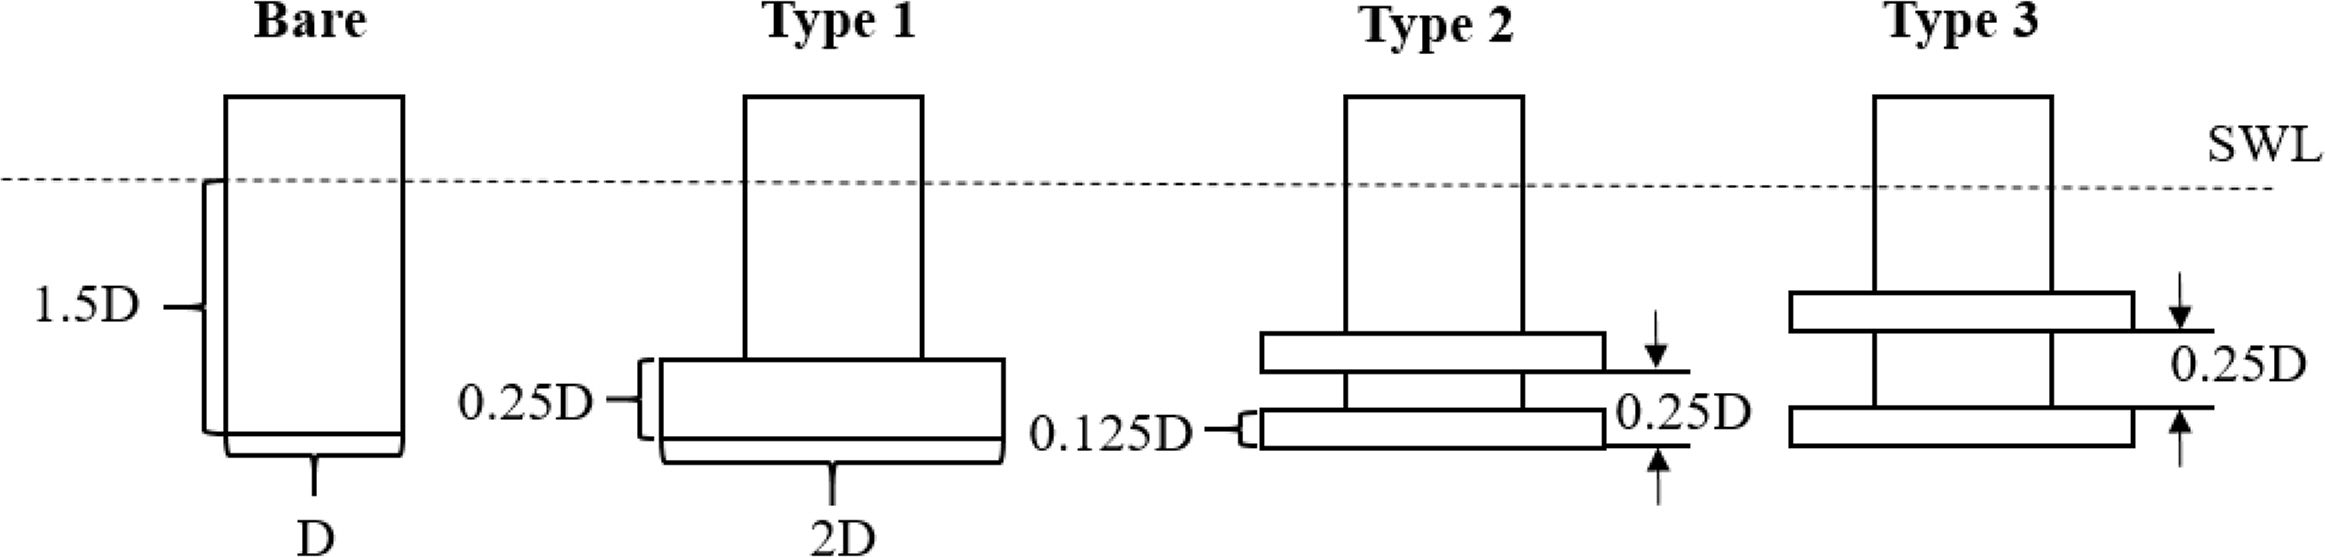
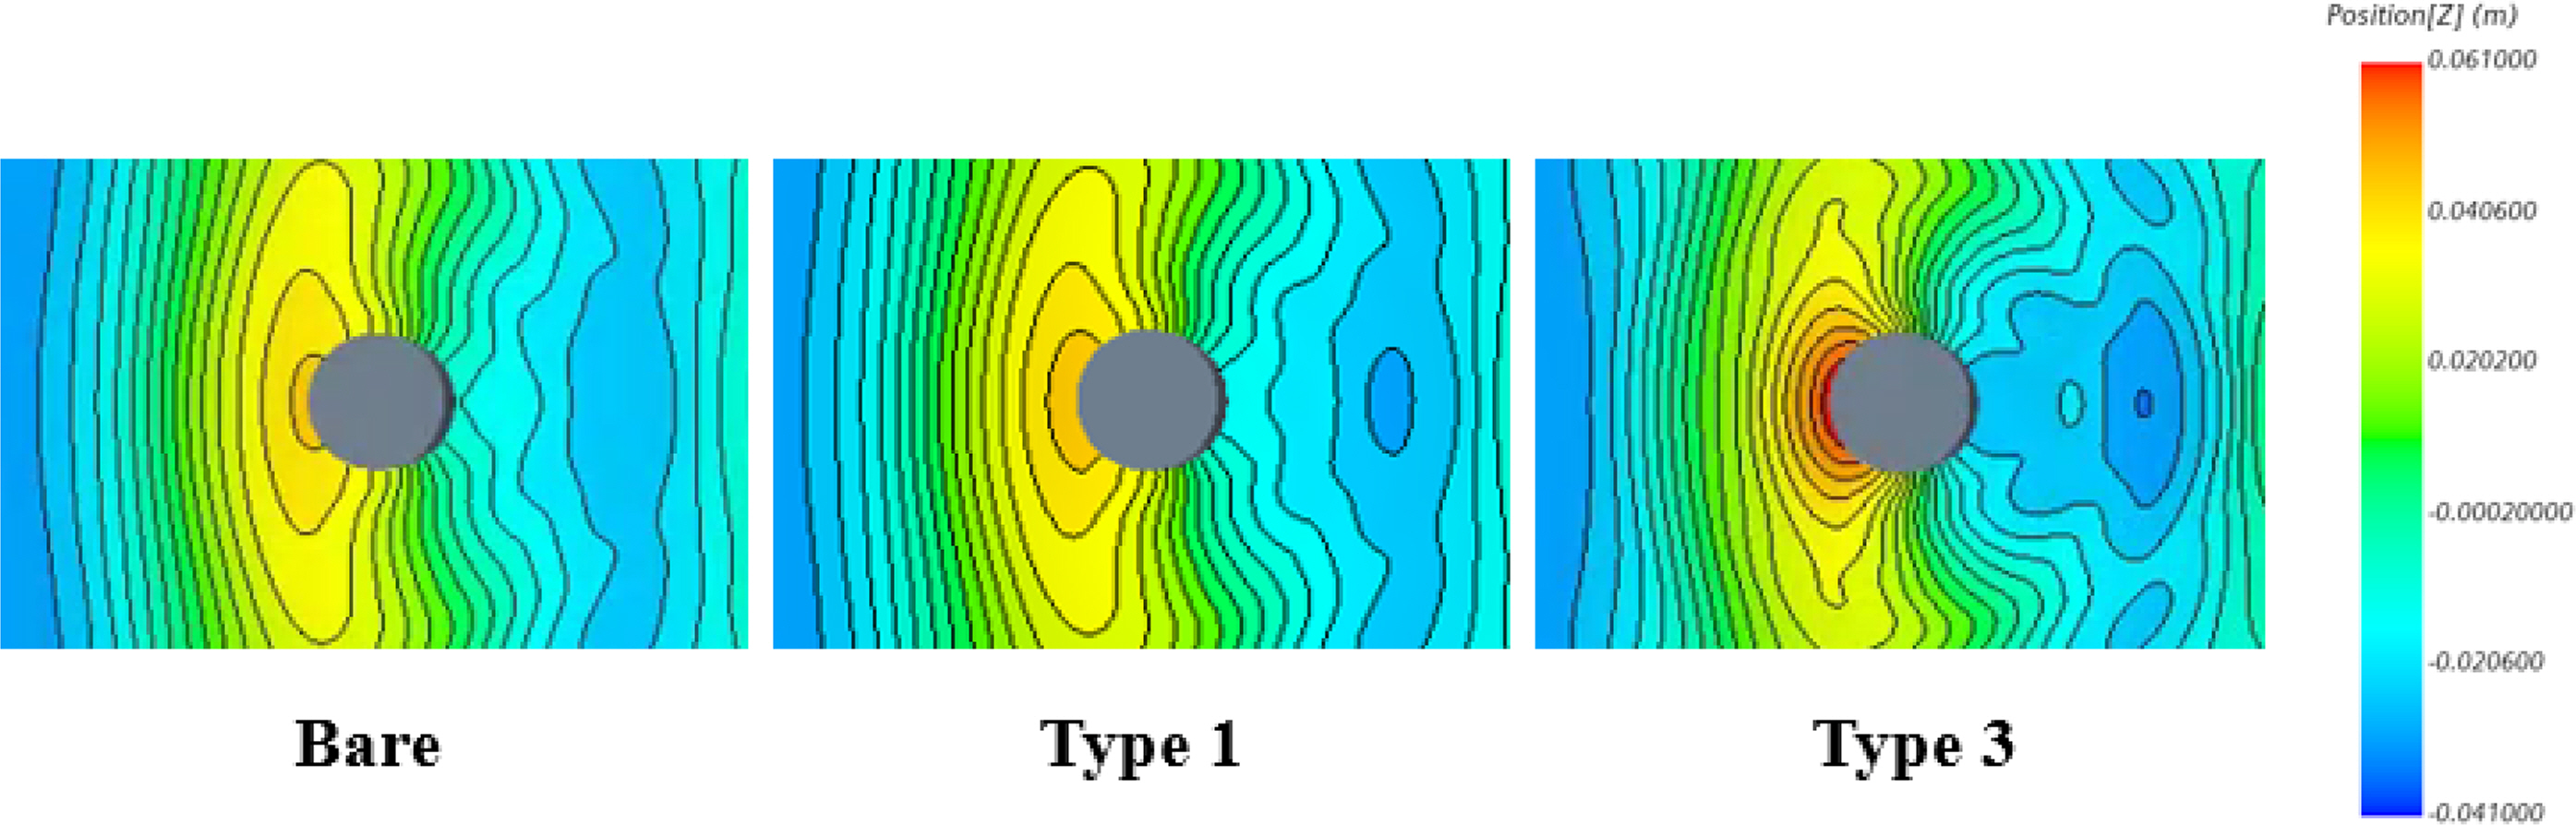
This study examined the effects of various dampers on the wave run-up around a truncated cylinder. Fig. 9 presents schematic diagrams of the cylinder with different dampers. Here, D denotes the diameter of the truncated cylinder. The cylinder draft and the total damper thickness were assumed to be the same regardless of the damper type. As shown in Fig. 9, type 1 denotes the truncated cylinder with a single damper. From types 2 to 3 cylinders, dual dampers were attached to the truncated cylinders with various separating distances (0.125 D and 0.25 D). The lower damper was always fixed at the bottom for all cylinders.
Schematic diagram of the cylinders with various dampers
4.1 Time History of Wave Elevation
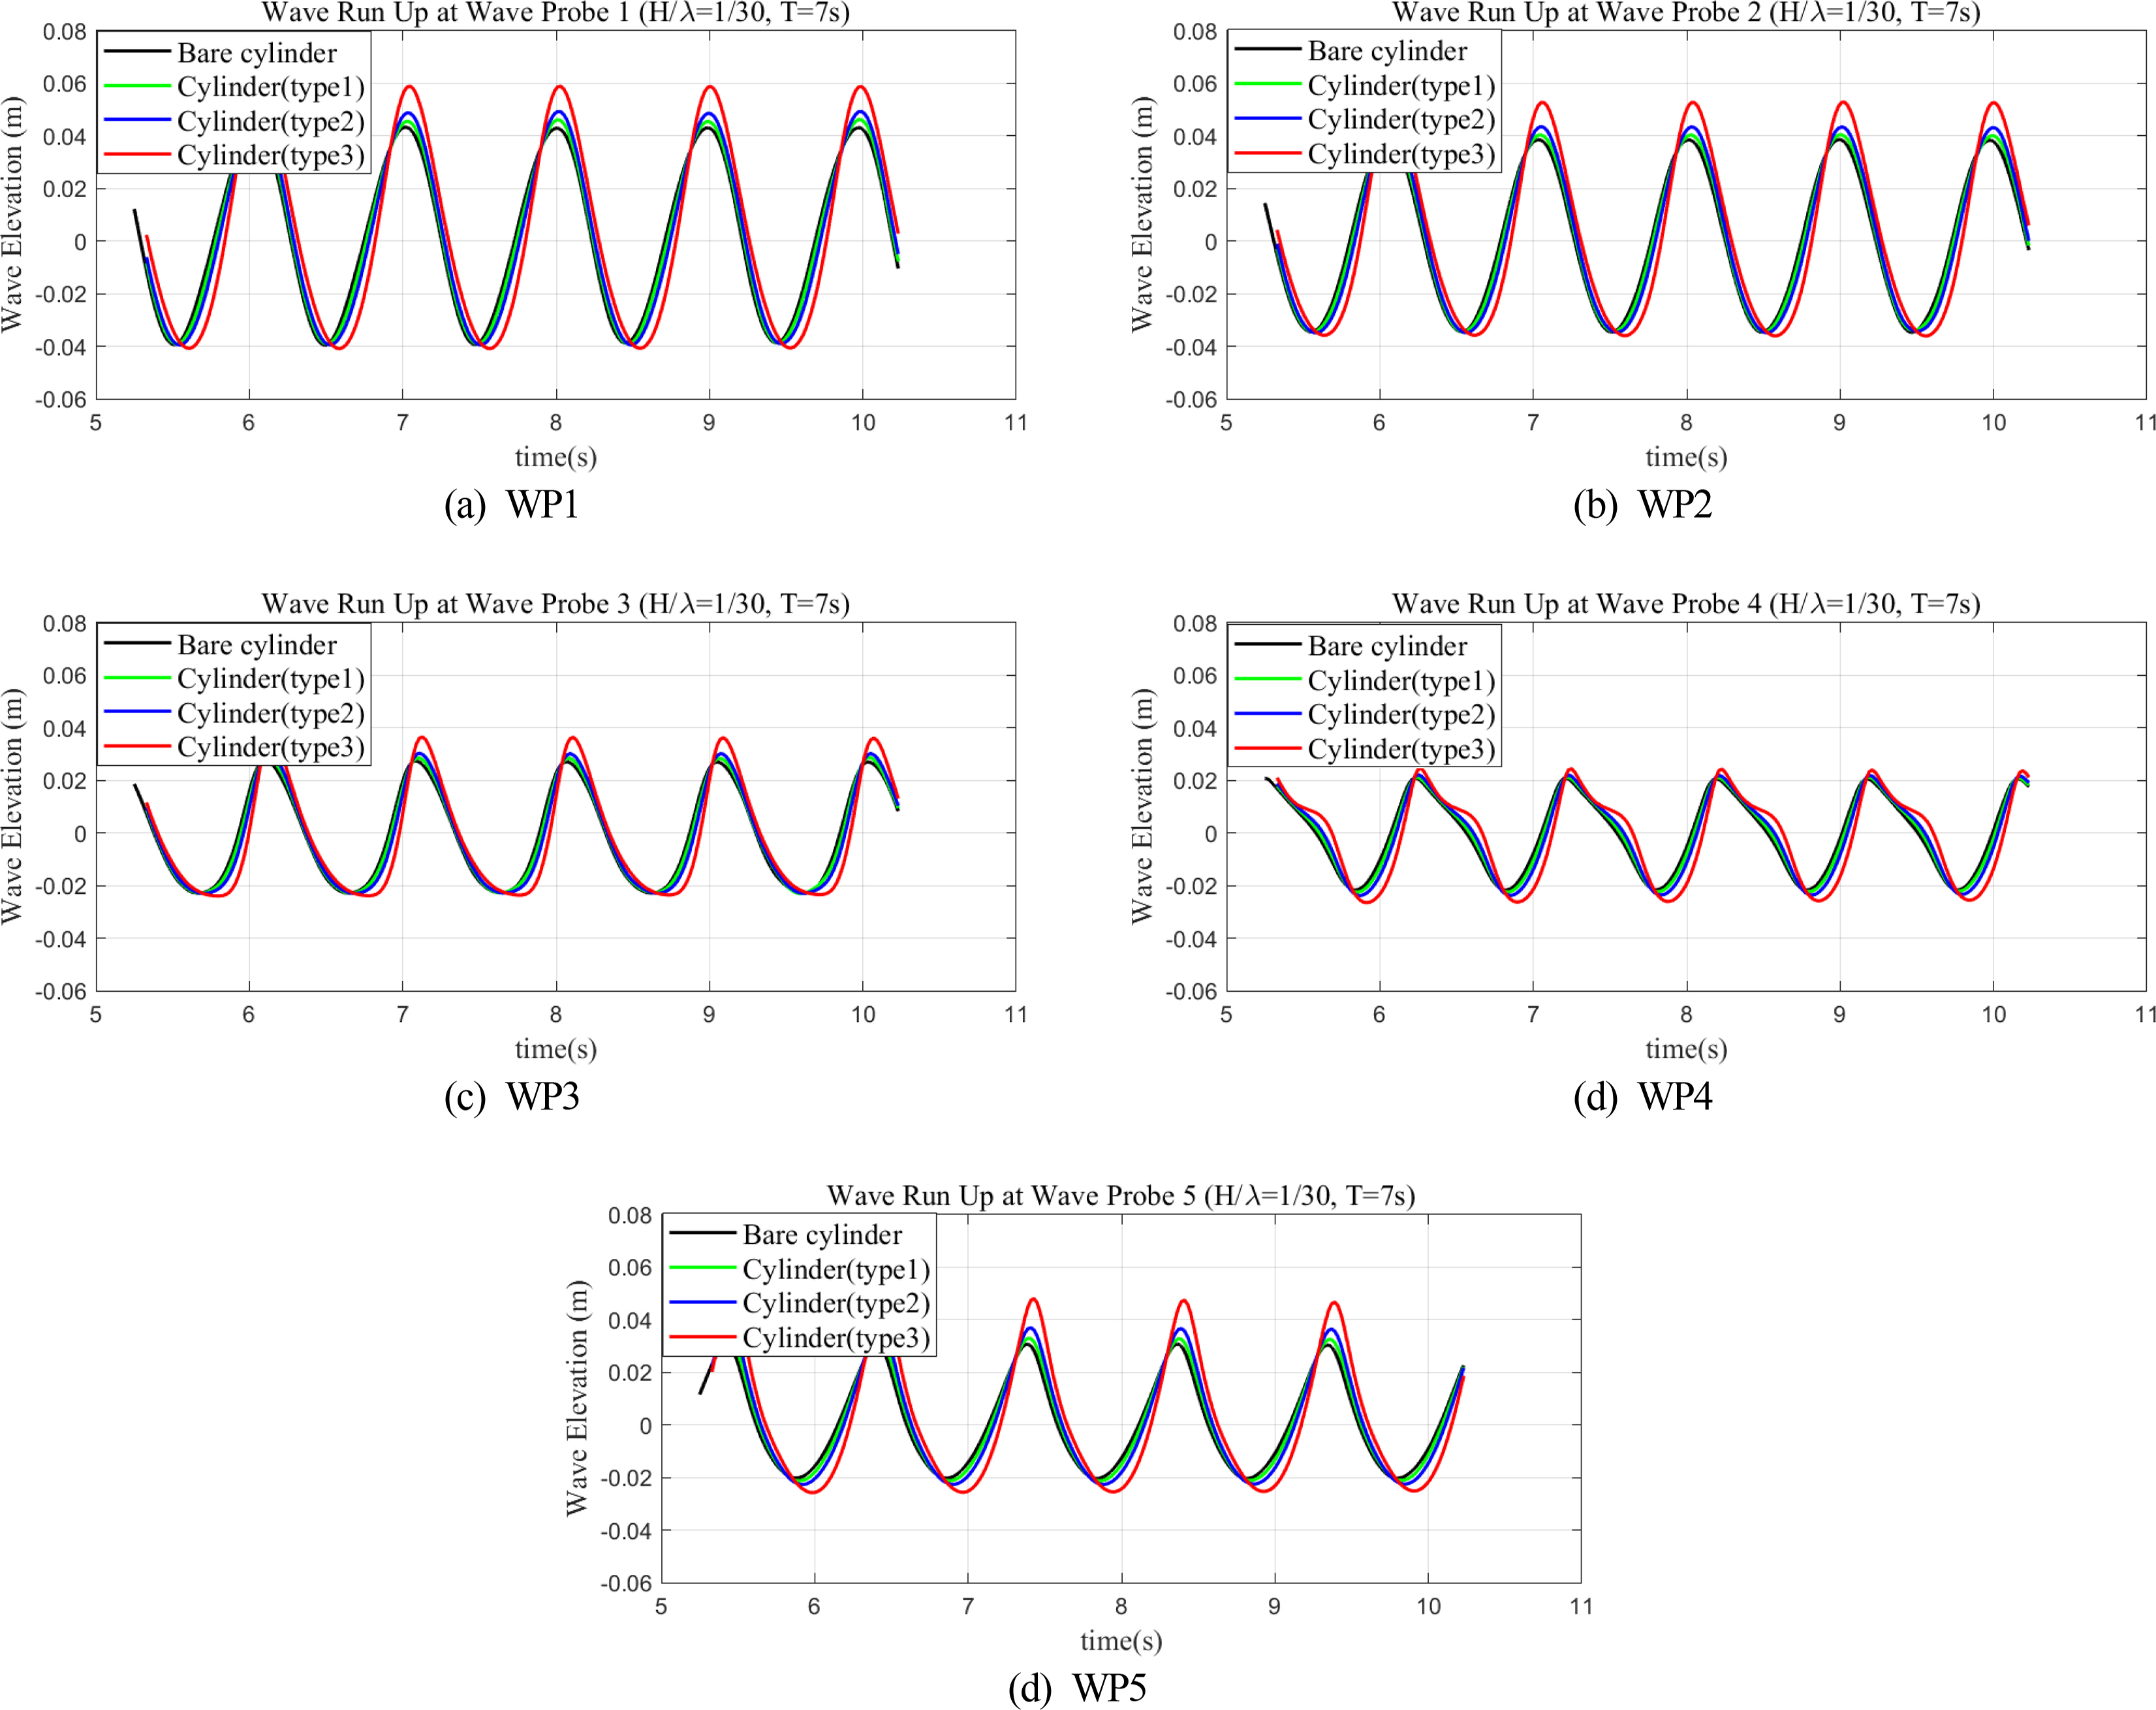
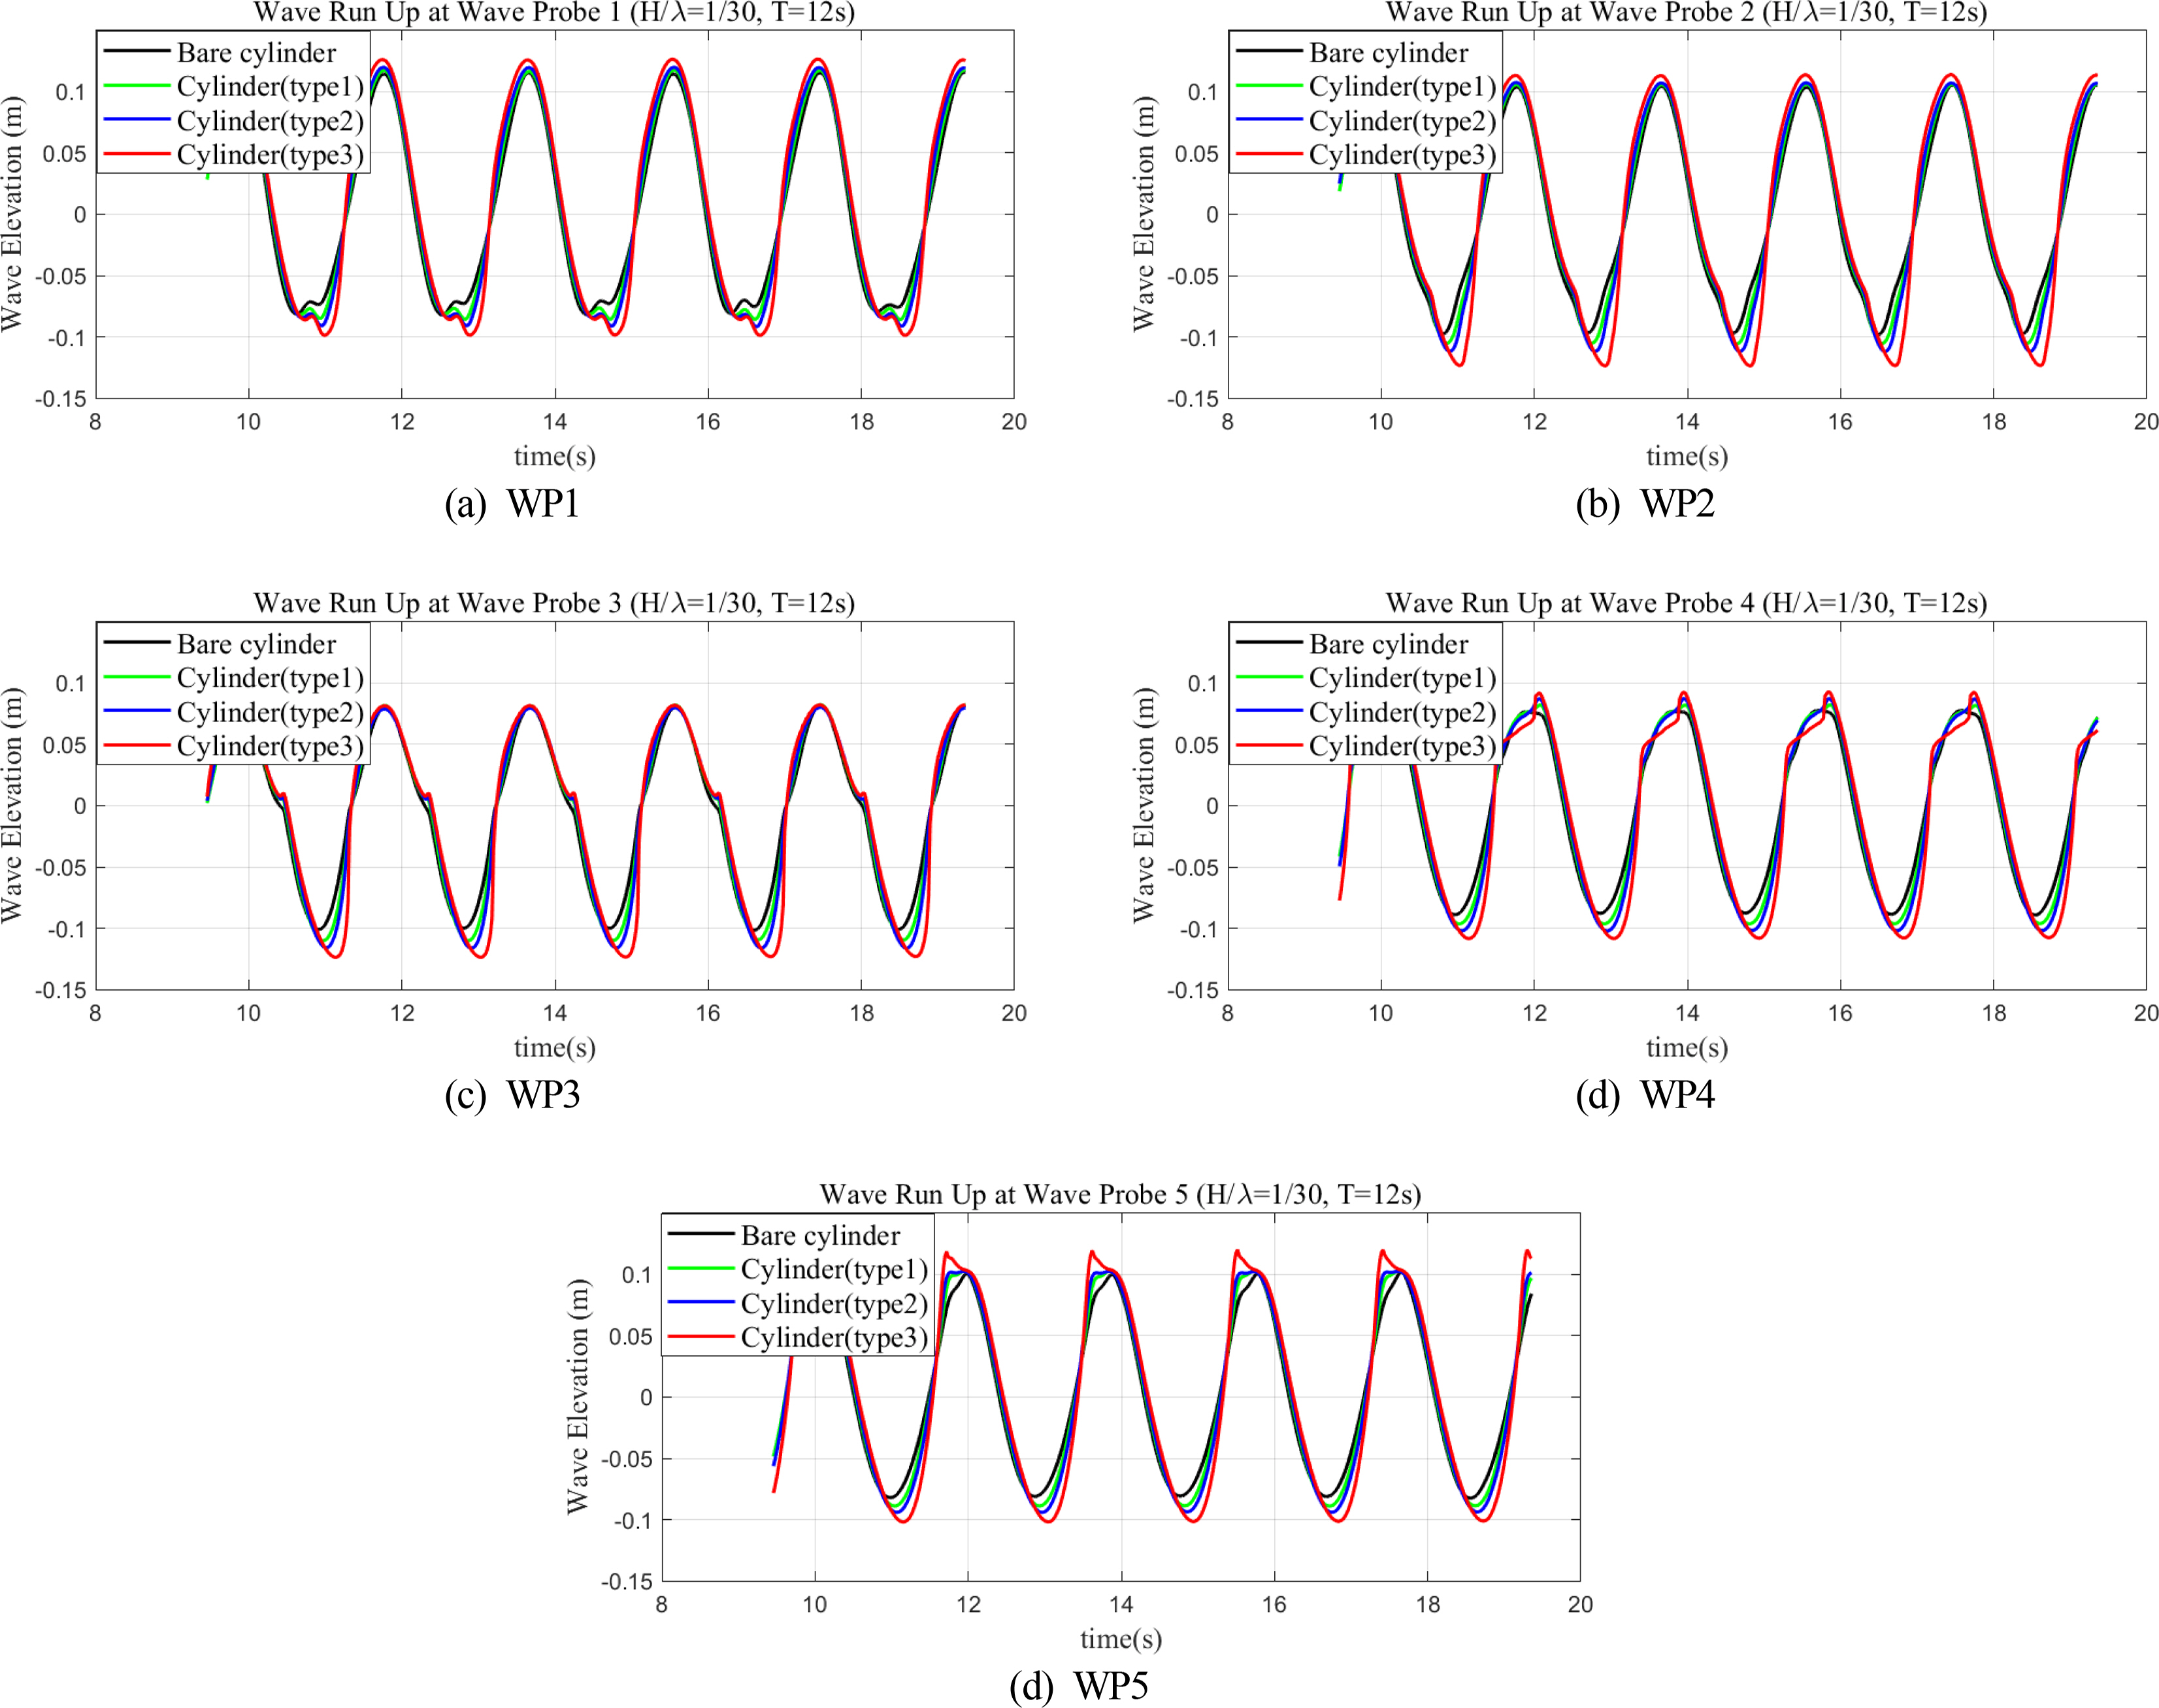
Fig. 10 (T =7 s, H/λ = 1/30) and Fig. 11 (T =12 s, H/λ =1/30) compare the wave run-up time series for four cylinders. Only the time histories of the last five wave periods are plotted in these figures. When the short incident waves (T =7 s) arrive, the wave run-up around the cylinders increase because of the presence of the damper (Fig. 10). In the case of the cylinders with dual dampers, the closer the upper damper is to the free surface, the stronger the scattering and amplification effects around the cylinder, leading to a higher run-up. Consequently, the wave elevations around the cylinder increased as the upper damper was raised upward. Regardless of the damper type, the amplification of wave elevation (WP1 and WP2) at the front face of the cylinder was greater than that of the side or rear of the cylinder (WP3, WP4, and WP5), which is also consistent with the trend observed in the bare cylinder. Therefore, the effect of the damper could be considered an enhancement of the original wave run-up characteristics for the bare cylinder. In particular, at the position of WP1, the kinetic energy of the incident wave was converted to a strong run-up because the front cylinder surface and the upper damper work together to prevent the horizontal propagation of the incident wave and change the flow vertically upward. In addition, as the upper damper rises, it can generate a strong vortex flow on the edge of the damper (Fig. 12), significantly altering the wave surface around the truncated cylinder. On the other hand, the effects of dampers on wave elevations around the cylinders were reduced when the wave period was 12 s (Fig. 11). This is because the diffraction effect becomes insignificant under the condition where the wavelength is much longer than the cylinder diameter. Interestingly, the higher position of the upper damper also causes higher wave crests and deeper wave troughs around the truncated cylinder (Figs. 10 and 11). The corresponding physical wave pattern could also be confirmed in Fig.13.
Comparison of the time history of wave run-up around the cylinder with various dampers (T =7 s, H/λ = 1/30)
Comparison of the time history of wave run-up around a cylinder with various dampers (T =12 s, H/λ =1/30)

Comparison of the velocity vector of the flow around the truncated cylinder (t/T = 2.14, T =7 s, H/λ = 1/30): (a) type 1 and (b) type 3
Spatial contours of the wave elevation around the bare truncated cylinder (T =7 s, H/λ = 1/30)
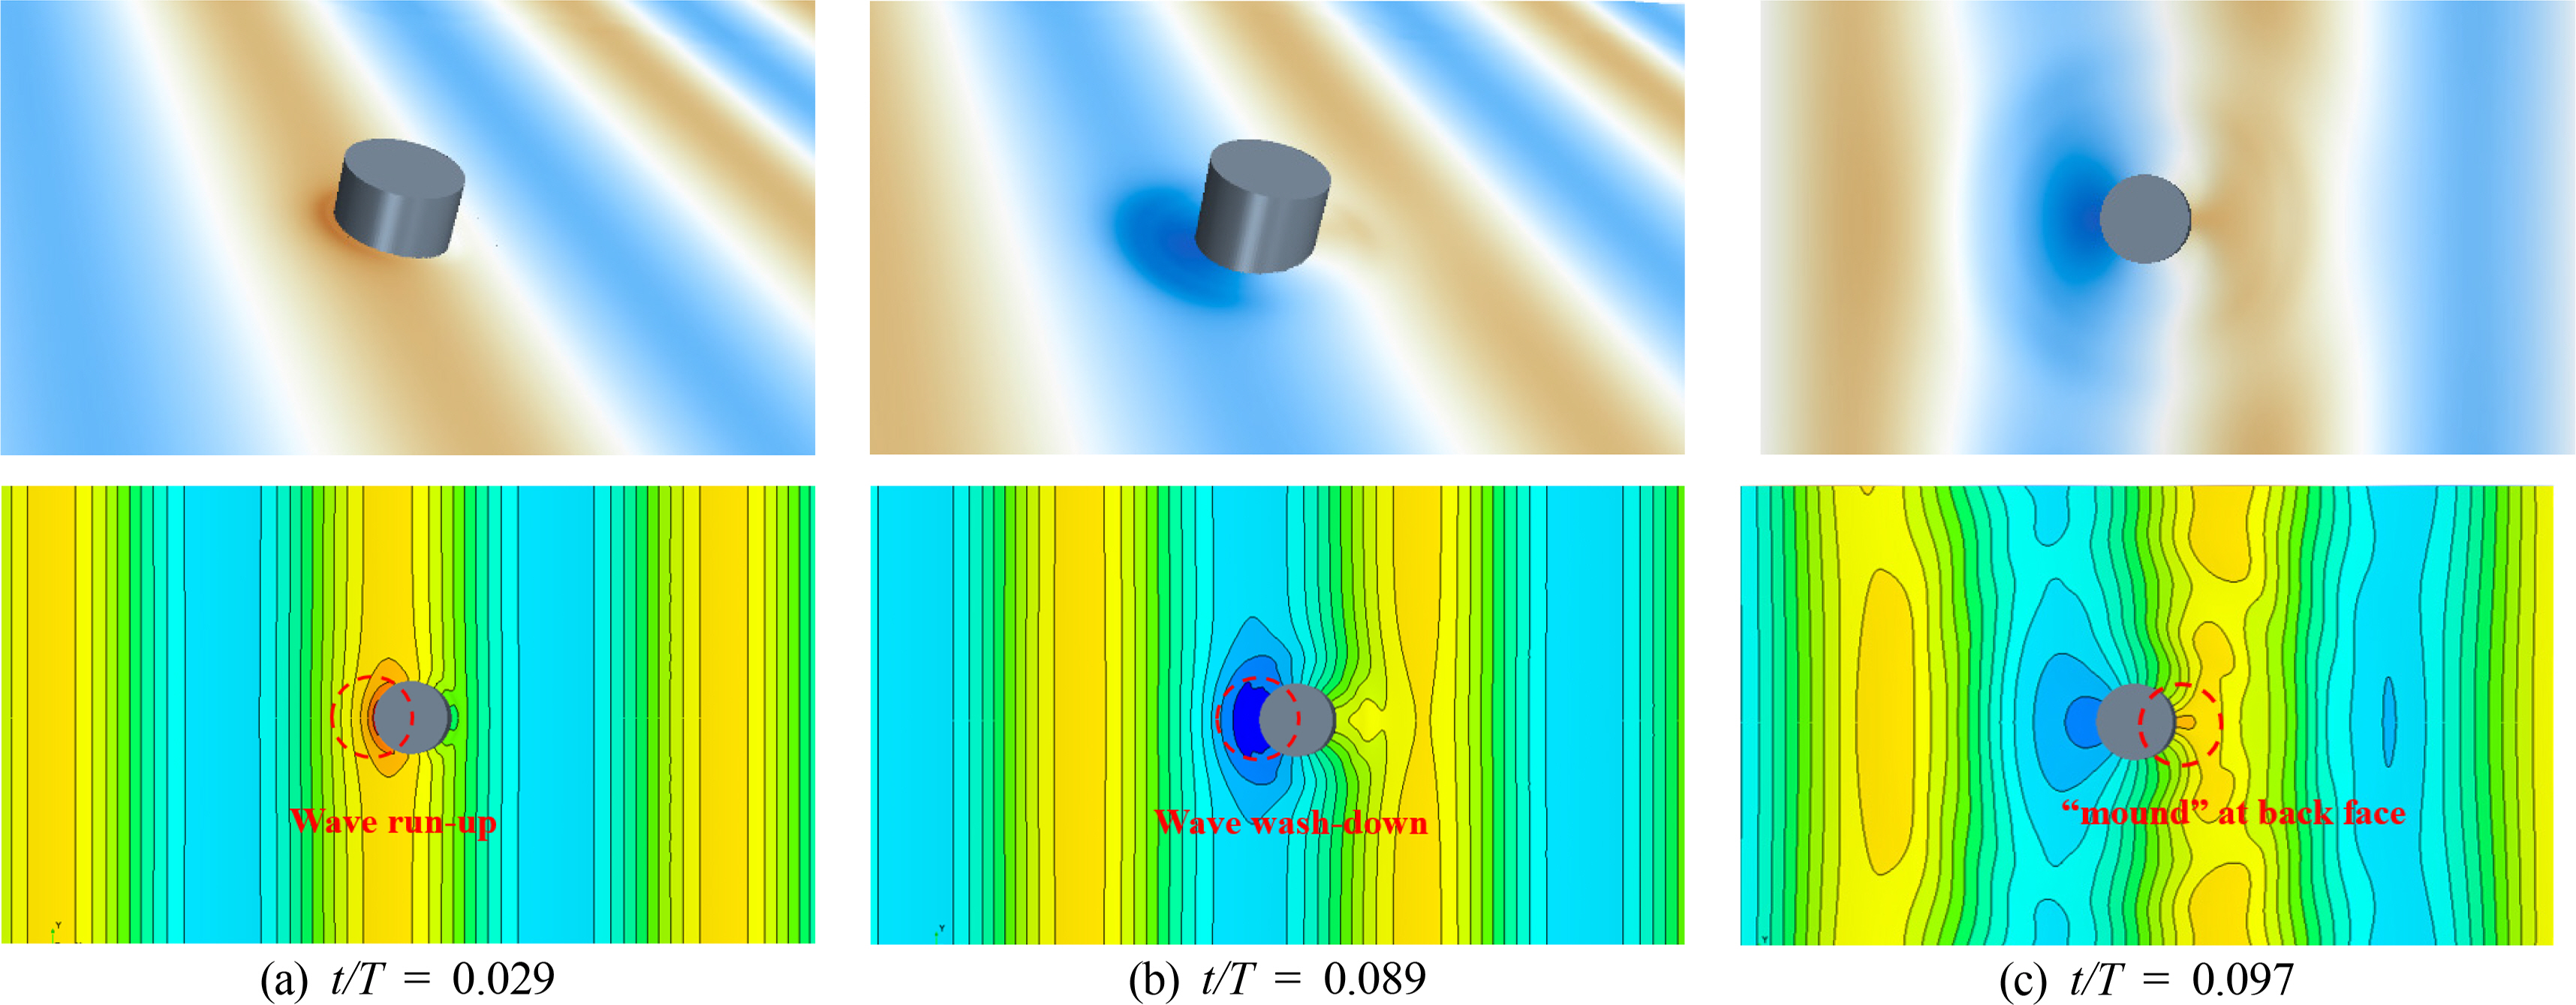
Fig. 13 shows the top contour views of the free surface elevation around the truncated cylinder under short incident waves. Here, the wave propagates from left to right. Significant run-up or wash-down occurs when the crest (Fig. 13(a)) or trough (Fig. 13(b)) of a propagating wave meets the front face of a truncated cylinder. Such a phenomenon was observed by Swan et al. (2005). When the incident waves surrounded the entire cylinder, two lateral edge waves were generated (separating at the front stagnation point) and moved towards the downstream direction. These two edge waves met at the back face of the cylinder, and a small “mound” of water occurred (Fig.13(c)). Such a “mound” is also well known as back run-up (Swan et al., 2005, Wang et al., 2021). In addition, in the case of the long wave conditions, the diffraction waves were less significant than the short wave conditions (Fig. 14). Interestingly, as the wave trough passed the front face of the cylinder, lateral edge waves occurred and began to propagate in the opposite direction along the cylinder surface towards the upstream face of the truncated cylinder.

Wave elevation around a bare truncated cylinder (t/T = 0.11, T =12 s, H/λ =1/30)
Wave pattern of the free surface elevation around a cylinder with various dampers (t/T = 1.029, T =7 s, H/λ =1/30)
4.2 First-Order Components of Wave Run-Up
The first-order harmonic component of wave run-up indicates the amplitude of wave elevation (η1) corresponding to the fundamental wave frequency (ω). Fig. 16 presents the first-order harmonic components of wave run-up around various cylinders with respect to various scattering parameters (ka). The present results obviously showed that a gradual increase in the first-order harmonic components occurred around the cylinder as the position of the upper damper moved closer to the free surface. Such an increment became even more significant under short-wave conditions (ka = 0.657).

Comparison for the first-order harmonic components of wave run-up around a cylinder with various scattering parameters
Furthermore, at each scattering parameter (ka), the amplification of first-order harmonic components became more significant as the upper damper moved upward. The dramatic increase in the crest of total wave run-up could be explained by the first-order harmonic component being the dominant component. Moreover, the first-order harmonic components of wave run-up on the weather side (WP1 & WP2) of the cylinder increased as the scattering parameter increased, following the original characteristics for the bare cylinder. Fig. 17 presents the distributions of first-order harmonic components at different wave probes. In the case of short wave conditions (Fig. 17(a)), there was a consistent decreasing tendency of the first-order harmonic components of wave run-up from the front point (WP1) to the back shoulder point (WP4) and then an increase again at the back point (WP5). In contrast, under long wave conditions, the variations of the first-order harmonic components of wave run-up at various probes became less significant (Fig. 17(b)).
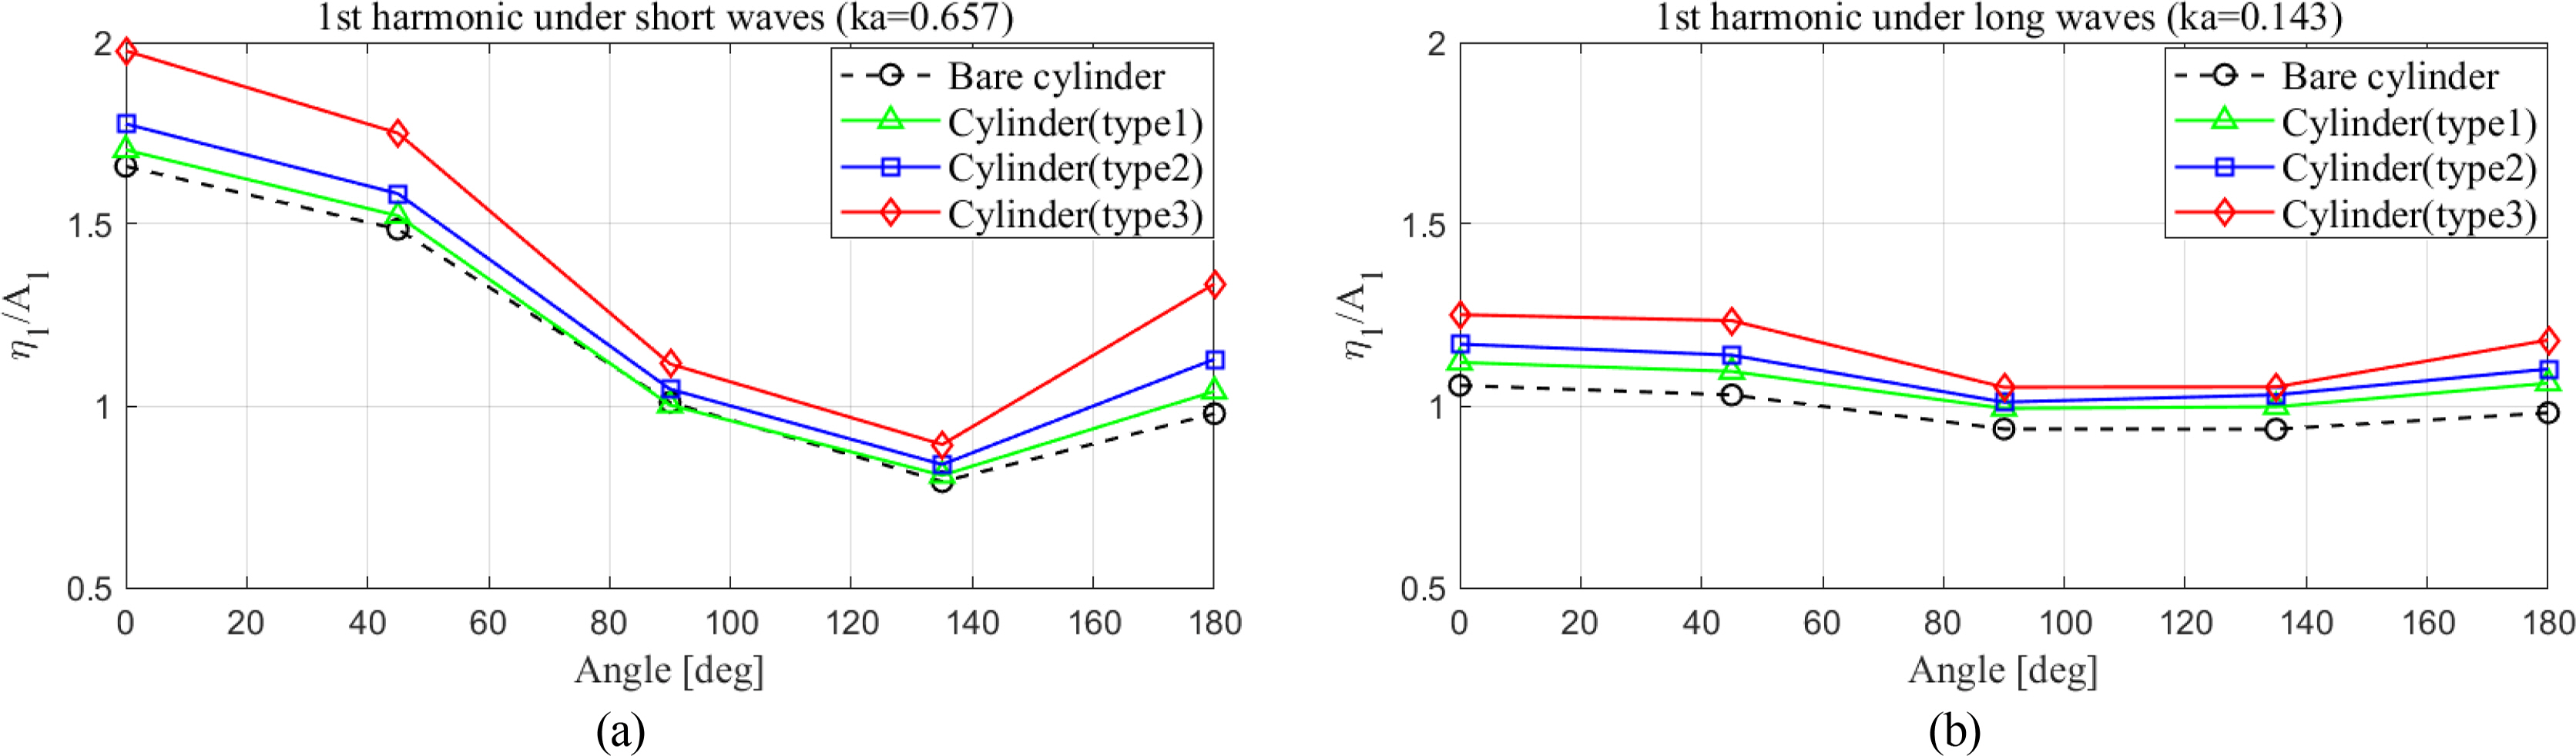
Comparison of the first-order harmonic components of wave run-up around cylinder w.r.t. various positions
4.3 Second-Order Components of Wave Run-Up
Figs. 18 and 19 show the second-order harmonic components and mean set-up/set-down of wave run-up around the cylinder with different dampers. Here, the second-order harmonic component of wave run-up around the cylinder indicates the amplitude of the wave component (η2) at the double wave frequency (2ω), corresponding to the second-order sum-frequency component of the free-surface elevation. Furthermore, the mean set-up/set-down of the free surface elevation could be considered the second-order difference frequency component.
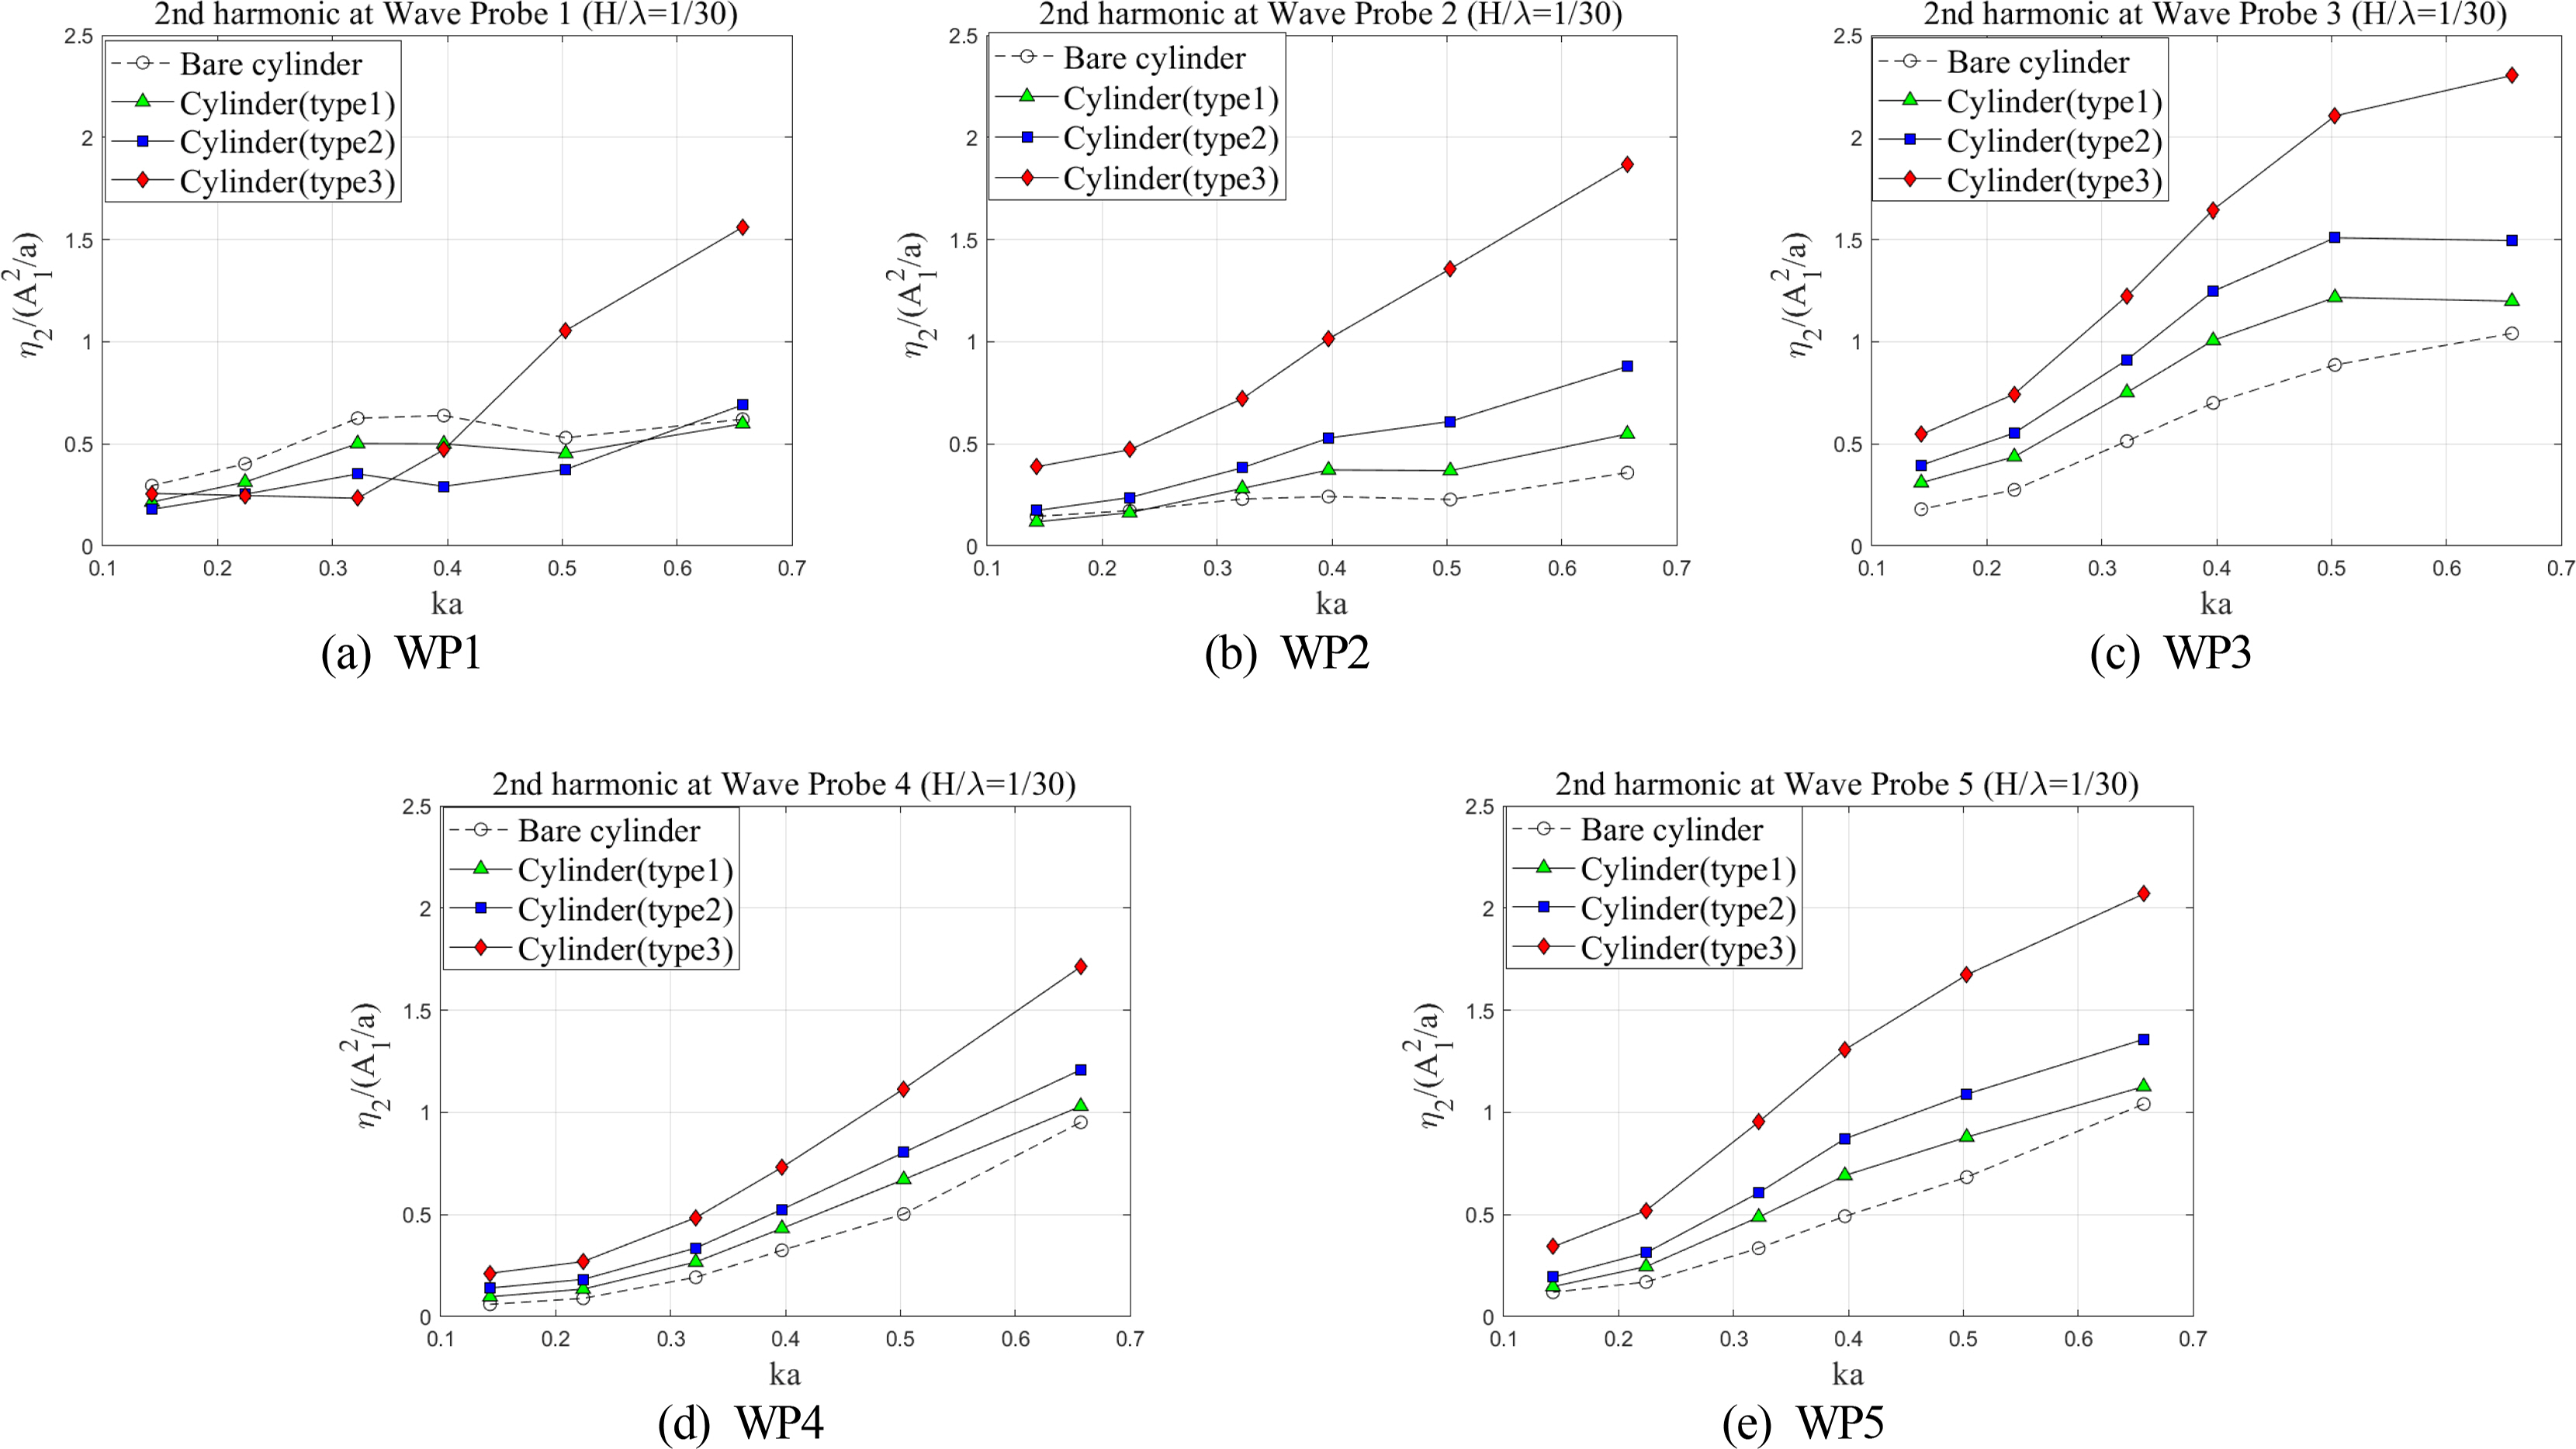
Comparison of the second-order harmonic components of wave run-up around a cylinder

Comparison of the mean set-up components of wave run-up around a cylinder
The overall second-order harmonic components of wave run-up around the cylinder increased as the scattering parameter increased, similar to the first-order harmonic components. On the other hand, the effects of the damper on the second-order harmonic components at the stagnation point (WP1) were not monotonous (Fig. 18(a)). Regarding the types 1 and 2 dampers, the behavior of the second-order harmonic components similarly follows that of a bare cylinder, whereas a rapid increase was found in the case of type 3, where the upper damper closely approaches the free surface. In addition, the increases in type 2 and type 3 dampers were more significant compared to those between the type 1 and type 2 dampers, as depicted in Fig. 18. Hence, the second-order harmonic components of wave run-up are also strongly affected by the position of the upper damper. Interestingly, the second-order harmonic components became significant on the lee side and rear locations (WP3∼WP5) of the cylinder.
The mean set-up/set-down component of the wave run-up indicates the average value of the time series of the free surface elevation. Fig.19 shows the variations in the mean set-up components of wave run-up around a cylinder with various dampers. Different tendencies were observed in the mean set-up components compared to the first-and second-order harmonic components of wave run-up. Here, the damping plate amplified the change in the mean free surface elevations around the truncated cylinder. For example, at WP1 (Fig.19(a)), the set-up of the mean wave elevation was observed, particularly under shot wave conditions (i.e., high scattering parameter), and the attachment of the damper caused an increase in set-up values. On the other hand, the set-down of the mean wave elevation was observed at WP3 and WP4(Figs. 19(c) and 19(d)). The decrease in the mean wave elevation became more significant because of the damper attachments. Such a phenomenon could also be observed in the time history of the wave elevations (Figs. 10(d) and 11(d)). The wave wash-down was more noticeable than the run-up at the back shoulder point (WP4) of the cylinder. In general, in the case of short-wave conditions, variations of mean set up/down became more significant because of the presence of a damper. Nevertheless, the magnitude of the mean set up/down is smaller than the second-order harmonic components of wave run-up commonly, as also discussed by Mohseni et al. (2018).
5. Conclusion
This study examined the effect of the heave damping plates on wave run-up characteristics around a truncated circular cylinder. The numerical validation was performed by comparing the wave run-up components around a bare truncated cylinder between the present numerical results and the model test data from Nam et al. (2008). A truncated cylinder with three different types of dampers was introduced for the CFD simulations. The closer the upper damper is to the free surface, the stronger the scattering and amplification effects, leading to higher wave crests and deeper wave troughs around the truncated cylinder. Regarding the nonlinearities of the wave run-ups, the amplification of the first- and second-order harmonic components became more significant as the upper damper moves upward. In particular, regarding the mean set-up, the damping plate amplifies the original change in the mean free surface elevations around the truncated cylinder instead of showing a monotonous increment. Based on the present work, future research will focus on the optimal arrangement of the damping plates and the wave forces acting on the cylinder under different wave conditions.
Notes
Bo Woo Nam serves as a journal publication committee member of the Journal of Ocean Engineering and Technology, but he had no role in the decision to publish this article. No potential conflict of interest relevant to this article was reported.
This work was supported by the “Development of Design Technology for TLP-type Floating Offshore Wind Turbine System and Scaled Model Test Technique” of the New & Renewable Energy of the Korea Institute of Energy Technology Evaluation and Planning (KETEP) grant funded by the Ministry of Trade, Industry and Energy (MOTIE) (No. 20223030020130). This research was also supported by the Korea Agency for Infrastructure Technology Advancement (KAIA) grant funded by the Ministry of Land, Infrastructure and Transport (Grant RS-2023-00250727) through the Korea Floating Infrastructure Research Center at Seoul National University.