1. Introduction
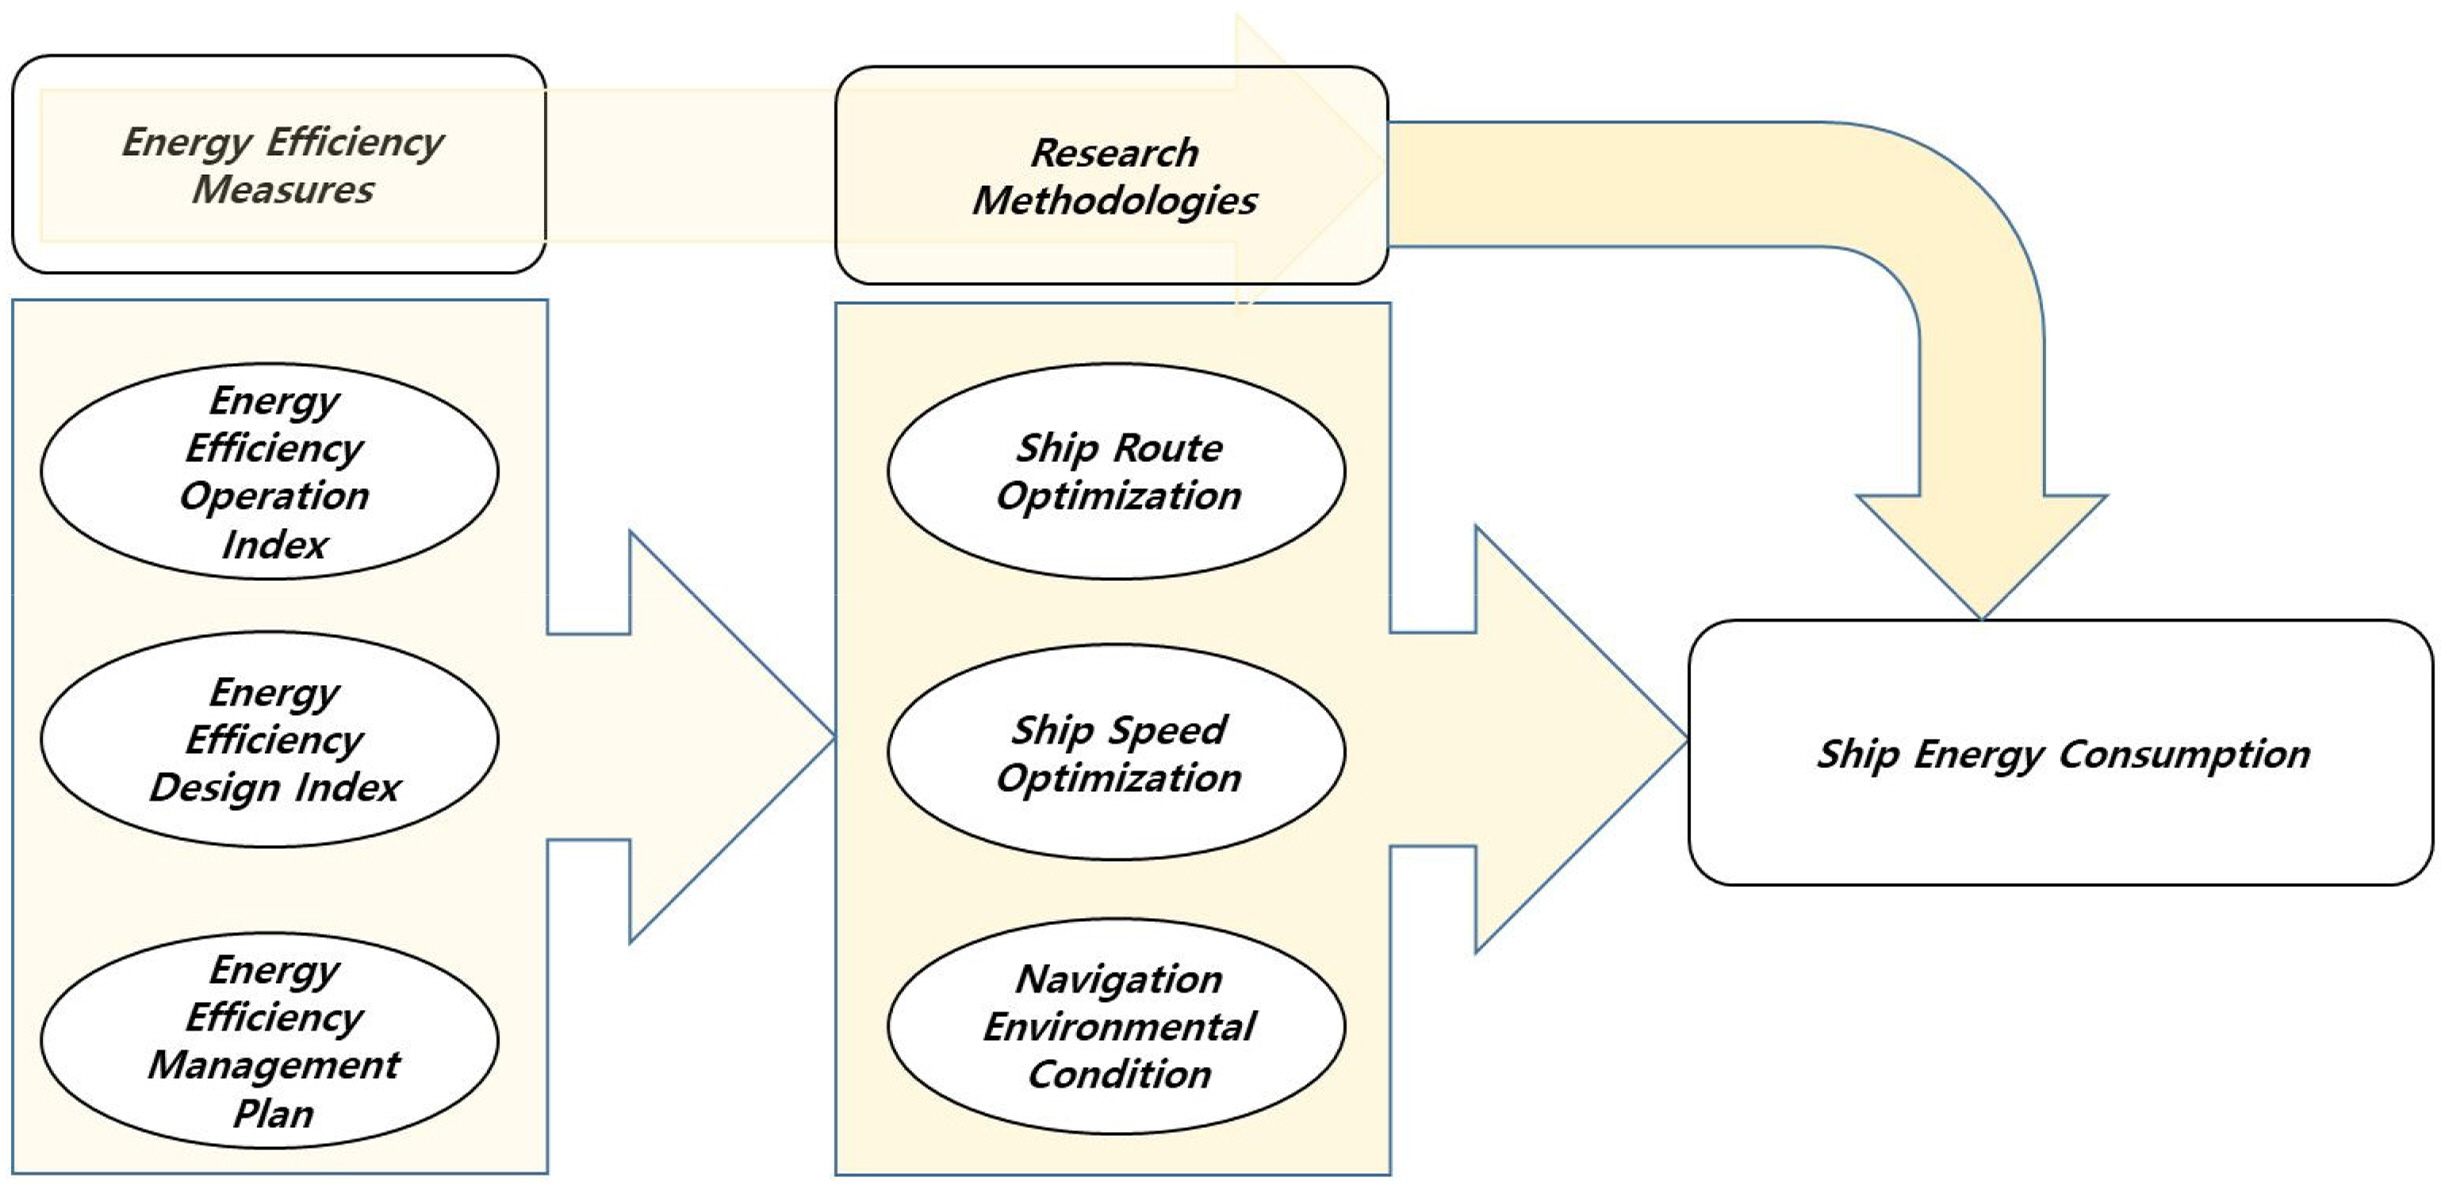
Reducing fuel consumption and exhaust-gas emission from ships is a critical issue to comply with the stringent regulations of the International Maritime Organization (IMO) nowadays. The global maritime transportation industry is developing and is showing that it is an important environment for increasing the income of each nation in the world. Based on the United Nationals Conference on Trade and Development (UNCTAD, 2017), shipping transportation has been seaborne during the last four decades. But greenhouse gas emissions are a problem that many countries seek to solve. Significantly, the IMO (2009) gave a forecast of increased carbon dioxide (CO2) emissions by 50% to 250% by 2050. General studies on measures taken have investigated the main topics that are directly related to the energy consumption of ships, as shown in Fig. 1.
The same challenges hen investigating a ship’s energy efficiency management and navigation condition are investigated when considering the fuel consumption of marine diesel engines. A prediction model of fuel consumption for inland river ships was established with Long-Short-Term–Memory (LSTM) in China (Yuan et al., 2021). Tran (2021) investigated the uncertain parameters of navigation conditions based on a hybrid multi-criteria decision-making system. Işikli et al. (2020) estimated the fuel consumption in maritime transportation through the response surface methodology when considering the navigation condition. Tillig et al. (2020) reduced the negative factors from environmental conditions to reduce fuel consumption with wind-assisted propulsion vessels.
The marine fouling phenomenon degrades the ship hull condition during the operation process. Therefore, more needless fuel-oil consumption by marine diesel engines is needed to maintain the voyage speed and the cargo handling plan. This is the reason why there are many different studies to try to calculate and predict the total resistance and the added resistance due to changing the ship hull condition and the marine surface propeller. A full-scale model of a ship was designed to predict the antifouling coating of the ship hull through the roughness and fouling conditions (Schultz, 2007). Then, the ship’s owner could have a large amount of control over the energy efficiency, which was investigated with the ship hull condition and biofouling during the ship operation process. Marine biofouling is a critical issue related to increasing ship resistance, leading to more fuel consumption. Moreover, it is the main factor that causes increasing amounts of greenhouse gas emissions and harmful non-indigenous species (Demirel et al., 2017).
Estimations of the external environmental condition of a ship could be determined accurately through a numerical simulation method like computational fluid dynamics (CFD) or finite element analysis (FEA). However, these methods are determined and calculated based on only theoretical equations established from experimental work and a designed ship model from a towing tank in a laboratory of universities or/research institutes. Therefore, the accuracy of the collected results is not high compared with the actual sea condition. Additionally, the ship model is entirely built in calm water conditions. This differentiates the initial model from the computation and simulation results in a hydrodynamic environment. This drawback was indicated and confirmed by Kuroda et al. (2017) when calculating a ship’s total resistance and added resistance in wave sea conditions and irregular wave height from the actual sea during an operational process. In this study, the prediction of ship-hull and marine propeller conditions was investigated through artificial intelligence (AI) based on deep learning techniques. The collected results are presented and indicate more advantage in predicting uncertain factors like the ship hull condition and marine propeller’s impact on the fuel consumption of ships.
2. Literature Review
The fuel consumption of a ship’s main diesel engine is a critical issue in maritime transportation nowadays. There are many uncertain factors that influence a ship’s fuel consumption during voyage time. There are some recent research results that have addressed some external factors surrounding ships that impact the fuel oil consumption as well as the ship performance. Bialystocki and Konovessis (2016) estimated the fuel oil consumption through a speed curve, ship draft and displacement, weather force and direction, and hull and propeller roughness. However, this research did not investigate the ship hull condition and propeller roughness clearly from the initial condition of the ship.
Moreover, various studies have given monitoring methods for ship fuel consumption through a cyber-physical system (CPS) (Shi et al., 2020). The real-time modelling of ship fuel consumption was established through the relationship between the fuel consumption and effective power of the main diesel engine versus the ship speed (Yin et al., 2017). Moreover, a statistical method to monitor the fuel consumption of the main diesel engine has been investigated (Bocchetti et al., 2015). In particular, fuel oil consumption monitoring is important to improve the energy efficiency of the ship operation process (Trodden et al., 2015). Therefore, ship energy-efficiency management was reviewed to decrease exhaust gas emissions in maritime transportation (Jimenez et al., 2022). The transpacific crossing technique was studied to monitor the real-time energy consumption of container vessels to reduce greenhouse gas emissions (Yeh et al., 2022; Doulgeris et al., 2020).
Adland et al. (2018) studied the effect of periodic ship hull conditions on fuel oil consumption for tanker vessels. Moreover, the ship hull condition and marine propeller were the investigated factors in selecting a ship docking period by Koboević et al. (2019). The initial studies have given some fundamental knowledge on the ship hull condition and marine propeller’s influence on the ship fuel consumption. The interaction between the ship hull condition, marine propeller, and diesel engines in regular waves was studied by simulating and verifying it through experimental work (Ghaemi and Zeraatgar, 2021). However, both factors have still not been investigated and researched in monitoring ship fuel-oil consumption and naval architecture.
The above studies also indicated clearly that the influences of the external surface of the ship decide the fuel consumption of marine diesel engines. However, the studies have not investigated the ship hull condition, marine propeller, navigation environment condition, and ship loading condition. The previous studies have only approached calm water conditions. In reality, calm water and the experimental conditions in the laboratory differ from the actual navigation conditions of ships. To overcome the existing issues above, this research was conducted to address two factors that influence the ship fuel consumption during the ship operation process. The collected results were evaluated and verified with the collected parameters from a specific ocean-going vessel of a shipping transportation company in Vietnam.
3. Proposed Methodologies
Several researchers have presented the usage of numerical computing, a test model, or simplified CFD. However, there are still challenges in predicting the hydrodynamic parameters of a ship, such as the added resistance, ship performance, ship hull condition, marine propeller fouling, and many others in a natural ocean environment (Shigunov et al. 2018). Therefore, the data-driven prediction model paid attention to recent times through its collected results with high accuracy compared with the actual condition in the operational environment of a ship.
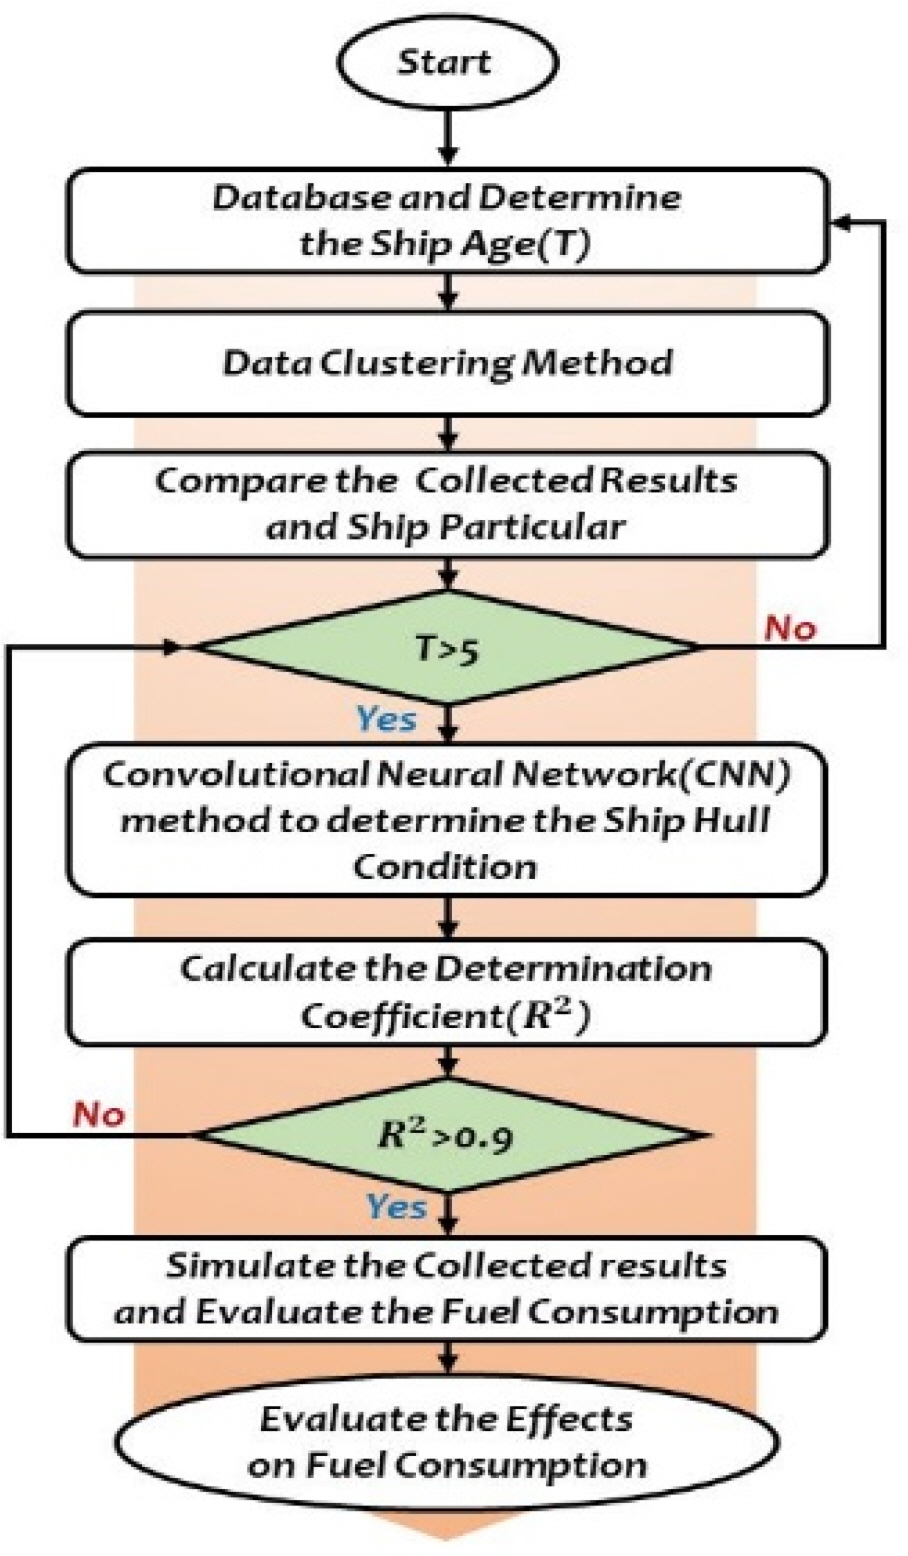
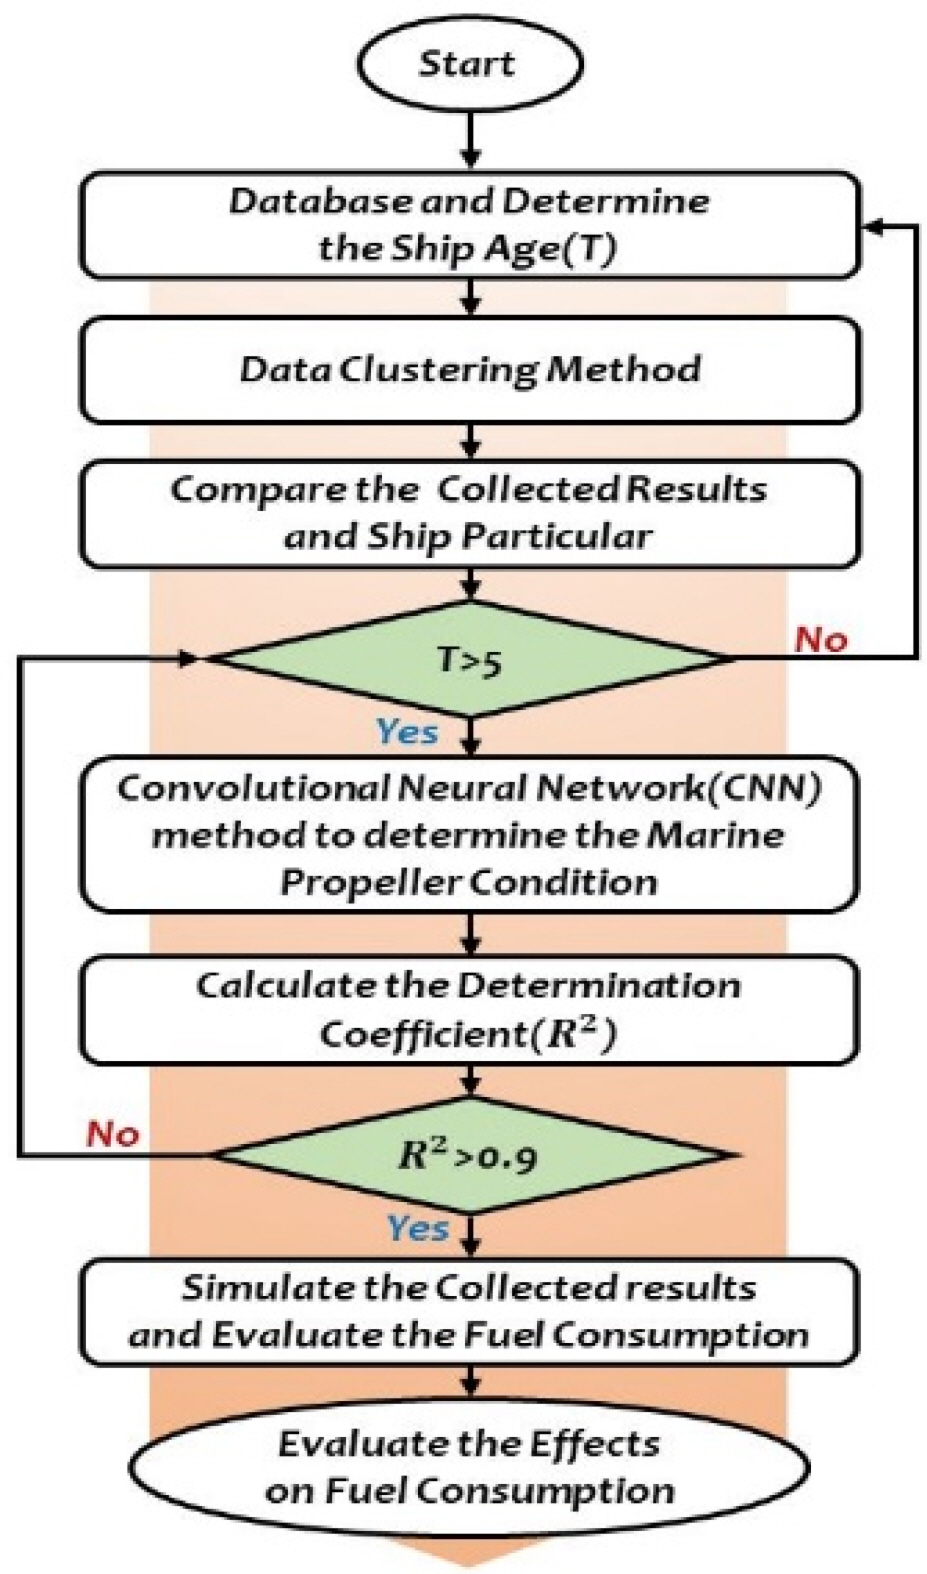
In the framework of this research (Fig. 2), the steps of this study were investigated by collecting a database of typical vessels. Then, a predictive model was built based on the specific database. The validation of the proposed model was analyzed through experimental work on a certain vessel. Two cases were investigated in this research based on a convolution neural network (CNN) model. The proposed algorithms determine the ship hull (Fig. 3) and marine propeller conditions (Fig. 4) based on the collected database and ship age (T) during the ship operation process. The performance of the CNN model is presented by determining the coefficient R2. If this coefficient is more than 0.9, the proposed model can be finalized through the algorithms in Figs. 3–4. The time of ship use influences the quality of the ship’s surface along with the temperature of the external navigation environment and sea water temperature. These parameters affect the external surface roughness of the ship.
3.1 Convolutional Neural Network (CNN)
A CNN is a type of deep learning neural network that works excellently for pattern recognition. It is analogous to an artificial neural network (ANN), which comprises neurons in a self-optimization platform and updates the weights of the neurons based on the back propagation (BP) algorithm. The advantageous feature of CNN is that it is able to extract the regional features and develop the private benefit through dealing with complicated tasks. Additionally, it has a high accuracy level in image recognition. But a traditional ANN cannot solve the complicated characteristics of different databases. This has explained that the complicated features and the non-linear relationship of inputs make the challenges of traditional ANN models. However, a CNN model could address the abovementioned weak points of a traditional ANN.
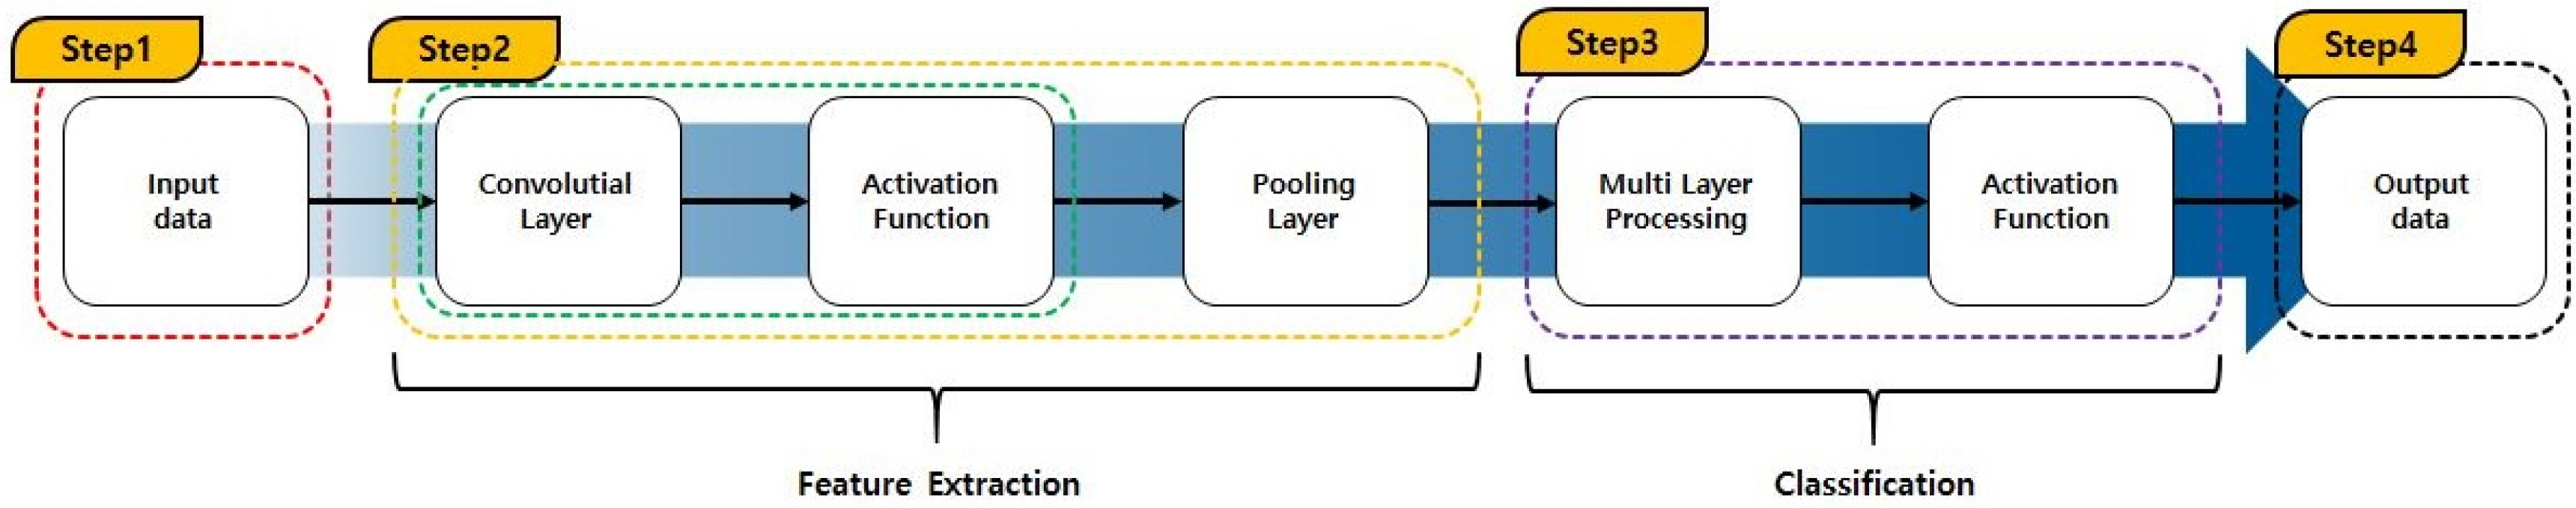
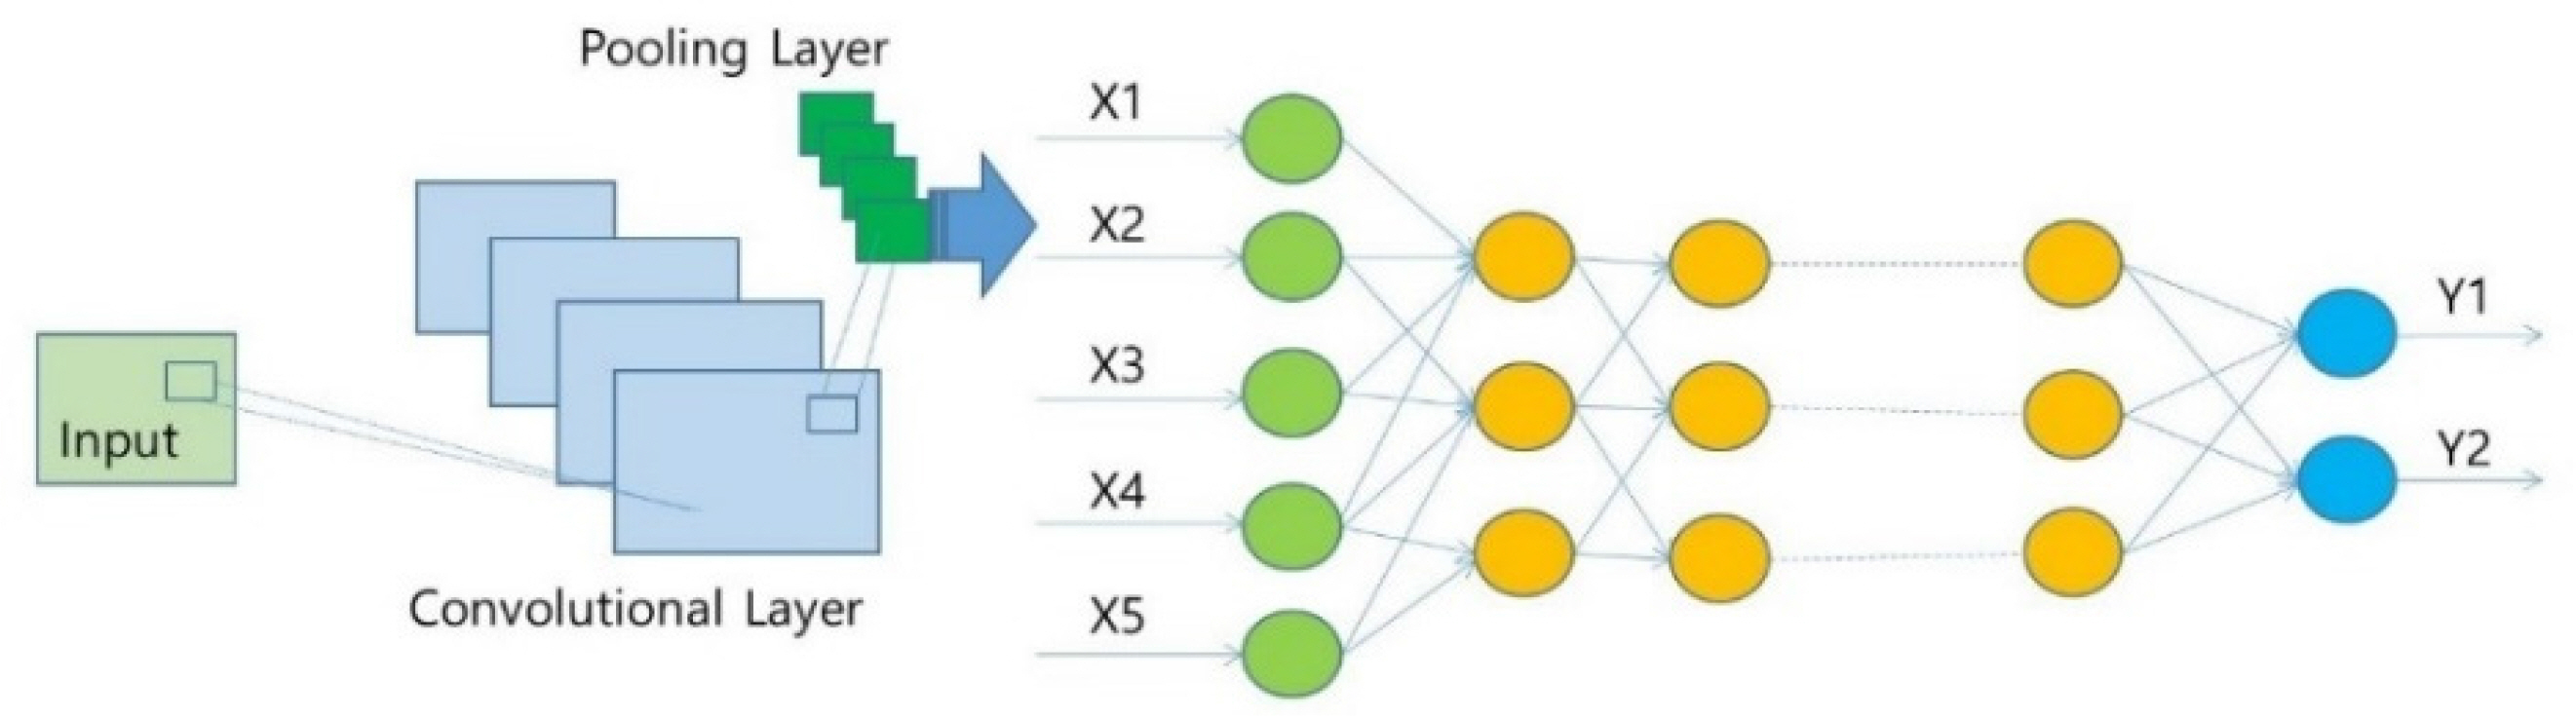
The CNN architecture depicted in Fig. 5 comprises feature extraction and classification stages. Initially, the convolutional layer recognizes features from a database. The output layer is then derived using activation functions, introducing non-linearity into the feature learning module. This process is iterated M times before transitioning to the pooling layer, effectively reducing dimensionality in the CNN model and cutting computation costs. A “convolution-act-pool” sequence is executed N times, and ultimately, the output layer connects to a dense multilayer perceptron with K layers.
The mean square error (MSE) at each point is defined in Eq. (1):
where yi is the actual dimensional value, ŷi is the predicted value at each point, and n is the number of datasets for the training process. The root mean square error (RMSE) is defined in Eq. (2) as follows:
The coefficient of determination (R2) is defined in Eq. (3) below.
3.2 Fuzzy Clustering Method
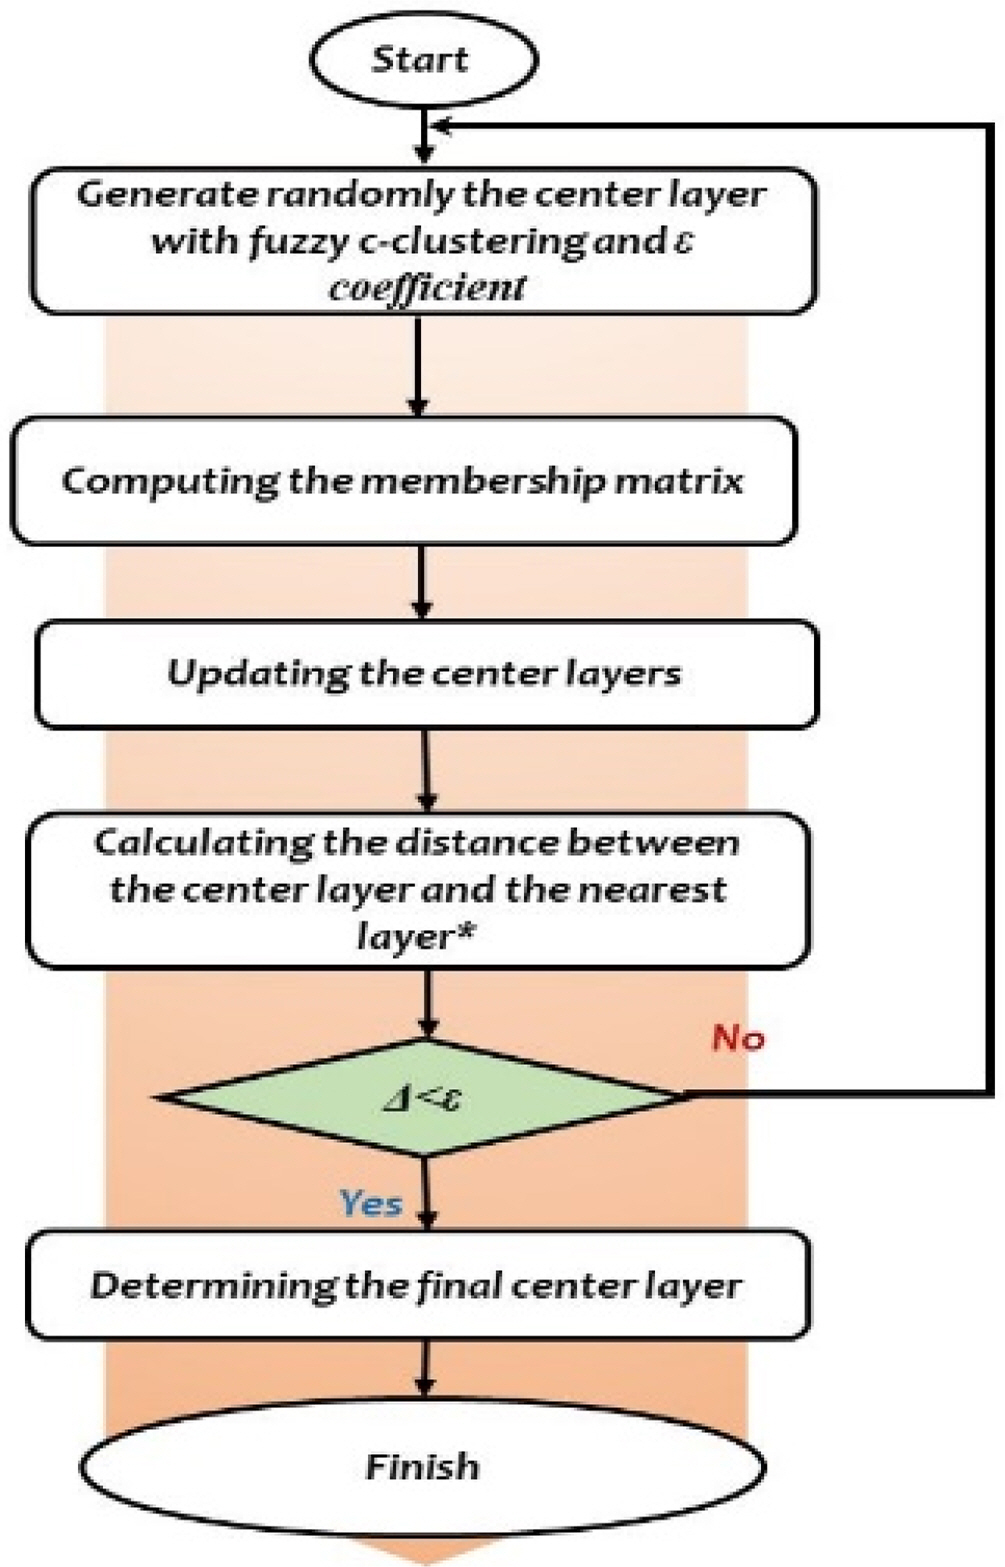
The fuzzy clustering method is useful for classifying a database during data processing in machine learning (Zadeh, 1965). This method divides the raw database into different clusters based on the same characteristics in the same group. In this research, a cluster was employed the same as the layers to support the predicted model through the proposed methodologies. Therefore, the object of the study was calculated through the fuzzy clustering algorithm to determine the minimum distance between the center layer and the nearest layer (Fig. 6).
The fuzzy clustering method has two processes, as illustrated in Fig. 6: calculating and determining the center cluster (layer) and the assignment of points of other clusters (layers) determined through the Euclidian distance (Δ) between the center cluster and a layer. In Fig. 6, the loop of determining the nearest distance between the center cluster is presented between the center clusters, and its iteration converges.
Additionally, the membership function is a specific coefficient in fuzzy set theory, with which the fuzzy clustering method was used and developed. The specific values of the membership function are in a range of [0, 1]. The definition of the fuzzification parameter (m) is employed to determine the range of value [1, n] in the fuzzy clustering algorithm. Determination of the fuzziness degree was conducted at each cluster (layer). The equation of the membership function is presented in Eq. (4) below.
An explanation of each specific parameter in Eq. (4) is provided as follows: μj(xi) stands for the membership (xi) belonging to the jth cluster; dji stands for the distance of xi belonging to the cluster cj; m stands for the fuzzification of the fuzzy clustering algorithm; p stands for the specific cluster number of the fuzzy clustering algorithm; and dki stands for the distance xi belonging to the cluster ck. The new center cluster (layer) is computed according to Eq. (5) with the same membership function:
where cj stands for the centre at the jth cluster; xi stands for the ith point of the cluster; μj stands for the membership function; and m stands for the fuzzification value. In this research, the algorithm programming of the fuzzy clustering method was done through the MATLAB platform. The following parts present the collected results of the quantitative values combined with classified clusters (layers).
4. Case Study: Bulk Carrier
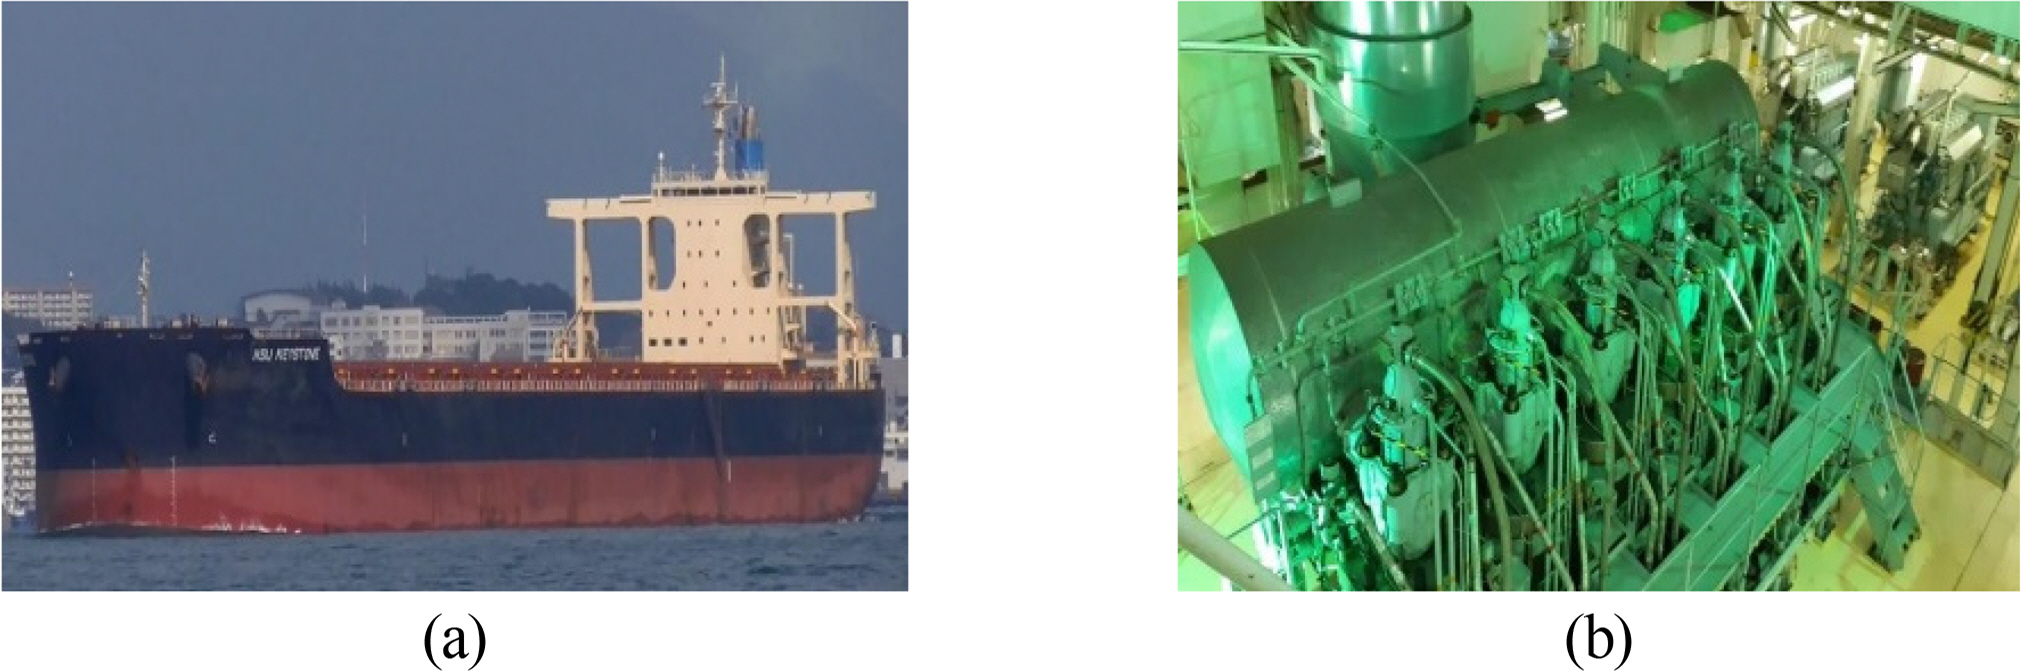
To verify the collected results, a specific ship was used in this research. A certain large-size bulk carrier was selected to evaluate and validate the proposed methodologies. This ship is a specific type of ship that is being operated widely in the world nowadays under management of the ship owner from a Japanese shipping transportation company. The specific parameters of this bulk carrier are presented in Table 1. Currently, this kind of ship is operating in international ocean areas. Moreover, the bulk carrier selected in this study is a typical modern vessel used in a shipping transportation company in Vietnam. The overall vessel and the main diesel engine are provided in Fig. 7.
In the main propulsion plant system of this vessel, the power plant is supplied sufficiently with indicators and monitoring devices at the main switch board for the main engine and diesel generator onboard the vessel. The collected operation parameters, including the fuel oil consumption and the navigation environment conditions [wind speed (m/s) and wave height (m)] were recorded and indicated. To study energy efficiency management, the onboard data acquisition system is very important to collect the operational parameters used in this research. The operation processing database was recorded at a certain voyage number that the ship master and the vessel’s chief engineer have managed. The voyage data recorder (VDR) collects this data. Moreover, a flow meter monitors the system energy consumption during the operation. This flow meter is equipped with both a suction and the discharging pipe system for the fuel-supplying pump in the vessel’s engine room. They monitor and present the fuel consumption level of the main engine during the ship operation process. The navigation environment condition is an essential factor influencing the ship’s fuel consumption during the operation, so the wind speed (m/s) and the wave height (m) were recorded by devices in the boong department of the ship. The collected parameters are presented in the following parts.
5. Results and Discussion
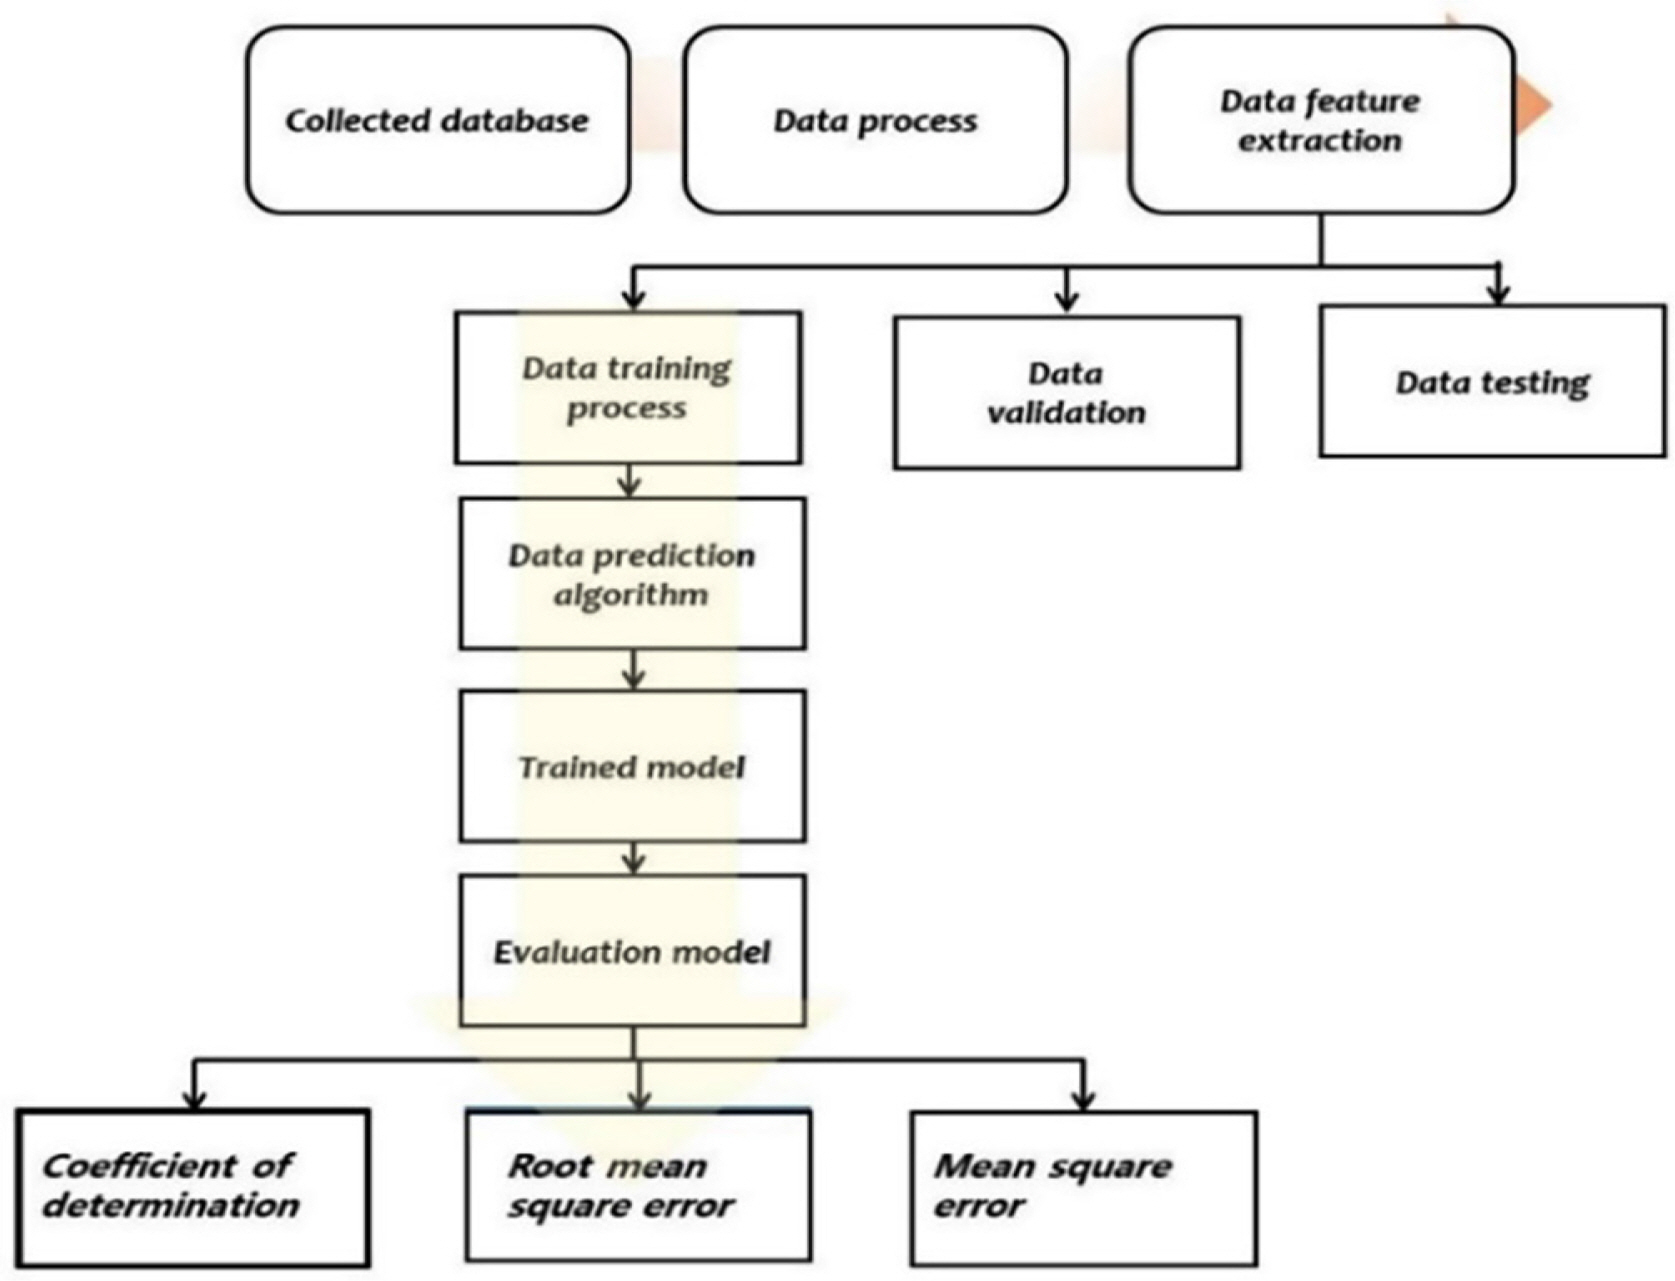
The ship’s energy efficiency system is the main topic in this research investigating an operational database and energy consumption model based on data processing and ocean engineering. A deep learning technique was studied and applied in this study. The raw database was treated and refined through computer science and data science techniques to deal with energy consumption in the maritime transportation industry. The data-processing flowchart is presented in Fig. 8. The data feature extraction was done through a modern informative clustering system and a deep learning technique. The combination of these modern methods was able to deal with problems related directly to ocean engineering. The fuel consumption and the operational condition of the ship are the objectives of the study.
The dataset was based on the collected database from the sea-trial database of a vessel. This database was collected from a target ship built in 2013 at the Saijo Shipyard of Imabari Shipbuilding Co., Ltd., in Japan. There were 520 samples of training data in this study. The dataset of the vessel was split for training (80 percent) and validation (20 percent). The correlation between the fuel consumption and the hull and propeller condition was validated through cross-validation of the trained model. This technique is suitable for a limited dataset as well as data feature extraction. The collected database was verified through the current status of the ship. The ship hull condition and the marine propeller were investigated through the effects of parameters on the fuel consumption of the main engine along with the navigation environment condition at each voyage of the ship.
A deep learning technique was employed in this research based on a CNN model. This technique is helpful to predict uncertain factors and changeable values under the navigation environment condition. The maritime navigation environment condition is always changeable in different ocean areas. This is the main reason that the fuzzy set theory was studied and developed through clustering the uncertain database into different clusters/layers based on the feature extraction database.
The prediction model of the ship hull condition and the marine propeller was designed through a CNN model, which is an advanced machine learning technique to predict uncertain parameters that are variable and changeable during the operation of a ship. Additionally, determining input parameters is important to decide the appropriate degree level of the proposed prediction model for two factors (ship hull condition and marine propeller). Through the onboard vessel operation process, the ship operation condition decides and influences the investigated parameters related directly to the ship hull and marine propeller conditions. These parameters influence fuel consumption, the navigation environment condition, and marine engineering. The predictive model is presented in Fig. 9.
The input parameters of the CNN model include the time of the test (X1), the ship speed (X2, unit: knots), the shaft speed (X3, unit: rpm), the temperature of the sea water environment (X4, unit: oC), and the temperature of the atmosphere environment (X5, unit: oC). These parameters directly influence the ship hull and marine propeller condition, which were the investigated factors in this research. The output parameters of the model are the surface roughness image of the ship hull (Y1) and the surface roughness image of the marine propeller (Y2). These parameters are the main factors influencing the residual surface status of the ship hull and the marine propeller. To verify the proposed model accurately, images of the ship hull condition and marine propeller of the target ship were recorded and are presented in Fig. 10. The ship was scheduled to come to the dock by a shipping plan due to the proposed work by the transportation company. The ship position was recorded and supervised by an assigned person and engineers at the building shipyard. For this research, the target ship came to Fujian Huadong Shipyard in Fujian Province, China.
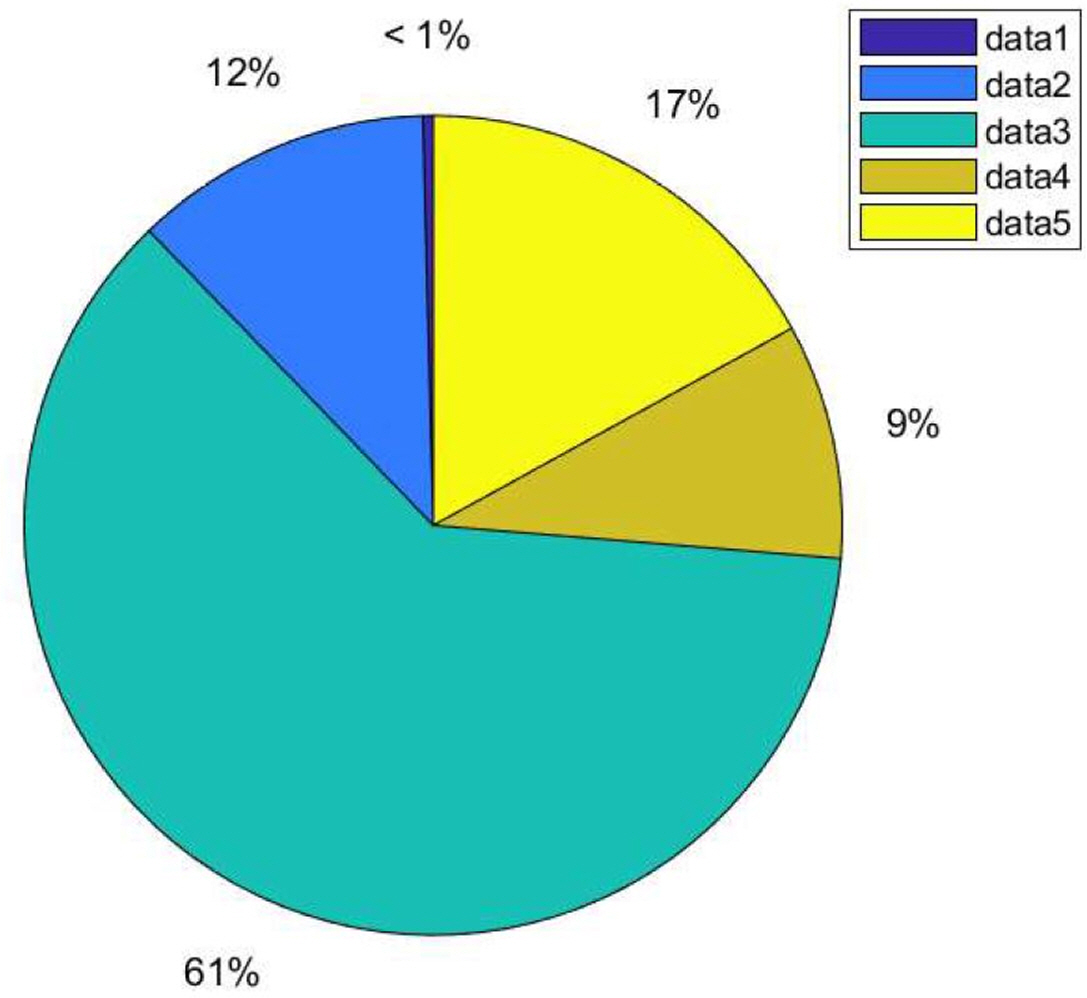
The collected database was evaluated and validated based on the Matlab platform before selecting the number of clusters. The fuzzy clustering method enables the evaluation of the collected results from one layer to five layers. The weight of each layer is illustrated in Fig. 11. Based on the collected results, the number of layers in the three groups with the highest proportional value was 61% from the initial database, which was used in the predicted model.
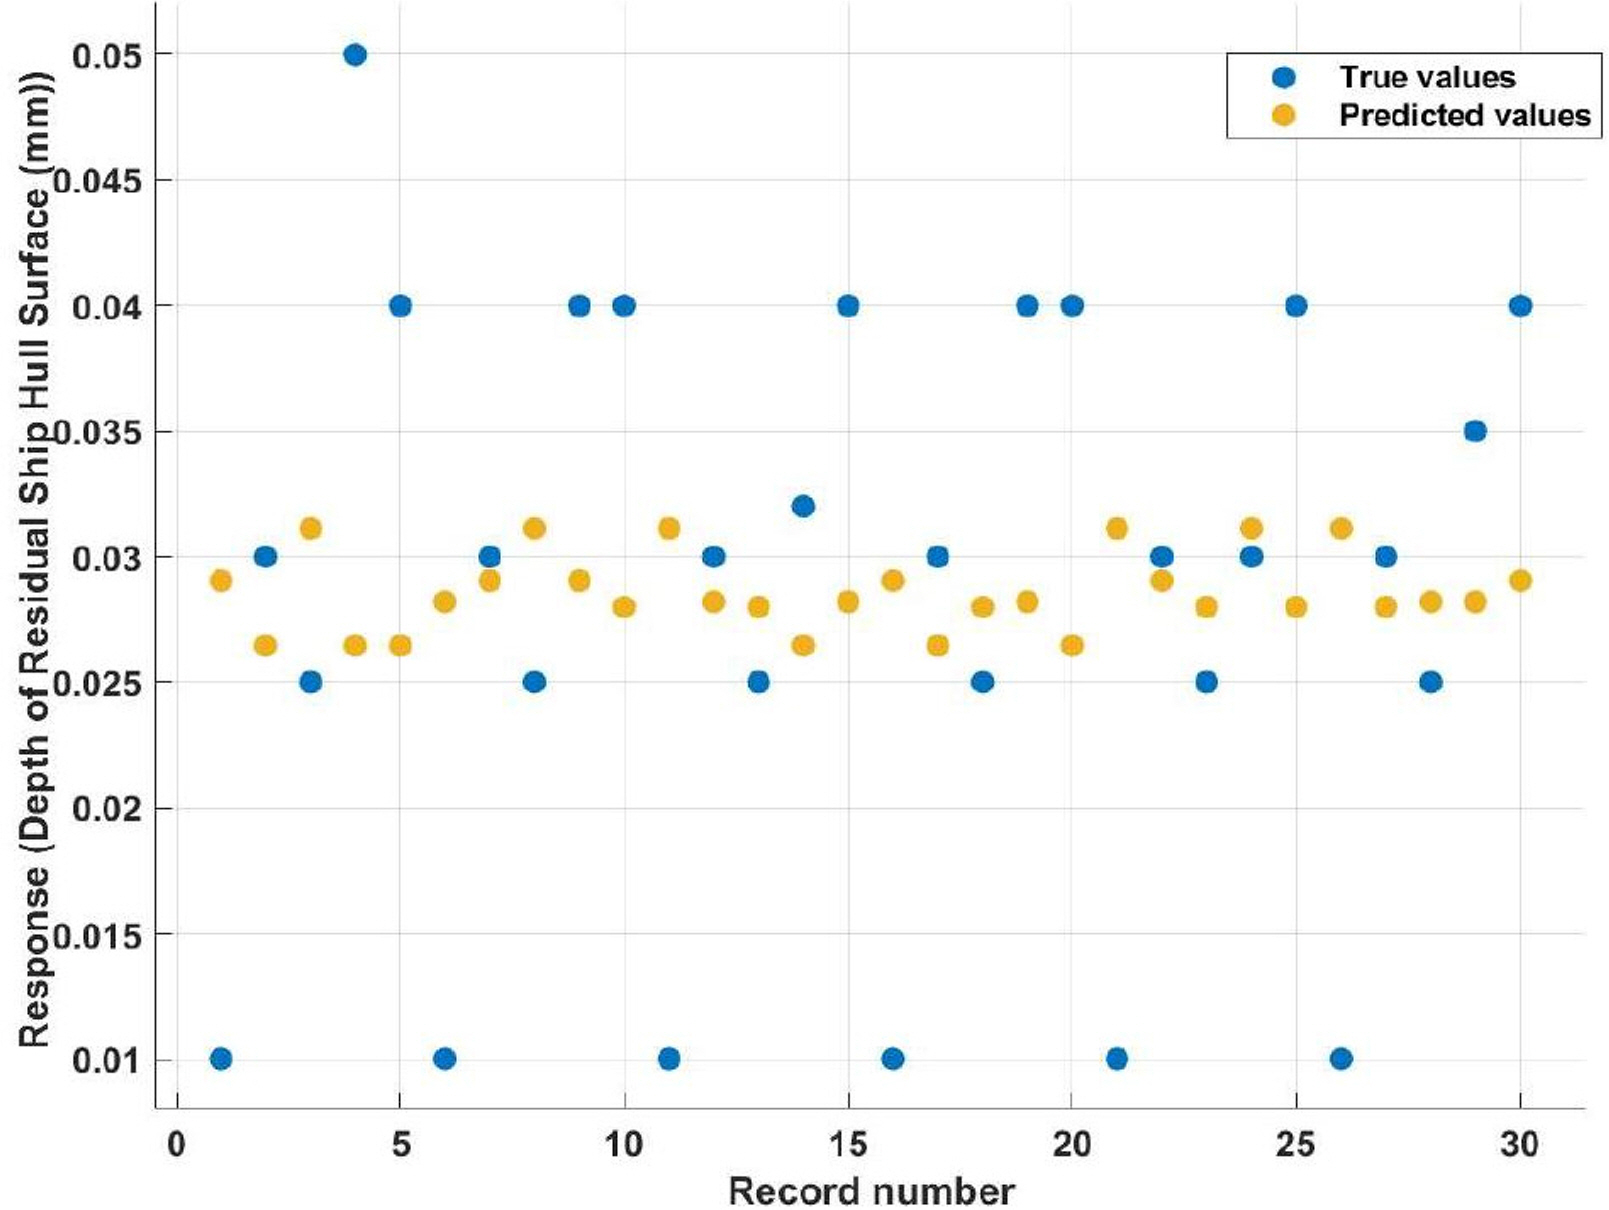
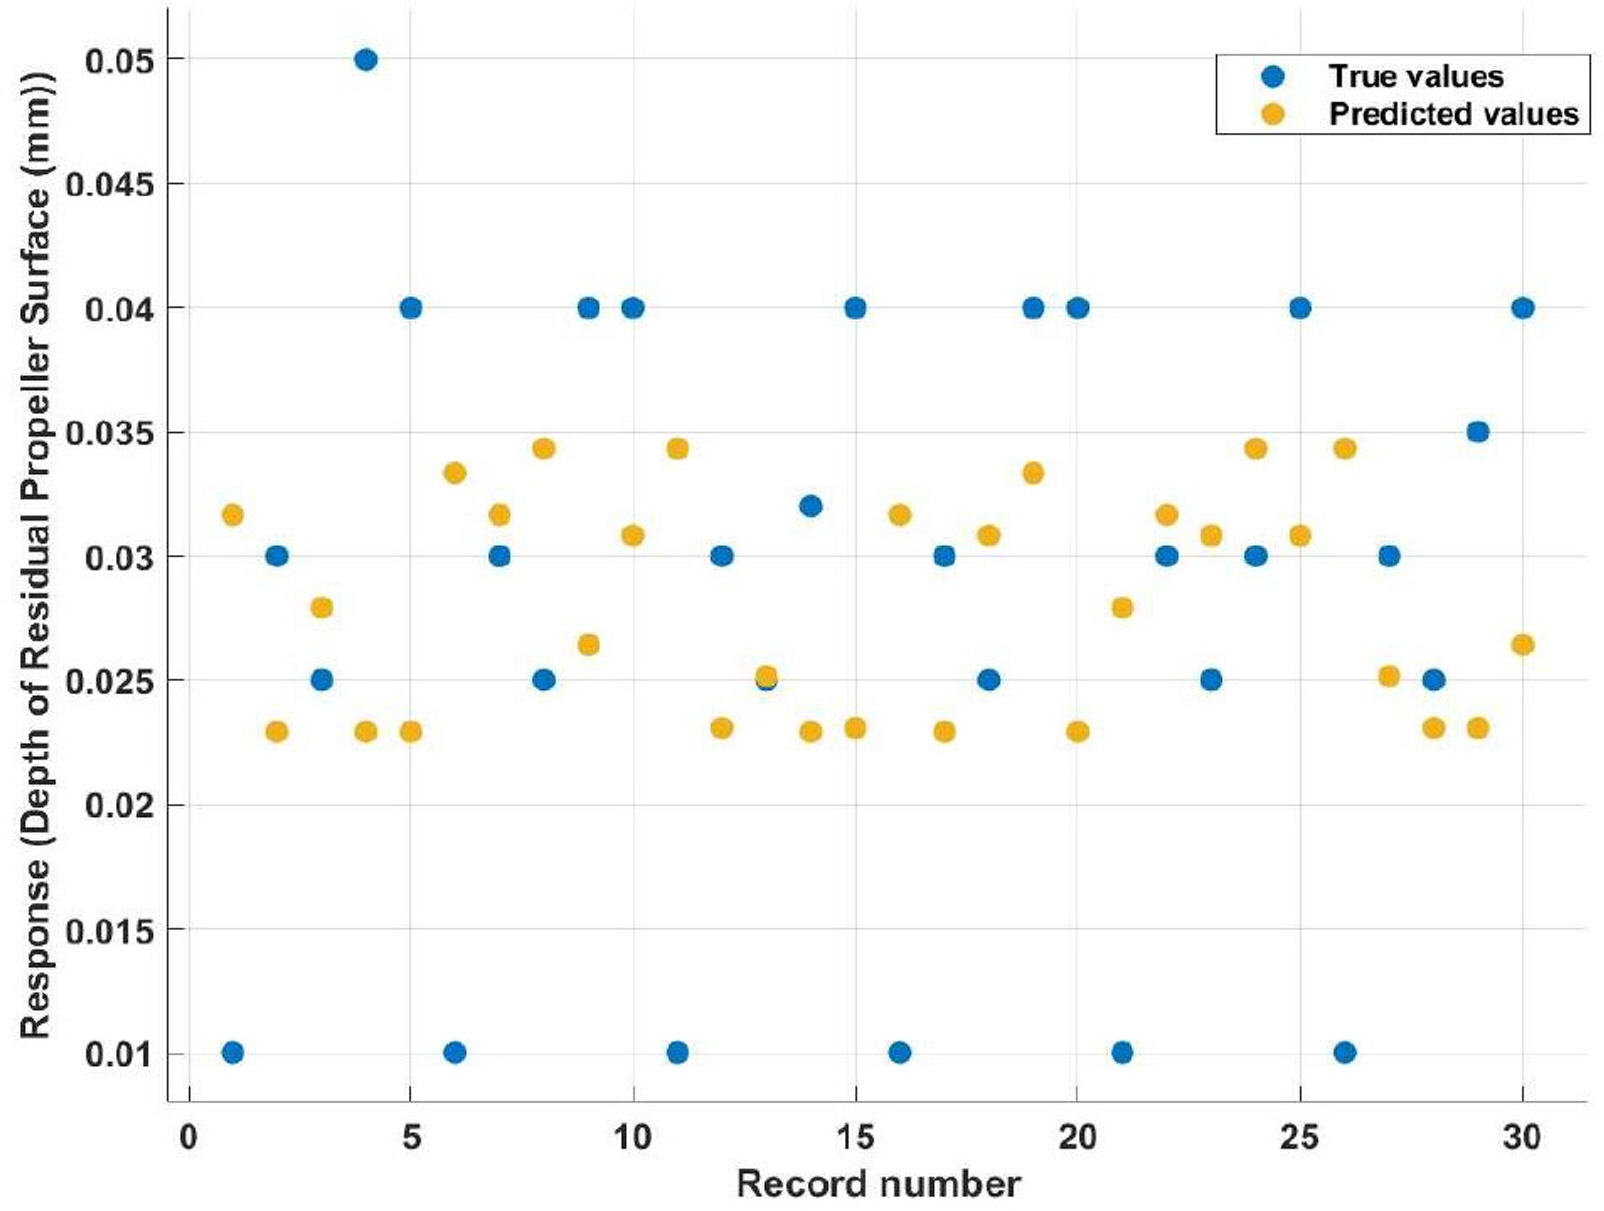
From the proposed model, the predicted and actual values of the ship hull condition and the marine propeller are presented in Figs. 12 and 13. The depth of the residual surface (mm) was predicted and validated with the actual values when the target ship was at Fujian Huadong Shipyard, China. This was based on the proposed algorithms in the two cases shown in Figs. 3 and 4 above in the section about the proposed methodologies.
The proposed model collected good results with a coefficient of determination R2 > 0.94)for both the ship hull condition and the marine propeller. The RMSE was also reasonably low with 0.0120 and 0.0139 for the ship hull surface roughness and the marine propeller surface roughness, respectively. Additionally, the mean absolute error in both cases was acceptably small, with 0.0097 and 0.0115 corresponding to the ship hull condition and marine propeller conditions, respectively (Table 2).
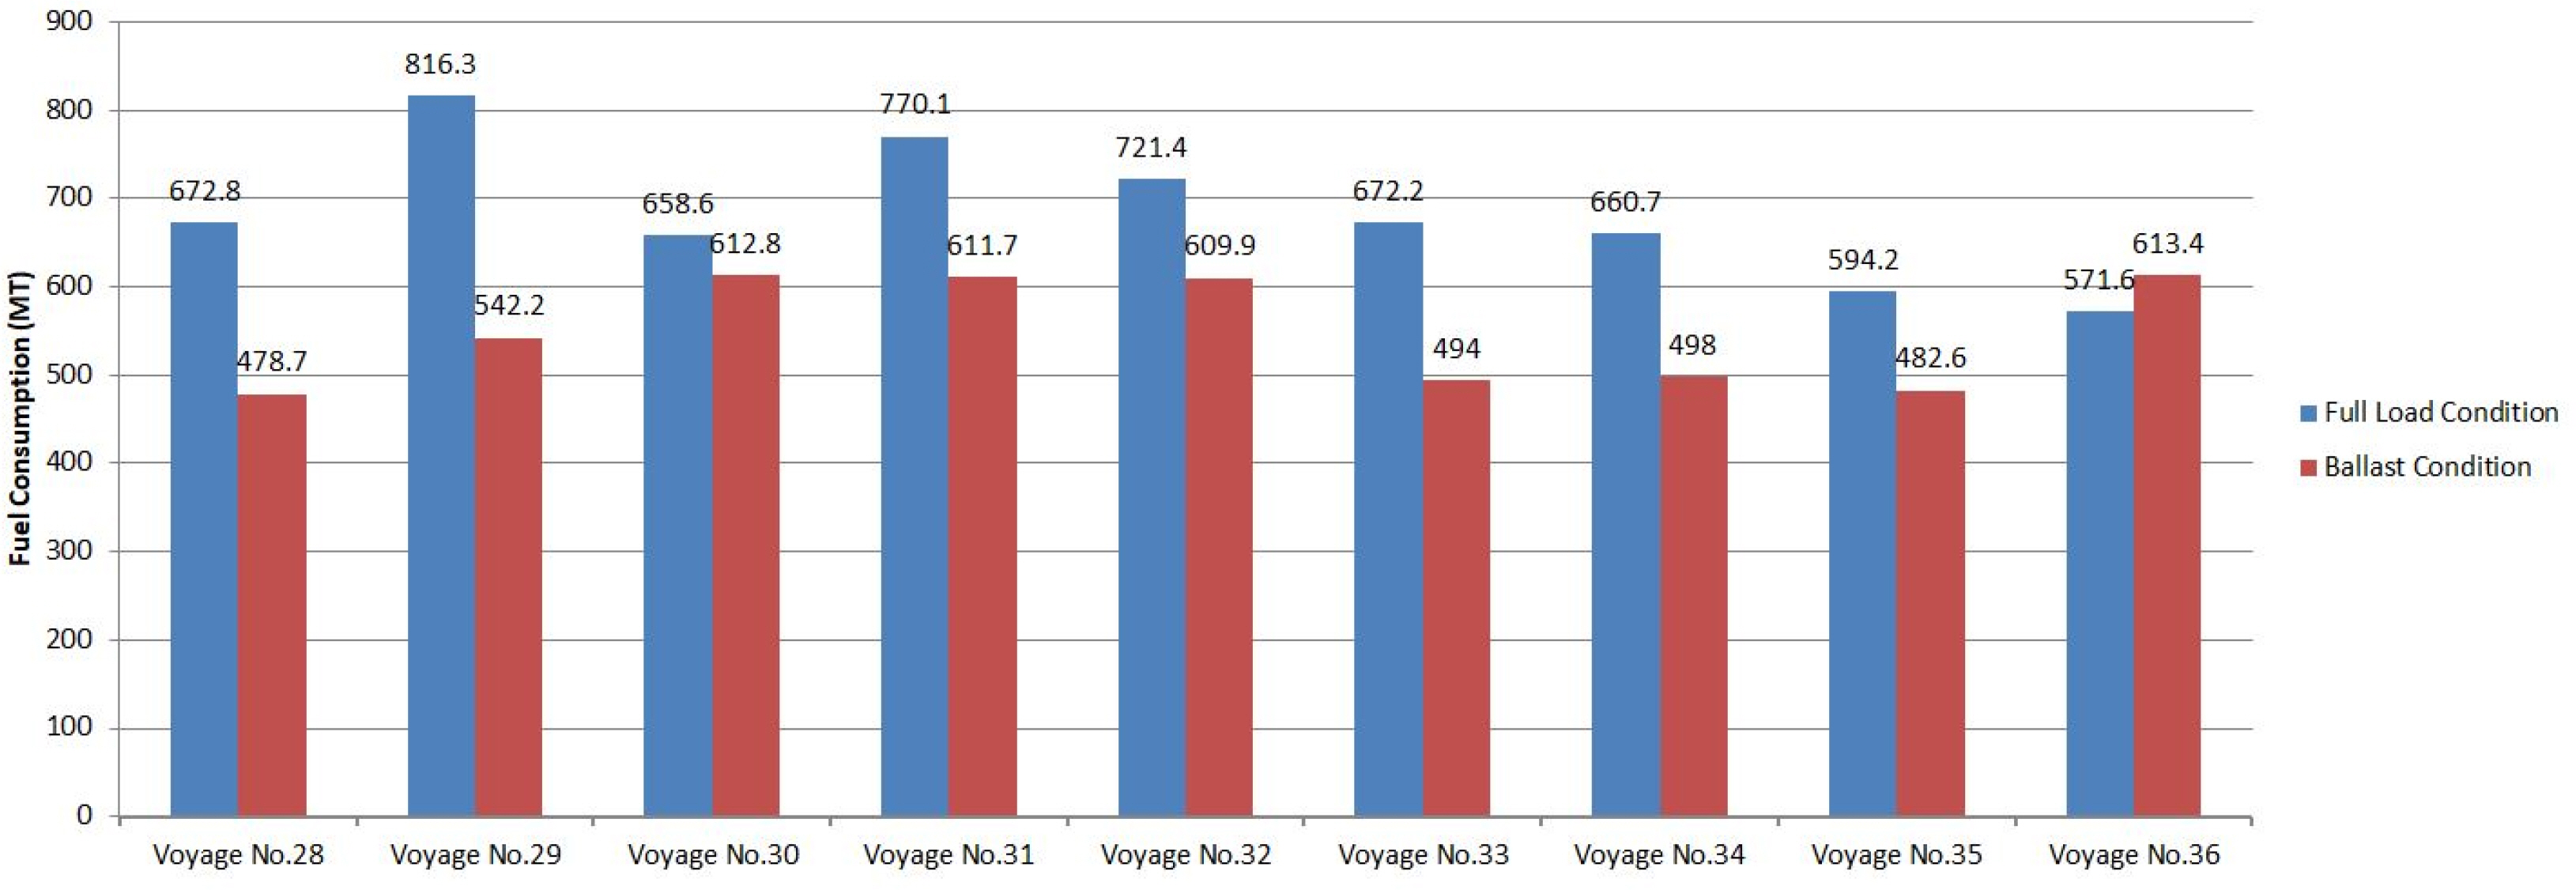
Additionally, the marine environment condition also influences fuel consumption along with the ship hull condition and the marine propeller. The actual navigation operation condition and the ship hull condition influence the ship’s energy consumption. The actual operation process was presented through certain voyages. The details of each investigated voyage were provided and verified by the ship master and the chief engineer of the ship.
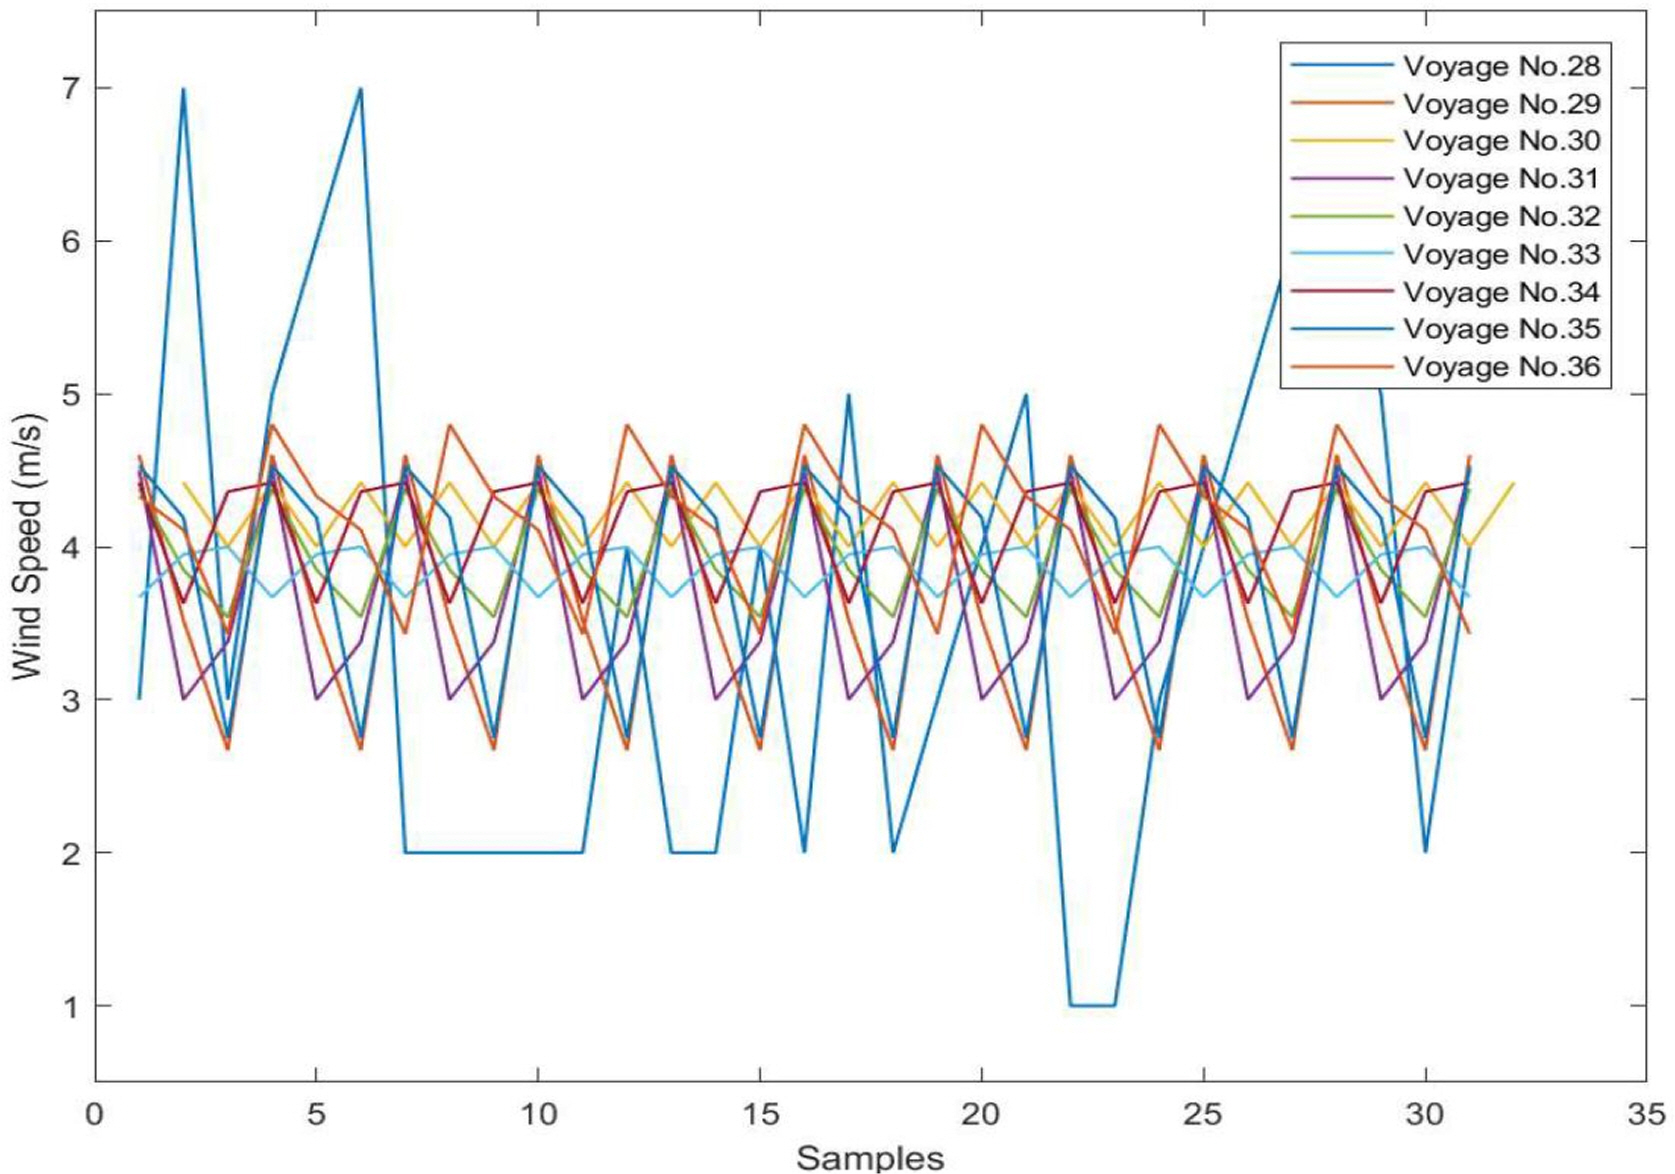
The wind speed (m/s) and the wave height (m) are presented in Figs. 14,–16. In the collected results, the rough sea condition in voyages No. 28 and No. 32 led to high fuel consumption of the vessel along with higher depth of the residual surface of the ship hull and marine propeller (mm) at values of 0.04–0.05 mm. Voyage No. 35 had a calm water condition with the minimum wave height (m) and wind speed (m/s). The fuel consumption in this voyage was low, corresponding to a depth of the residual surface of 0.01 mm.
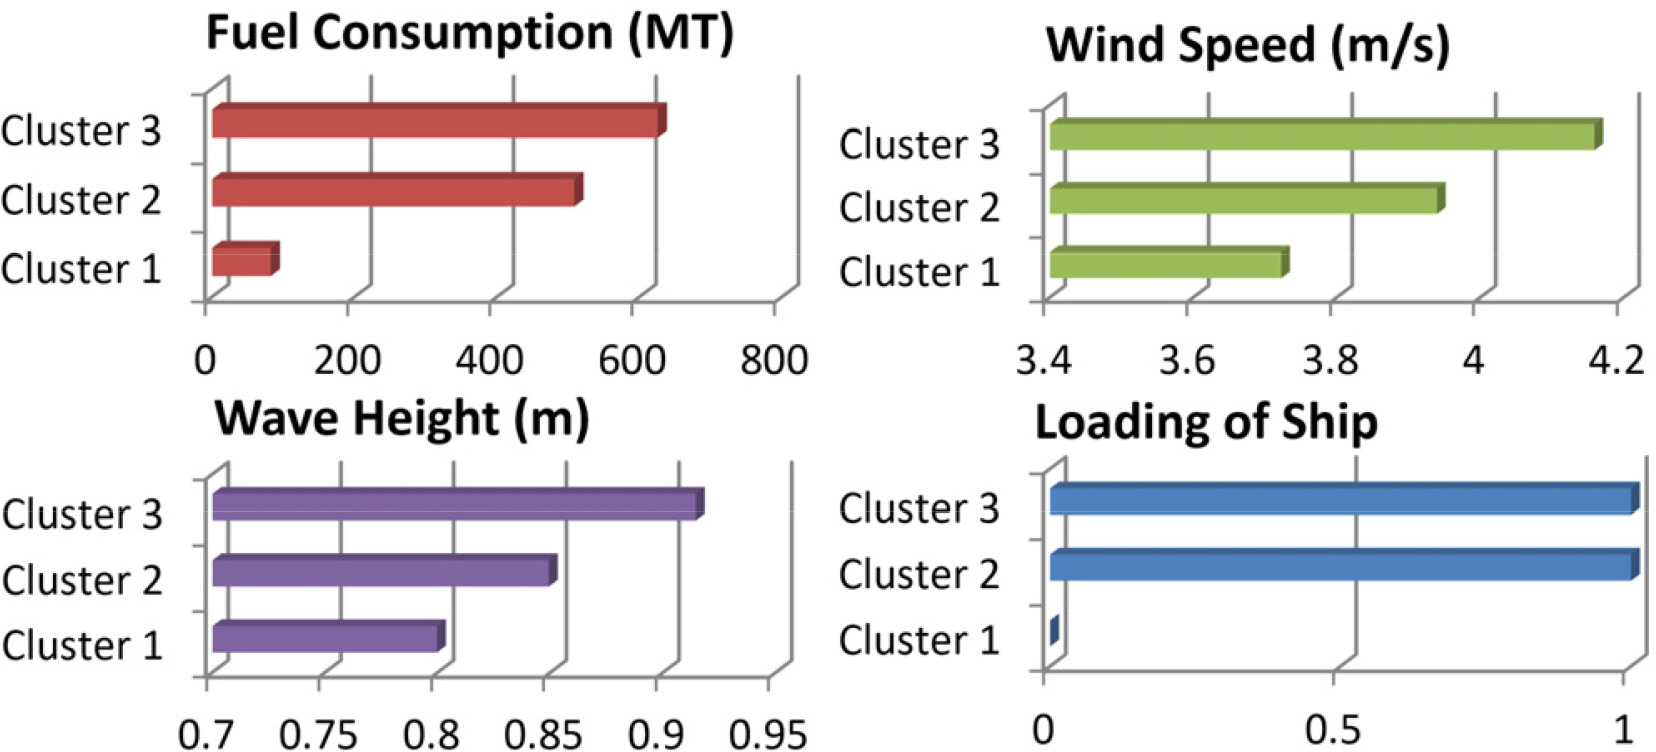
The same database cluster/layer considering the ship loading condition (full load condition/ballast condition) is presented in Fig. 17. From the collected results in Fig. 11, three clusters were selected with specific values in each group. The collected results were expressed through the optimization algorithm in Fig. 6. The same characteristics of a parameter were classified into a cluster with the nearest Euclidean distance compared with the center layer. The hyper-parameters were arranged into the same group with an identical feature through this optimization algorithm.
In the first layer/cluster, the engine’s fuel consumption was lowest and under 100 t in the investigated voyage corresponding to the calm sea condition along with the ship loading condition (ballast condition). The wave height was under 0.8 m, and the wind speed was about 3.7 m/s. In contrast, the rough sea condition made the fuel consumption the highest at the third cluster/layer at about 600 t. The navigation environment condition was also heavy with a full load condition, wind speed above 4.1 m/s, and wave height above 0.9 m.
Concluding Remarks
Evaluating fuel consumption is vital for effective ship operation and management. External factors, such as environmental conditions and ship load, influence fuel consumption and energy efficiency. This study systematically assessed these conditions with an emphasis on navigational environment factors, ship load, hull, and propeller conditions. The aim was to improve understanding of variables impacting ships’ fuel consumption, thereby enhancing energy efficiency management. Key contributions of this study include the following:
The proposed methodology utilizes fuzzy set theory within an informatic system and employs machine learning clustering to refine data from actual ship operations.
We applied a CNN model to predict the residual surface depth for both ship hull and marine propeller conditions. This approach aided in examining impacts on energy consumption, navigation conditions, and ship loading. The model’s effectiveness was underscored by an R2 value exceeding 0.94 in both cases.
Enhanced accuracy in calculating ship fuel consumption benefits ship owners and operators. The results demonstrate that combining informatics theory, machine learning, and deep learning (CNN) effectively addresses complex challenges in maritime transportation and ocean engineering.