J. Ocean Eng. Technol. Search

CLOSE


J. Ocean Eng. Technol. > Volume 34(5); 2020 > Article
Shin, Ki, Park, Lee, Lee, Kim, and Lee: Speed-Power Performance Analysis of an Existing 8,600 TEU Container Ship using SPA(Ship Performance Analysis) Program and Discussion on Wind-Resistance Coefficients

Abstract

This study discusses data collection, calculation of wind and wave-induced resistance, and speed-power analysis of an 8,600 TEU container ship. Data acquisition system of the ship operator was improved to obtain the data necessary for the analysis, which was accomplished using SPA (Ship Performance Analysis, Park et al., 2019) in conformation with ISO15016:2015. From a previous operation profile of the container, the standard operating conditions of mean draft were 12.5 m and 13.6 m, which were defined with the mean stowage configuration of each condition. Model tests, including the load-variation test, were conducted to validate new ship performance and for the speed-power analysis. The major part of the added resistance of container ship is due to the wind. To check the reliability of wind-resistance calculation results, the resistance coefficients, added resistance, and speed-power analysis results using the Fujiwara regression formula (ISO15016:2015) and Computational fluid dynamics (Ryu et al., 2016; Jeon et al., 2017) analysis were compared. Wind speed and direction measured using an anemometer were used for wind-resistance calculation and the wave resistance was calculated using the wave-height and direction-data from weather information. Also, measured water temperature was used to calculate the increase in resistance owing to the deviation in water density. As a result, the SPA analysis using measured data and weather information was proved to be valid and able to identify the ship’s resistance propulsion performance. Even with little difference in the air-resistance coefficient value, both methods provide sufficient accuracy for speed-power analysis. The differences were unnoticeable when the speed-power analysis results using each method were compared. Also, speed-power analysis results of the 8,600 TEU container ship in two draft conditions show acceptable trends when compared with the model test results and are also able to show power increase owing to hull fouling and aging. Thus, results of speed-power analysis of the existing 8,600 TEU container ship using the SPA program appropriately exhibit the characteristics of speed-power performance in deal conditions.

1. Introduction

To prevent global warming, the reduction of greenhouse gases (GHG) that originated from ship operation is a crucial issue, and relevant regulations are under discussion in International Maritime Organization (IMO) continuously. Among these, Energy Efficiency Design Index (EEDI) that is applicable to new ships has already been implemented, and the Energy Efficiency Existing Ship Index (EEXI) for the existing ships is currently under discussion (IMO, 2014; IMO, 2019).
For the improvement of EEDI of new ships, many technologies have been developed with shipyards at its core, and in particular, considerable progress had been made with the development of design technology. However, for the existing ships built prior to the EEDI regulation, as the regulations will come into effect in near future, retrofitting for energy saving devices and an eco-friendly operation for the increase of operational efficiency are the technologies that need to be secured by ship companies with their efforts.
In order to secure ship operators’ competitiveness through reducing GHG emitted during ship operation and saving fuel, it is necessary to identify the accurate estimations of the ship operational performance in real sea. Newly constructed ships exhibit the best resistance propulsion performances with their clean bodies and propellers. The reference speed in a calm sea environment is obtained from speed trials in such conditions and attained EEDI is calculated.
For the assessment of speed and power, ISO15016:2015 standard was developed, which is used to estimate the reference speed in a calm sea environment. The authors developed i-STAP (ISO15016:2015 Speed Trial Analysis Program), and are currently using it for estimating the reference speed of various types of ships, including container ships, with widely acknowledged high accuracy. (Shin et al., 2016; Lee et al., 2016; Yu et al., 2016; Kim and Kim, 2016). After delivery of a new ship, hull and propeller performance are expected to degrade with aging. When the ship undergoes periodic dry docking, sanding, cleaning and painting of the ship hull and its propeller are performed, these result restoring the resistance propulsion performance. Therefore, the resistance propulsion performance of a ship is periodically increased and degraded within the ship’s life cycle. However, there has been no precise qualitative or quantitative evaluation method for this.
In addition, it is extremely difficult to estimate the resistance propulsion performance of the existing ships that have been already degraded in performance under operation. There is a case wherein shipyard experts boarded an operating ship to conduct a performance trial to verify speed-power performance of the existing ship in real sea. In this case, speed through water was used instead of the Global positioning system (GPS) speed to obtain acceptable results, since performing double run during ship operation was difficult. (Lee et al., 2016). This shows why an automated implementation of a speed-power performance analysis system is required.
Lim et al. (2019) introduced the results of performance monitoring in real sea for the hull and propeller performance verification of the operating ship. They measured shaft power against the ship’s speed using data gathered over one month. The results showed no noticeable trends due to a large variance. Furthermore, Freitas et al. (2019) performed a full-scale measurement to verify the effect of an air-lubrication system and illustrated the measured shaft power against the ship’s speed. Only filtering was applied and it also failed to verify the effects of the air-lubrication system due to a large variance. Therefore, it is necessary to convert resistance propulsion performance to a calm sea environment by analysing the added resistance to draw any meaningful comparison results.
Murrant et al. (2019) performed a speed trial before and after hull and propeller cleaning in order to identify the operation performance of an offshore patrol vessel. This speed trial was performed using the same procedure as that used for the new ships. However, it was stated that it was difficult to verify the effect of the hull and propeller cleaning owing to the 8% difference in displacement across all three speed trials.
To interpret the speed-power performance of the existing ship, target displacement and speed range should be defined. In addition, as it is difficult to perform a double run during operation, an automatic data collection and transmission system for measured data including an accurate speed log. Data that are difficult to measure such as wave data, should be extracted from weather information. And the speed-power performance should be identified and compared with delivered horse power (DHP) in calm sea environment derived by analysing added resistance in real sea environment.
This study aimed to perform a highly accurate analysis of speed-power performance of a currently operating 8,600 TEU container ship using the SPA (Ship Performance Analysis) program (Park et al., 2019; Lee et al., 2019), which is developed in conformance with the speed trial analysis method for new ships. To begin with, container stowage shapes of frequently operated conditions were determined by reviewing the operation data. Data required for the analysis were secured by improving the ship operator’s own data collection system. A model test including the load-variation test presented in ISO15016:2015 standard was performed to identify the performance at the design stage. Air-resistance coefficients were derived from previously determined container stowage shapes. And the added resistance due to wind in operation is calculated using wind speed and direction measured by anemometer onboard. Added resistance due to waves is calculated using the weather-information data. It was confirmed that the speed-power characteristics at calm sea environment estimated from the analysis show similar trends as model test results. Furthermore, discussions on the analysis results with air-resistance coefficients derived using the Fujiwara regression formula (ISO15016:2015) and CFD (Computational fluid dynamics) simulation (Ryu et al., 2016; Jeon et al., 2017) are included as well.
It is expected that the results of this study will be utilized for the analysis of cleaning effects of the ship hull and propellers, painting, GHG reduction from retrofitted ESD (Energy Saving Device) and environment friendly shipping.

2. Ship Data and Standard Operating Conditions

2.1 Data of Target Ship

The target ship is an 8,600 TEU container ship, and principal dimensions and images of the ship are shown in Table 1 and Fig.1, respectively. As shown in Fig. 2, the main route travels through Korea, China, Singapore, the Middle East, and Europe. The target ship was built prior to the enforcement of EEDI regulation, and the ship operator required high speed at the time. Therefore, this ship is equipped with an engine that provides a large output that exceeds the 100,000 kW and has an extremely high design speed of 27.5 knot (14.1 m/s).

2.2 Standard Operating Condition

After the EEDI regulation came into effect, the ship operator put an efforts into the energy-efficiency improvement and GHG reduction in their own ships. The method which is most easily and widely used is slow steaming. This is attributed to the benefits of fuel saving and GHG reduction being more than the loss from prolonged transporting time. Although the target ship had a design speed of 27.5 knot (14.1 m/s), it is operating now within the actual range of 15–18 knot (7.7–9.3 m/s).
The ship operating profiles show that more than 70% of operation was within 80–95% of full load displacement and more than 80% of operation was within 70–95% of full load displacement as shown in Fig. 3. Moreover, as a result of analyzing operation data gathered over a year, the condition that shows the highest frequency among the head hauls that depart from Korea is TM 12.5 m, which implies a displacement of 109,961 t; and the same among back hauls is TM 13.6 m, which corresponds to a displacement of 122,954 t. Furthermore, the most frequent speeds in these conditions are 18.5 knots (9.5 m/s) and 15.4 knots (7.9 m/s), respectively. A ship that corresponds to these conditions was determined as the standard operating condition and are summarized in Table 2.
According to ISO15016:2015, the recommended displacement correction is within 2%, and this correction amount is equivalent to TM 0.2 m. However, to practically obtain and analyse the speed-power performance data, the displacement was corrected within the range of ±0.5 m with the same formula as proposed in ISO15016:2015. A tank test was performed on displacement and speed conditions that correspond to this standard operating condition, and the actual ship’s measured data were obtained and analysed.

3. The Actual Ship’s Performance Estimation and Data Measurement
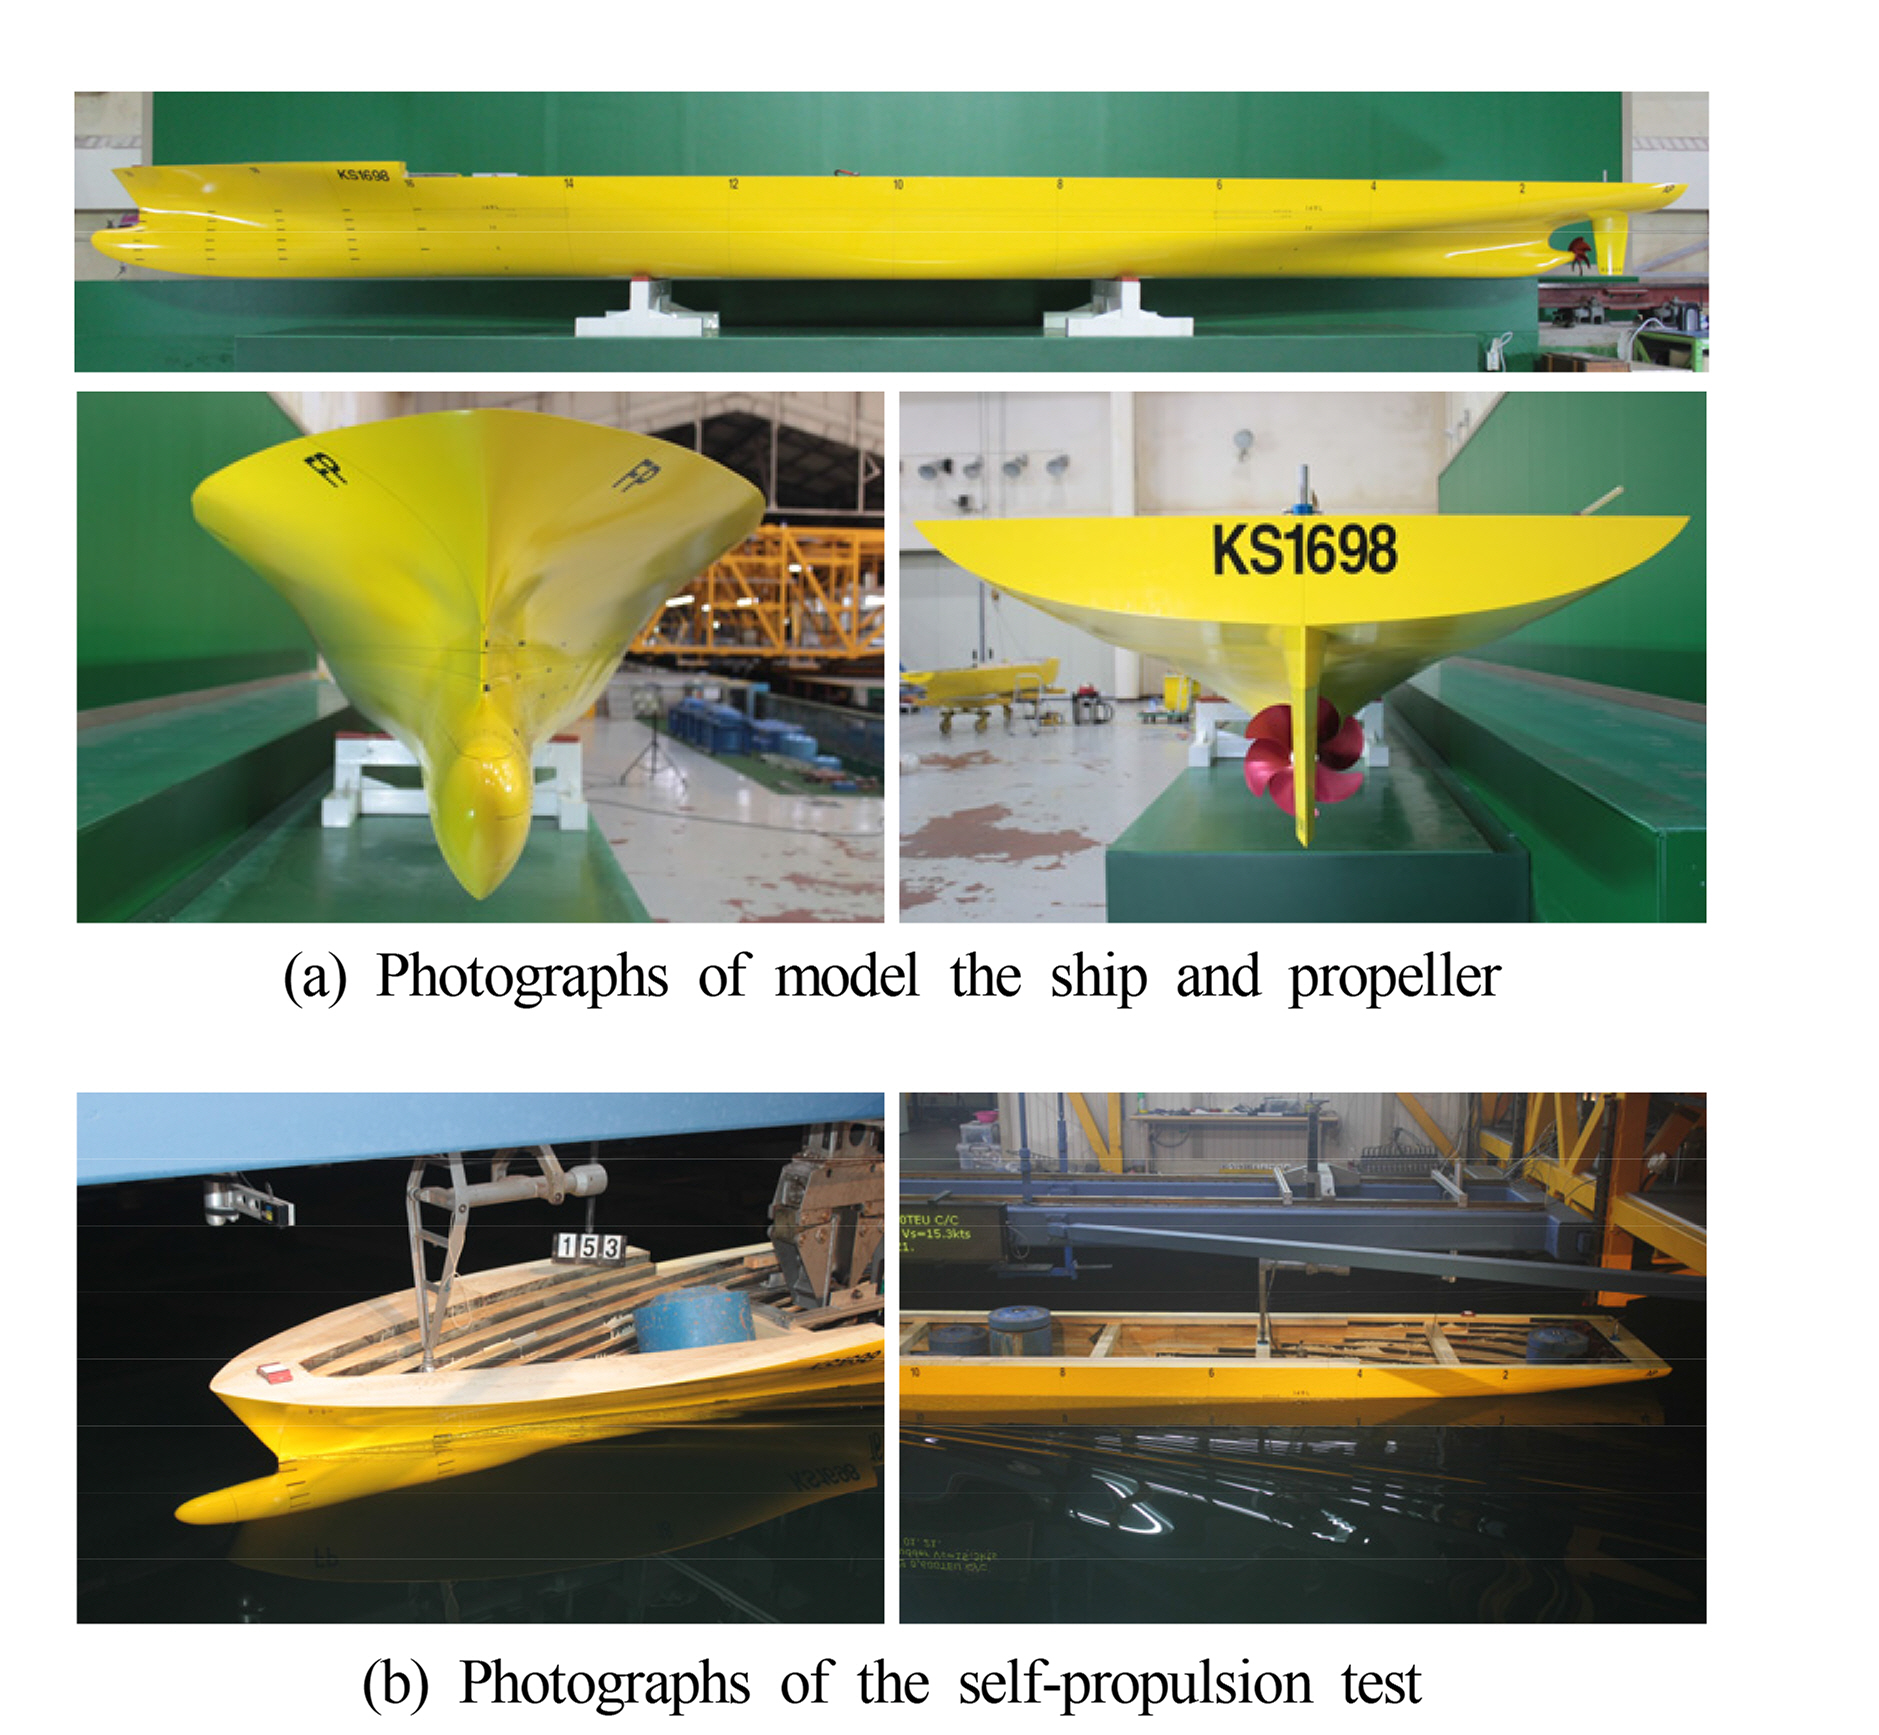
This chapter discusses the result of the tank test and data measurements for the actual ship’s performance estimation. Target speeds under standard operating conditions are 18.5 knots (9.5 m/s) and 15.3 knots (7.9 m/s). The actual ship’s performance at a given displacement and speed under standard operating conditions was estimated using the result of the tank test performed when the ship was built. However, as there were no results for speed less than 20 knots (10.3 m/s), the tank test was re-performed.

3.1 Tank Test

As mentioned previously, to analyse the target ship’s speed-power performance under standard operating conditions, tank tests were performed. The test was performed in a towing tank (200-m length, 16-m width, and 7-m depth) at the Korea Research Institute of Ships & Ocean Engineering (KRISO), Korea Institute of Ocean Science & Technology (KIOST), and the model’s scale ratio was 1/36. Fig. 4 shows the models for tank test and photographs of self-propulsion test. This ship is a high-speed ship with the design speed of 27.5 knots (14.1 m/s) when it was built, and it is equipped with hexapropeller for this purpose.
The tank model test was performed under the standard conditions listed in Table 2. The speed range was within the actual operating speed range of 12.5–22 knots (6.4–11.3 m/s). The predicted DHPs of the ship were all normalized to DHP values of 18.5 knots (9.5 m/s) and 15.3 knots (7.9 m/s), which are the reference speeds described in the standard conditions in Table 2. Results of resistance test of TM 12.5 m and trim resistance test were shown in Fig. 5 and Fig. 6, respectively. According to Fig. 6, the trim by bow shows a relatively lower DHP. DHP is reduced by 2.76% at trim by bow (1 m), and this corresponds to 0.8% of DHP at 18.5 knots (9.5 m/s). The predicted results of DHP and RPM (revolution per minute) across the entire speed range are shown in Fig. 5.
According to ISO15016:2015, to predict DHP at a certain speed through water in clam sea environment, DHP from additional resistance are deducted from the measured DHP (PDms). If the added resistance is applied, the speed of the ship is reduced and to consider propulsion efficiency at this speed, load-variation test is to be performed in model basin. This requires derivation of the load-variation parameter, ξP performing self propulsion test while changing propeller RPM at fixed towing speed. The measured load-variation test parameter is presented in Table 3. This value is used in Eq. (5) to solve PDid in a calm water environment. Although ISO15016:2015 also requires the correction of RPM by considering shallow water and load-variation effects, these are not considered as they are not in the scope of this study.

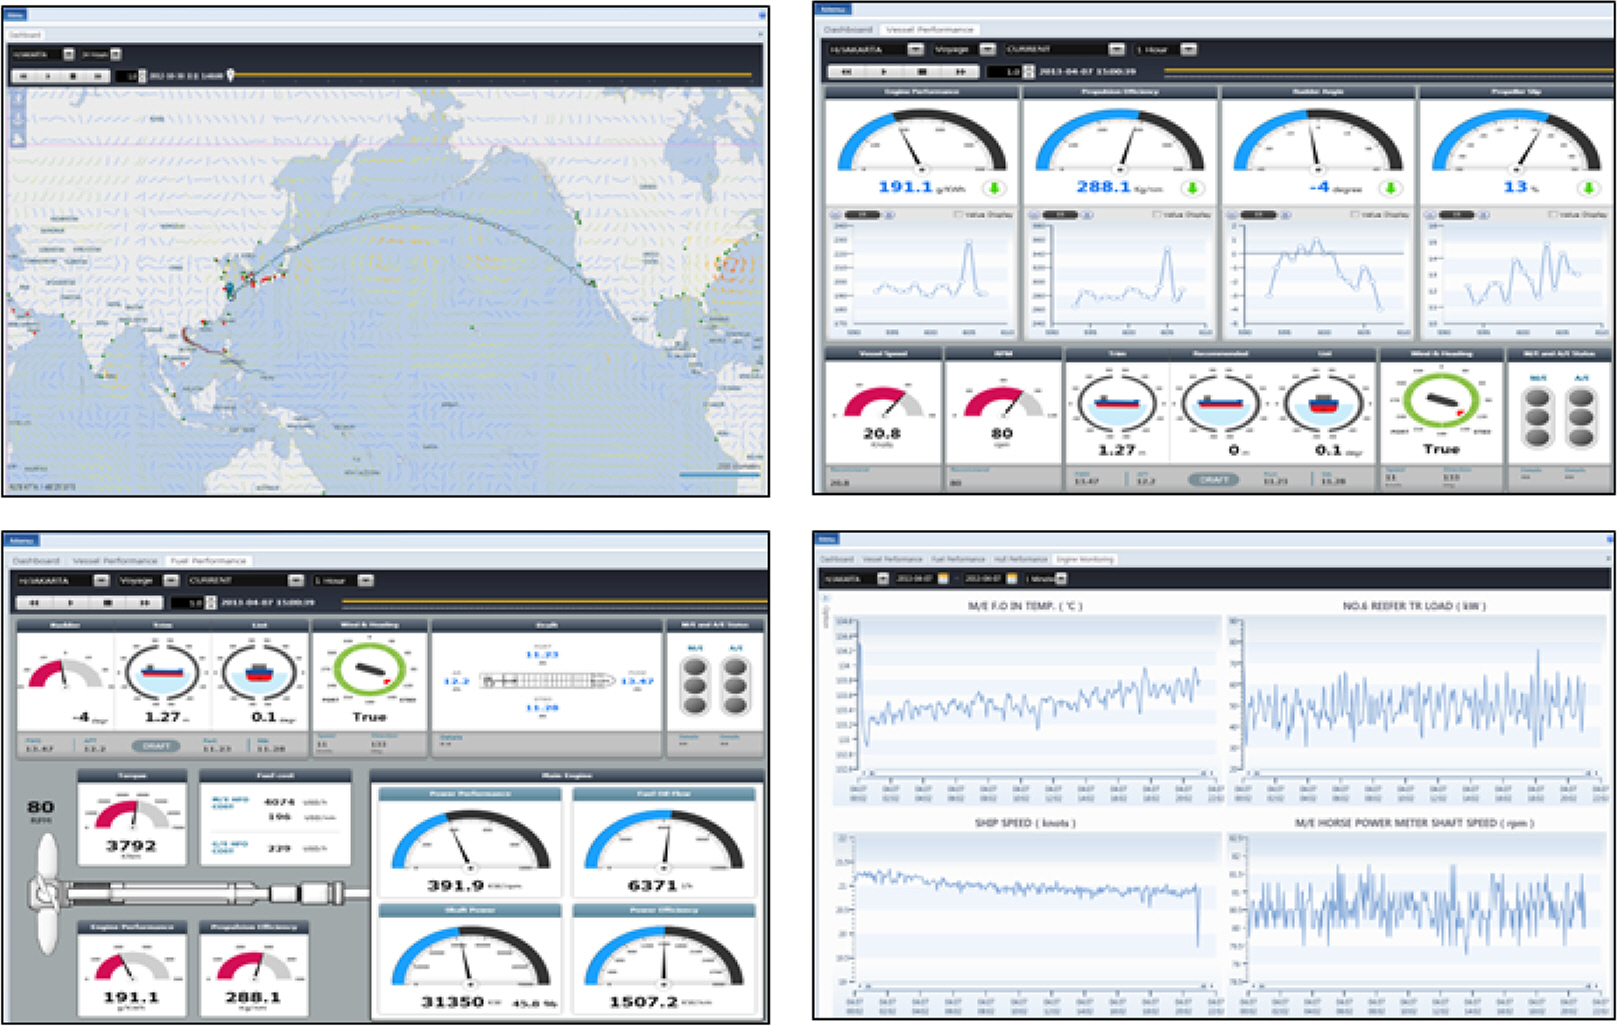
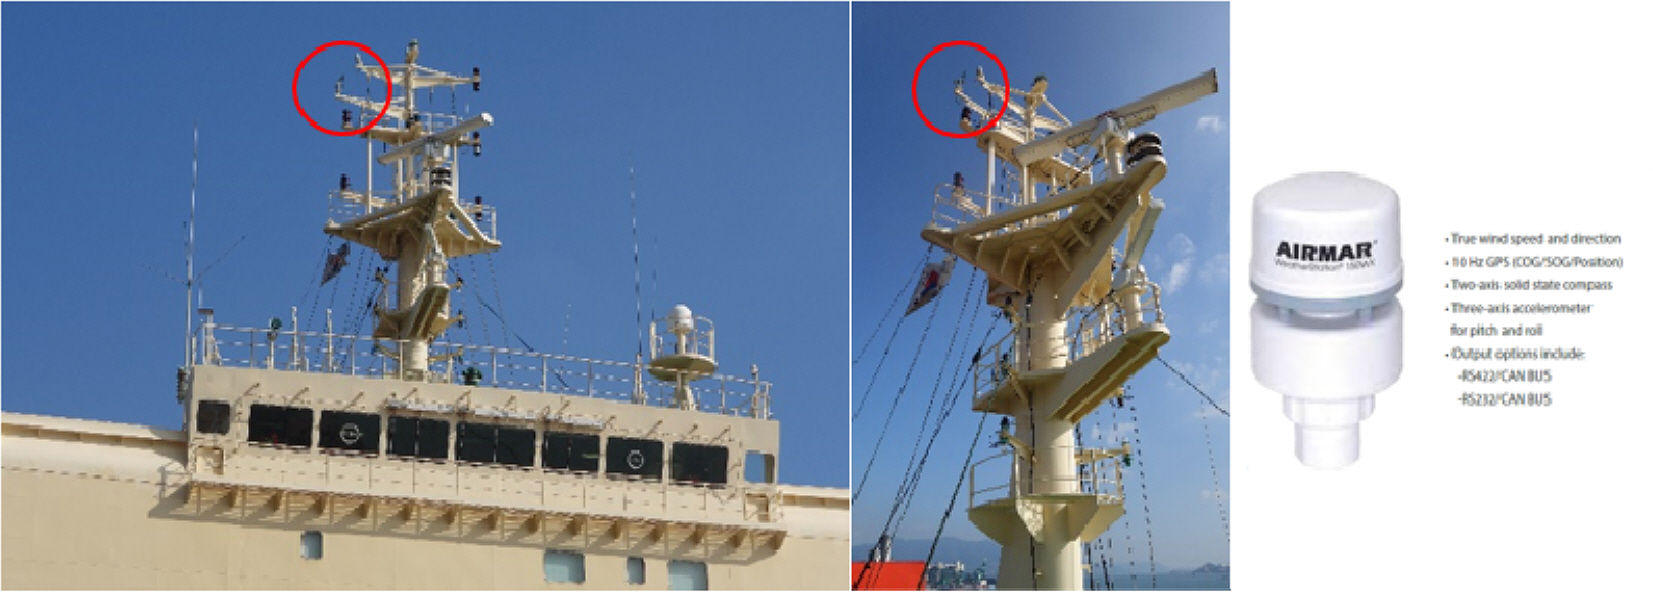
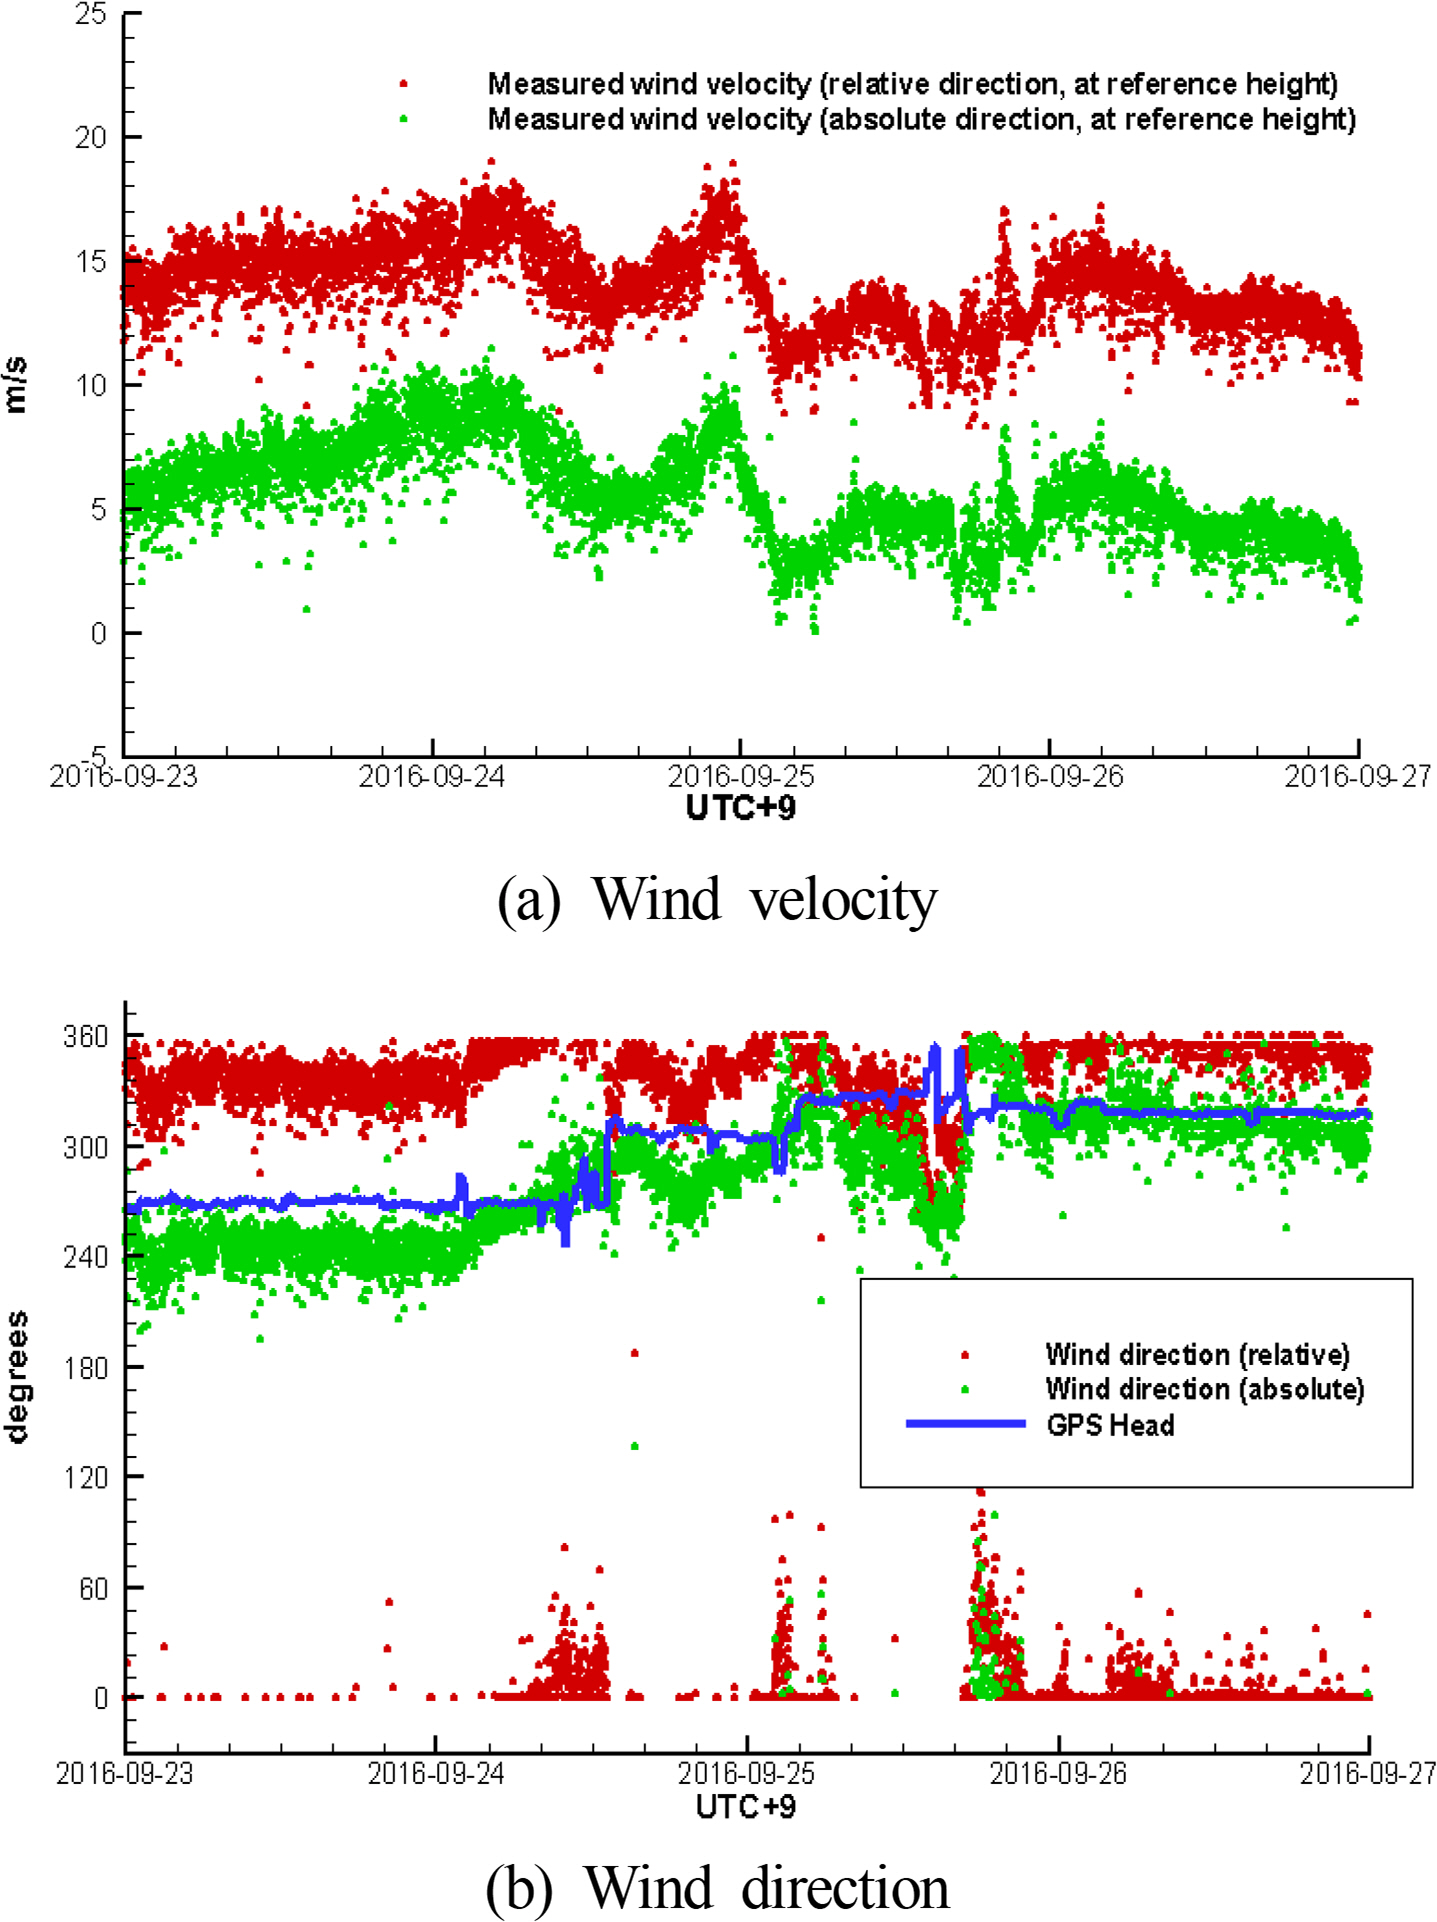
3.2 The Actual Ship’s Data Measurement and Collection

The target ship is operated with an EEMS (energy efficiency monitoring system) installed, which is shown in Fig. 7. This system is for real-time collection and land transmission of various types of operation data. Its major features include identifying normal state of operation, fuel-efficiency analysis, early warnings of abnormal state of operation, and sharing best practices between ships through a correlation analysis among operating data. Forty items of data, including course, heading, and ballast water, and eighty items of data, including measured DHP, fuel consumption, water temperature, and wind speed, are collected. To improve the accuracy of wind speed data, an ultrasonic anemometer was newly installed. The anemometer was installed by selecting a location that is less affected by the air flow from the ship, the photographs of which are shown in Fig. 8.
The measurements had been performed for four years since 2015. To obtain the measured data with high accuracy, the monitoring system of the ship operator was improved as well as increasing the accuracy of some measurement equipment such as anemometer and mass flow meter. In addition, wind speed, wave, and water temperature data at the location and time of the ship were extracted from the National Oceanic and Atmospheric Administration data and weather-information data.

4. Speed-power Analysis

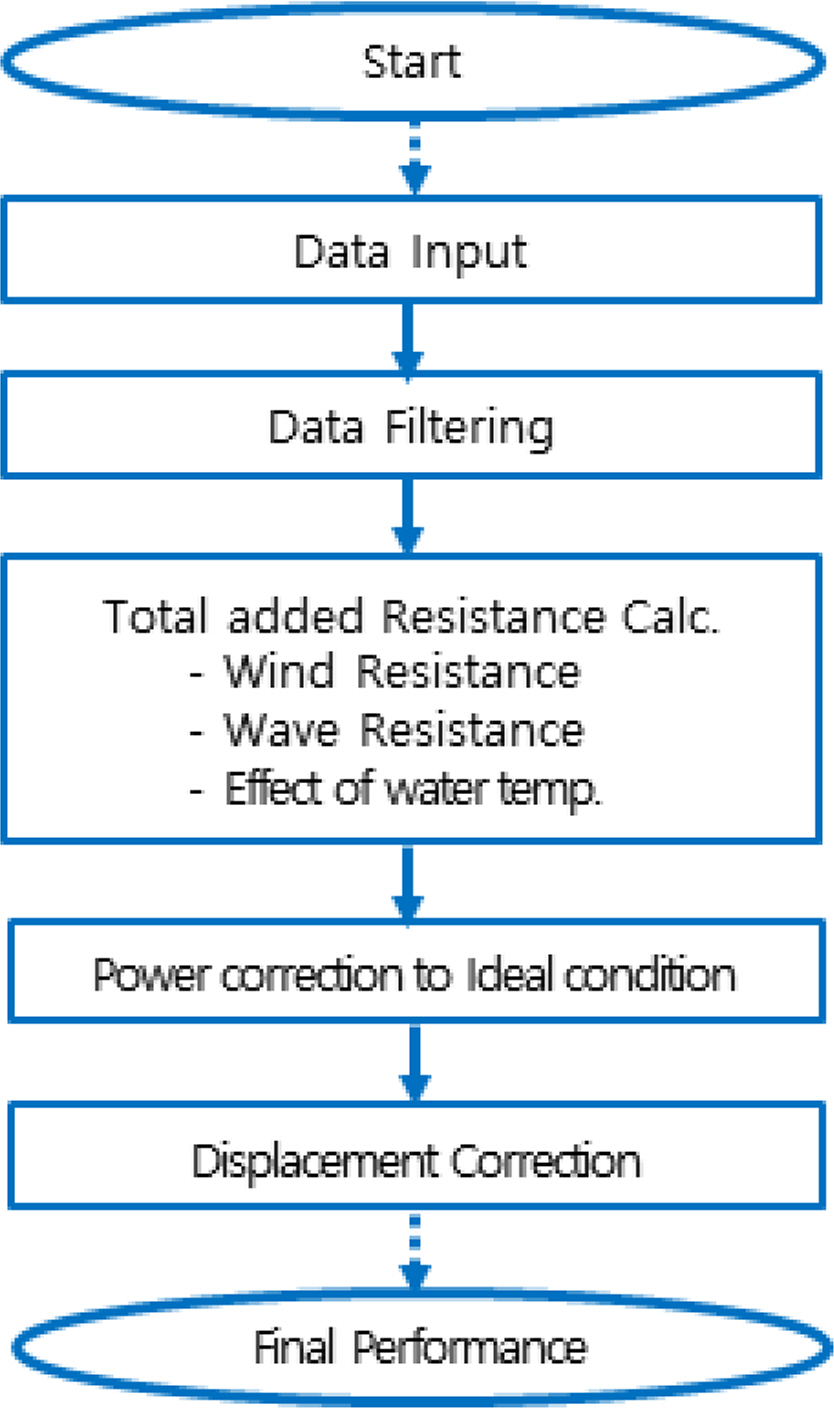
4.1 Speed-power Analysis Procedure

The SPA program was developed for analyzing the powering performance and speed-power performance of the existing ship (Park et al., 2019).
The program analysis procedure is illustrated in Fig. 9. The overall procedure are in conformance with ISO15016:2015, the standard for speed trial data analysis. Although current effect are corrected with more than 3 double runs using GPS speed, since it is not applicable for operating ships, speed through water from speed log is used for the analysis. Furthermore, although ISO15016:2015 requires considering shallow water effect, data only at sufficient depths, outside the shallow water range, was used for the analysis.
The data acquisition interval of the target ship was 2 min, and the standard filtering criteria that determines a normal variation state is shown in Table 4. If measured data variation for 2 min was less than the criteria shown in Table 4, it was determined as a steady state and then analyzed, and all others were filtered out after determining it as unsteady. This steady state criterion is determined by the ship’s size, speed, and marine conditions, and there are no fixed rules. The condition in Table 4 is the criteria valid only for the target ship’s draft, operating speed, and measurement interval. After filtering, approximately 15% of the data remains, from which speed-power curve, the purpose of this study, can be derived well.
The measured data list and the analysis procedure for the speed-power analysis are equivalent to those of Park et al. (2019) and Lee et al. (2019). For the engine power, the measured power (PDms) was obtained using a torque sensor installed on the propeller shaft and rotation speed. Moreover, added resistance due to wind, wave and water temperature difference calculated with data measured or obtained from weather information was used to calculate required power. Lastly, the difference in displacement was corrected to obtain the DHP (PDid) in a calm sea environment in ideal conditions.
As shown in Eq. (1), the added resistance of the operating ship in real sea is the sum of the added resistance due to wind, wave, and the changes in water temperature and density.
(1)
ΔR=RAA+RAW+RAS
The added resistance due to wind is calculated using equation (2). In older version of the standard, ISO15016:2002, air resistance from ship moving forward in the absence of wind was considered as the added resistance, however it is not regarded as the added resistance in ISO15016:2015. There are various methods to obtain the air-resistance factor (CAA); however, the Fujiwara regression formula of the reference ISO (2015), which is known to have the highest accuracy, was mainly used. The comparison with the air-resistance coefficients obtained using CFD simulation (Ryu et al., 2016; Jeon et al., 2017) will be discussed in chapter 4.2, Analysis Result, of this study.
(2)
RAA=12ρACAA(ψWRef)AXVVWRef212ρACAA(0)AXVVG2
The added resistance due to waves is calculated using Eq. (3). After calculating the added resistances from regular waves, these are combined using the JONSWAP (Joint North Sea Wave Atmosphere Program) frequency spectrum to obtain the added resistance in irregular waves. STWAVE-II method was used in this study. (ISO15016:2015).
(3)
RAW=202π0RWAVE(ω,α)ζ2AE(ω,α)dωdα
(4)
RAS=RT0(ρSρS01)RF(CF0CF1)
Added resistance due to changes in water temperature (RAS) is calculated with Eq. (4) with the measured water temperature data, and the total added resistance (ΔR) of Eq. (1) is calculated. After using Eq. (5) is used obtain DHP (PDid) of the ideal condition, Admiral-formula (ISO15016:2015) is used to obtain DHP at displacements in the standard operating condition.
(5)
PDid=12{PDmsΔRVSηDid+(PDmsΔRVSηDid)2+4DmsΔRVSηDidξP}

4.2 Speed-power Analysis

4.2.1 Comparison of the air resistance based on air resistance factor

For speed-power analysis of the existing ship, it is important to perform an accurate estimation of the added resistance in the actual sea environment. To perform an accurate estimation of the air resistance of the container ship, it is crucial to determine the container stowage shape in the previously mentioned TM 12.5 m (Head haul) and TM 13.6 m (Back haul). Mean stowage diagram, which is determined by analyzing the records of the ship operator, is shown in Fig. 10. It was assumed that the height of container stowage in the lateral direction is consistent, and air resistance was calculated using this diagram. Although the container stowage shape of TM 12.5m is somewhat unnatural in the aspect of air resistance, nevertheless it is used for the analysis as it is the actual operation data.
The comparison of the air-resistance coefficients of the Fujiwara regression formula, ITTC (International towing tank conference) from ISO15016:2015 and calculated using CFD (Ryu et al., 2016; Jeon et al., 2017) is shown in a diagram in Fig. 10. Here, the x-axis is the angle from the bow, and the y-axis is the air-resistance coefficient (CAA) from this angle. Overall, the air-resistance factors (CAA) of Fujiwara and ITTC (ISO15016:2015) are similar. Compared with the result of CFD (Ryu et al., 2016; Jeon et al., 2017), the result of TM 12.5 m is observed to be similar but that of TM 13.6 m shows difference near 30° and 150° from the bow. This could be attributed to the effects of container stowage shape and the shape of wheel house.
The 8,600 TEU Container ship, which is the target ship herein, had been operating on the Dubai route from Port Kelang of Malaysia for nine days since September 20, 2016. The TM during the operation was 12.1 m, which corresponds to standard operating conditions of TM 12.5 m listed in Table 2. The wind speed and wind direction measured during the operation are shown in Fig. 11. The absolute wind velocity, which is the actual speed of wind, was less than 10 m/s; however, it can be seen that the measured relative wind velocity was high as it combined the ship’s speed. GPS heading of the ship was in the north-west direction at angle between 250°–320°, and the wind direction was also similar to that of the GPS head. Therefore, it can be seen that the relative wind direction is mostly head wind within an incidence angle of 30°.
The added resistance due to the measured wind is shown in a diagram in Fig. 12. The thin solid lines represent the resistance due to relative winds, and dots represent the air resistance due to the ship moving forward. As shown in Eq. (2), the resistance due to the ship moving forward is to be deducted when calculating the added resistance, this is indicated as negative values. The additional resistance due to wind is shown in thick solid lines and are within the range of approximately 100–200 kN. In predicting the added resistance due to wind, it can be seen that the added resistances calculated with coefficients obtained by the Fujiwara regression in ISO (2015) and CFD in Ryu et al. (2016) show similar trends and no significant difference in values.

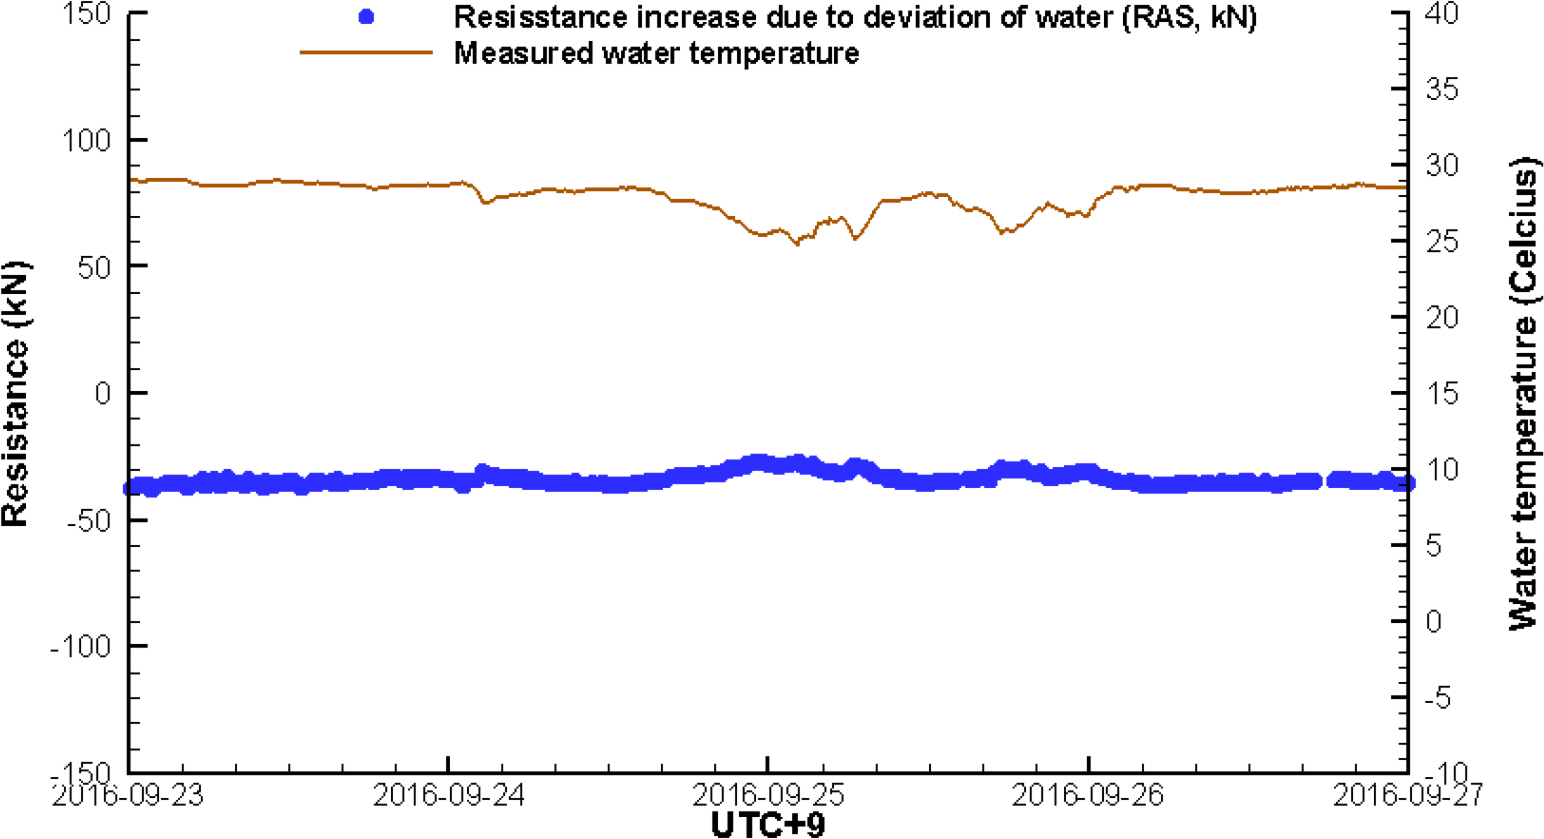
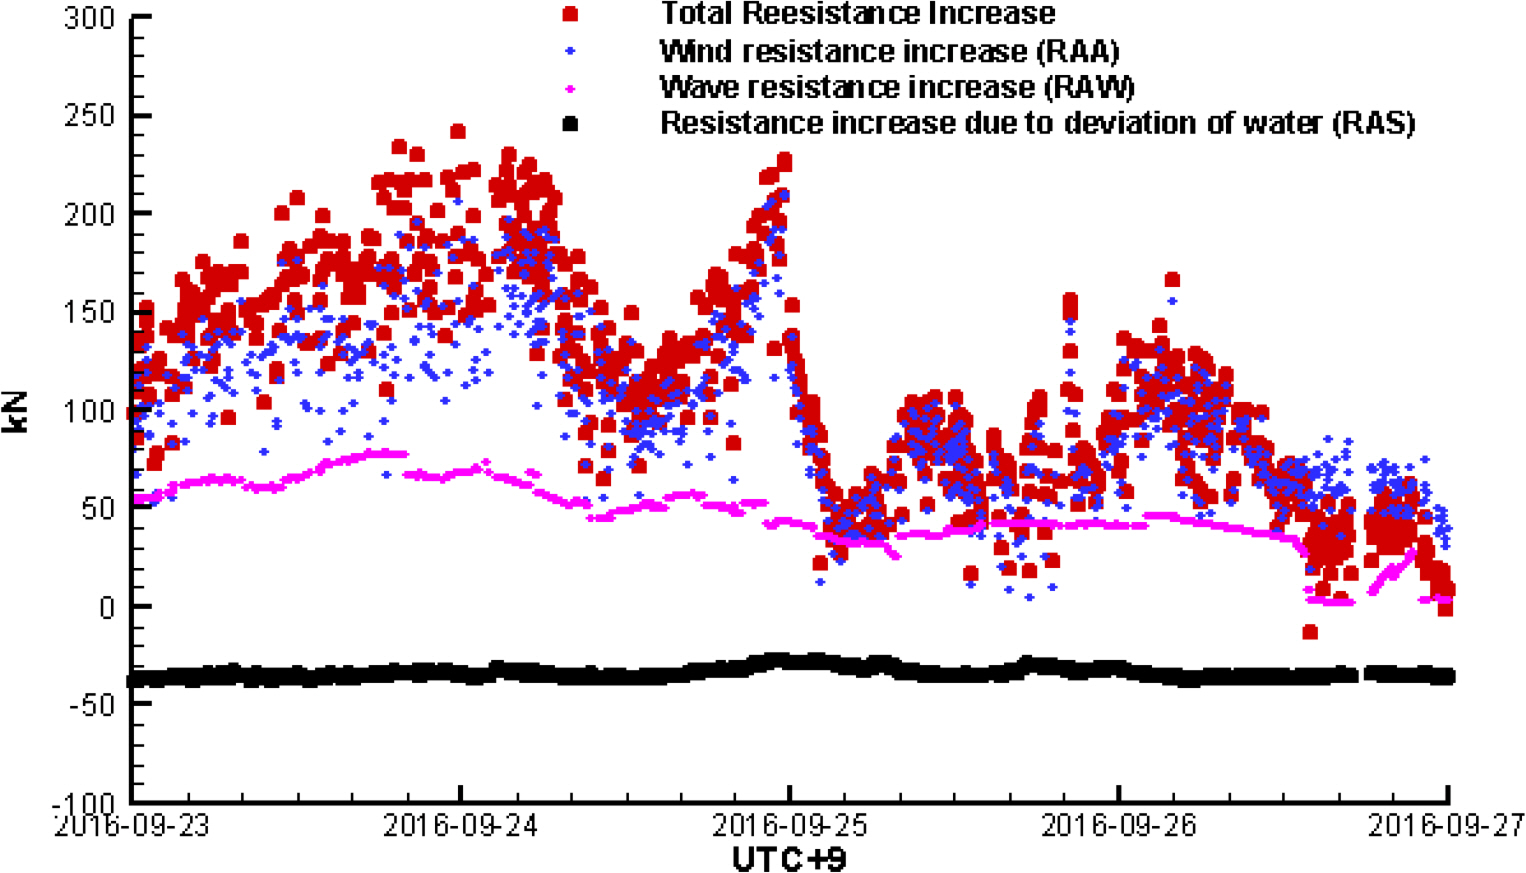
4.2.2 Total added resistance calculation

The wave and added resistances measured in the same period are shown in a diagram in Fig. 13. The weather data was used as the wave-height and wave-direction data. The added resistance due to sea waves and swell are calculated separately. STAWAVE-II was used for the analysis, and this method only considers the waves within 45° from the bow. The swell in this period is less than 1 m of the wave height, and as the direction is greater than 45° from the bow, the added resistance is 0. As shown in Fig. 13, the sea-wave height is within the range of 1.5–2 m. The added resistance due to waves are the sum of added resistance from motion and from reflection waves, and most of the added resistance in Fig. 13 is from reflection waves.
The measured water temperature is shown in Fig. 14. It is in the range of 25°−28°, which is higher than the standard temperature of 15°C, and the correction amount is approximately −40 kN.
Total added resistance and the added resistance due to wind, waves and changes in water temperature are shown in Fig. 15. Wind speed and wind direction were measured by the anemometer, and the Fujiwara regression formula (ISO15016:2015) was used for air resistance coefficients. In addition, waves were analyzed usingSTAWAVE-II of the reference ISO (2015) with the weather forecast data, and water temperatures are measured values.
It can be seen that the most of added resistance is due to wind. This could be attributed to it being relatively fast compared with other types of ships and because the area above the waterline is relatively wide due to container loading.

4.2.3 Speed-power analysis using SPA

Speed-power(Ideal DHP) analysis result considering the total added resistance calculated by Eq. (5) is shown in Fig. 16. The analysis procedure of waves and water temperature is the same, and wind resistance coefficients from Fujiwara regression (ISO15016:2015) and CFD simulation (Ryu et al., 2016; Jeon et al., 2017) are both used.
As previously mentioned, the analysis results in Fig. 16(a) are using operating data in the standard operating condition of TM 12.5 m of Dubai route from Port Kelang of Malaysia for nine days since September 20, 2016 and Fig. 16(b) is that of TM 13.6 m of the same route for nine days since June 11. It can be seen that difference in speed-power analysis results from the difference in air resistance coefficients method in Fig. 10 and from the difference in the added resistance due to wind in Fig. 12, is very small. The results are highly accurate enough not to show difference in the wind resistance coefficients.
For an overall speed-power analysis of the target ship, operation data from 2016 to early 2017 was obtained and analyzed.
The analysis results, which correspond to the standard operating conditions of TM 12.5 m and 13.6 m, are shown in Figs. 1718. The operation routes include China, Taiwan, Hong Kong, Singapore, Malaysia, and the United Arab Emirates.
DHP measured at TM 12.5 m is indicated in Fig. 17(a). It can be seen that measured DHPs are scattered to the extent that it is difficult to identify speed-power characteristics of the existing ship. Fig. 17(b) shows data that are filtered with criteria in Table 4. The operating pattern of using only a few RPM setting is noticeable. In the same RPM setting, when the added resistance increases, speed decreases and DHP increases with torque. A Speed-power analysis results with corrected the DHP is shown in Fig. 17(c) and Fig. 18. It can be seen that there is a difference between the analyzed result and the result of the model test, and this is due to the deterioration of the ship hull. Analysis of wind was performed using the Fujiwara regression formula (ISO15016:2015) with the measured data, the wave was analyzed using STAWAVE-II with weather information data, and with measured water temperature (ISO, 2015).

5. Conclusion

To secure a competitiveness of ship operators for GHG reduction and fuel savings in the ship, accurate analysis of powering performance in the real sea condition and speed-power analysis of the operating ships are important. The effectiveness of measures for improving the efficiency of the currently existing ships pursued by ship operators can be verified only if an accurate resistance propulsion performance is identified.
This study aimed to perform an accurate speed power analysis with SPA program in conformance with the speed trial data analysis method for newly built ships. The results obtained from this study are as follows:
  1. This study attempted to perform speed-power analysis of the currently existing ship by supplementing the operation data monitoring system of ship operators and analyzing the weather forecasting data. Applying the ISO15016:2015 standard, which is used in analyzing the speed trial data of new ships, algorithm and the analysis program SPA were developed. The measured data and analysis result were valid, and the resistance propulsion performance of the currently existing ship were identified.

  2. The added resistance due to wind using air-resistance coefficients based on the Fujiwara regression formula (ISO15016: 2015) and CFD simulation (Ryu et al., 2016; Jeon et al., 2017) were compared. Although there was a small difference in the air-resistance coefficients, both methods provided a sufficient level of accuracy in speed-power analysis. It can be said that both methods estimated the added resistance due to wind with a high accuracy to the extent that differences were hardly noticeable in the result of speed-power analysis.

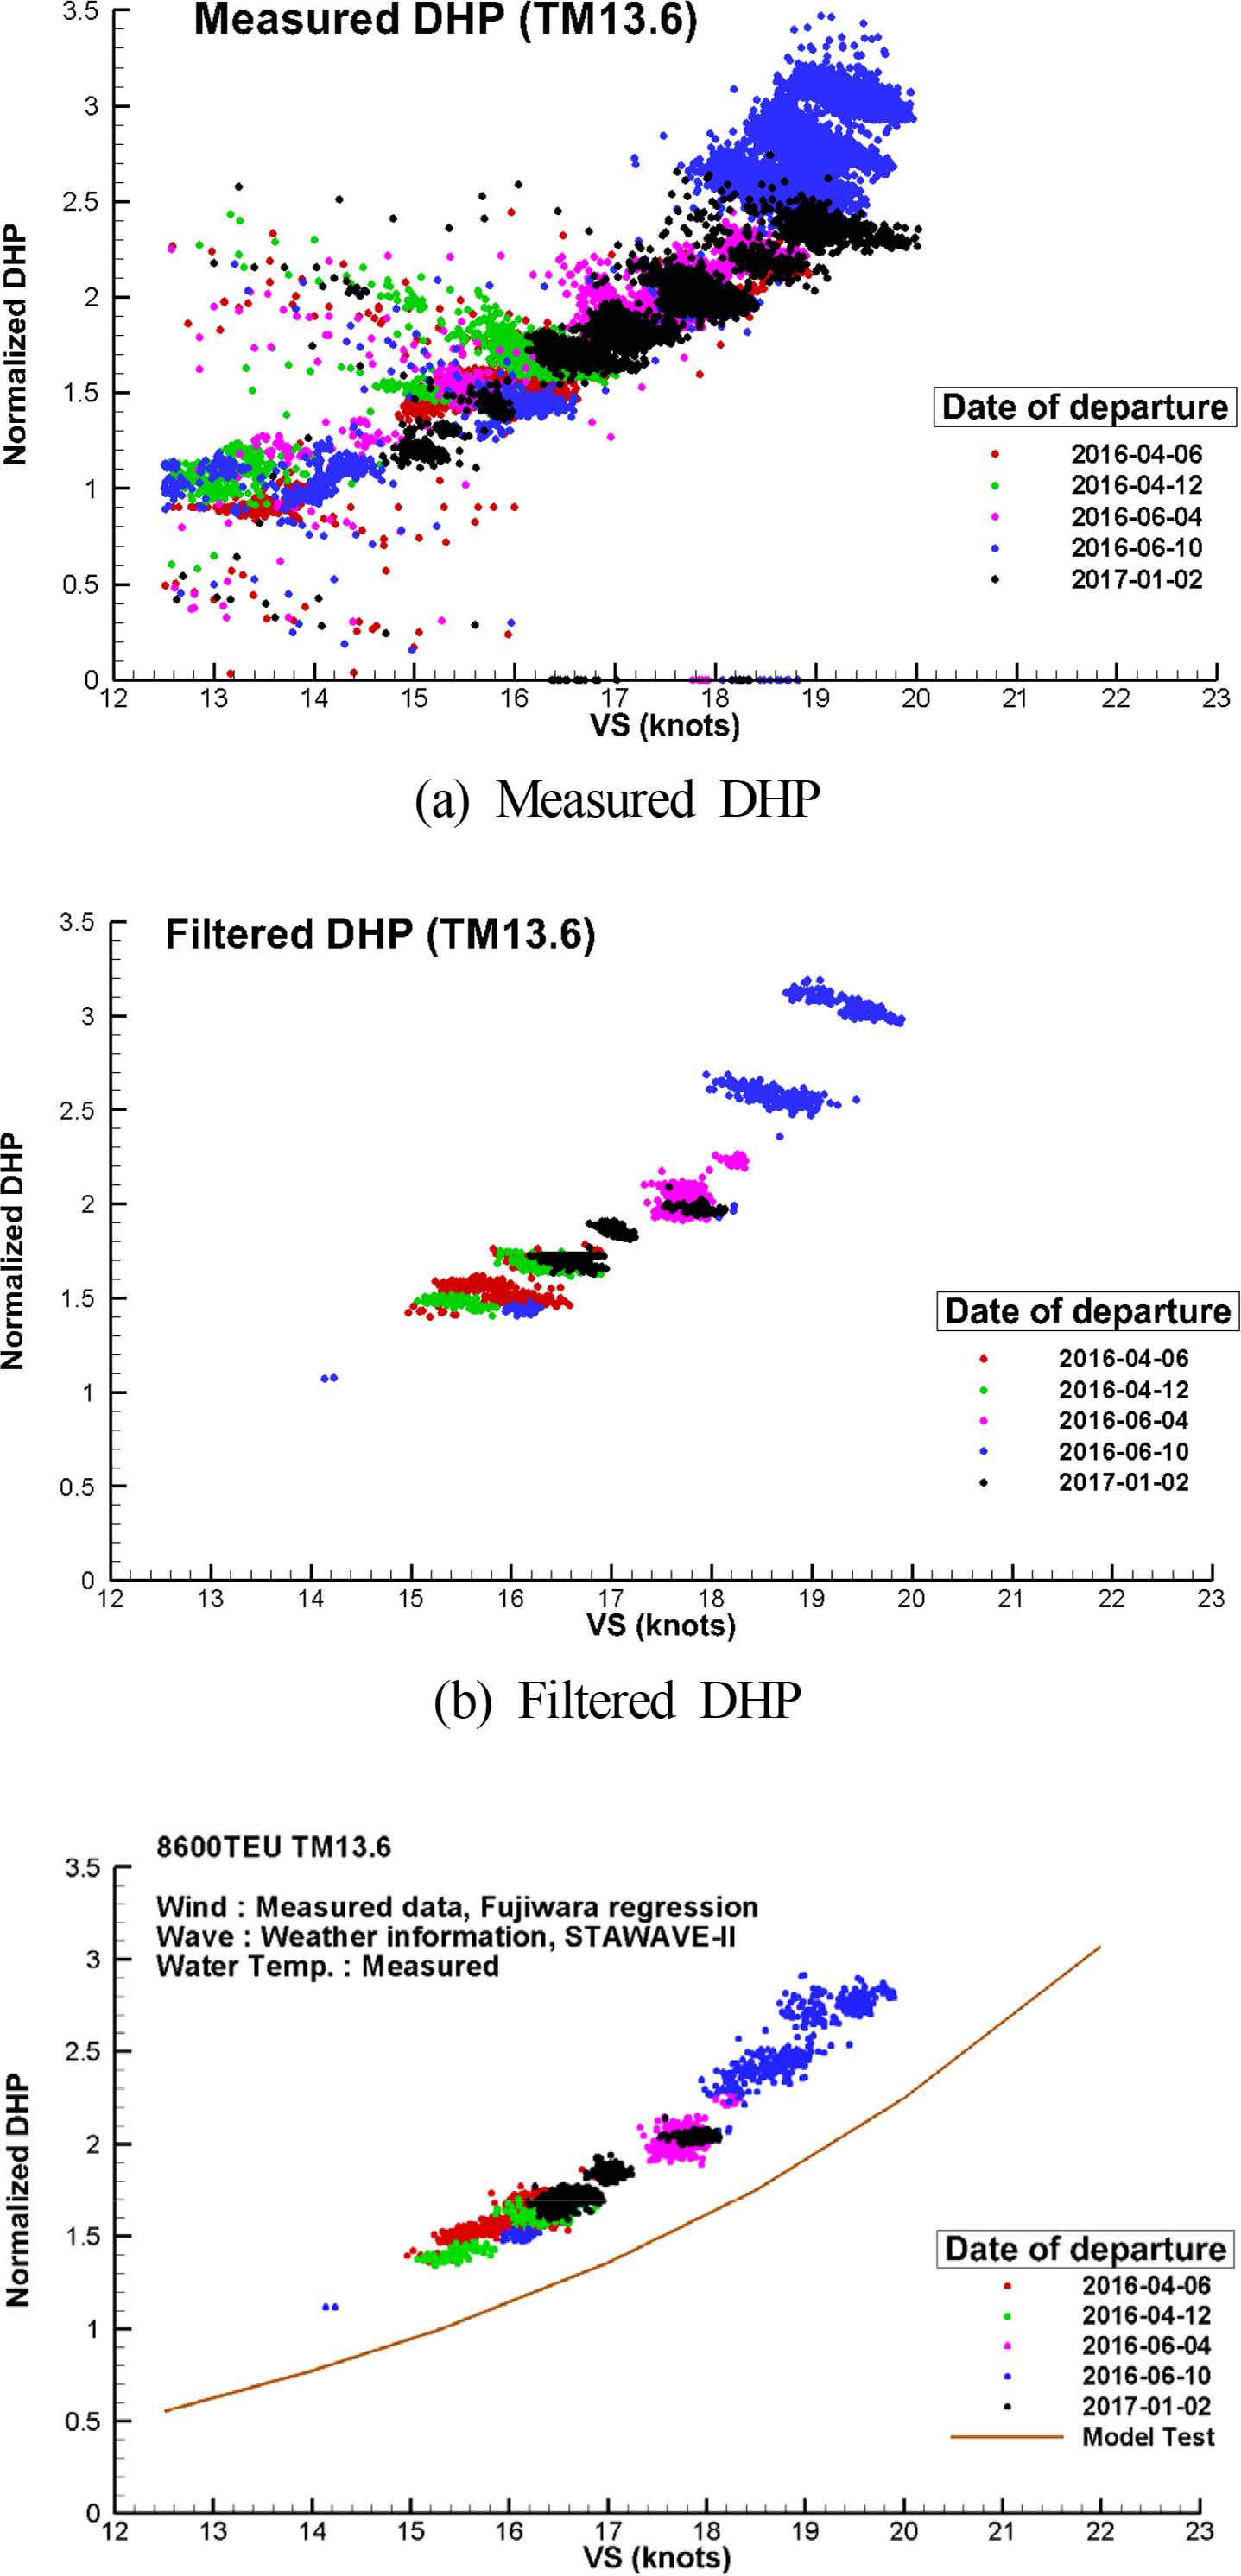
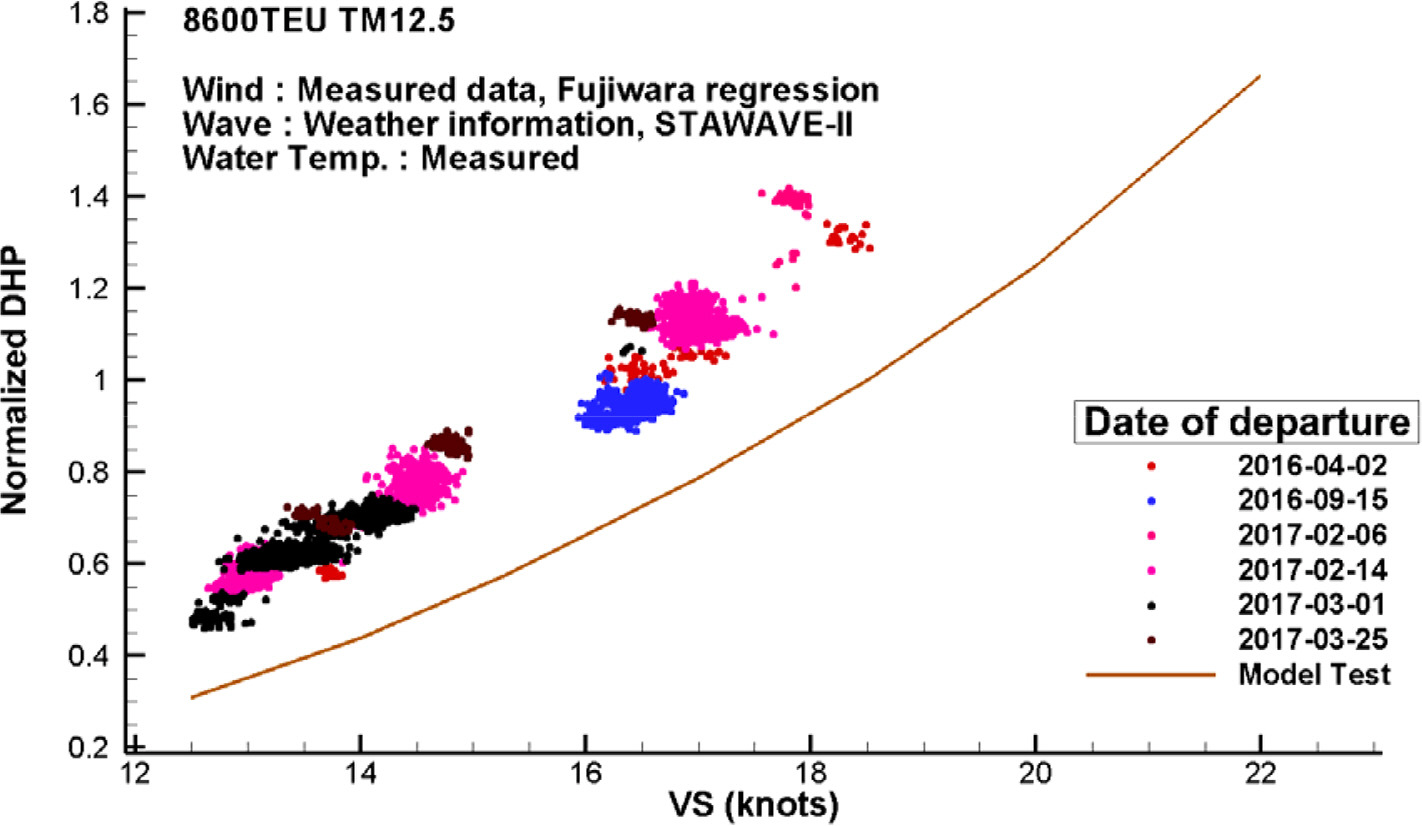
  3. The speed-power analysis results in two draft conditions of the target ship, i.e., 8,600 TEU Container ship, show a satisfactory trend line compared with the result of model test. And they present appropriately the increase in power due to the deterioration of the ship hull in a qualitative manner.

Verification of the effects of hull sanding, painting, propeller cleaning, and retrofitting ESD is possible by applying the technology developed in this study. Future work includes increasing accuracy of the measured data, continuous verification, and development of the analysis methods

Acknowledgements

Authors would like to express their gratitude to Dr. Tae-Il Lee of Hyundai Heavy Industries Co., Ltd. for immensely helping them in procuring and analyzing the data used in this study.
This research was funded by the Ministry of Trade, Industry & Energy (Korea Government), grant number PNS3650, under the project “Optimal hull cleaning and propeller polishing scheduling for minimal ship operating cost using operating performance analysis.”

Fig. 1.
Photograph of the 8,600 TEU container ship
KSOE-2020-047f1.jpg
Fig. 2.
Main route of the 8,600 TEU container ship
KSOE-2020-047f2.jpg
Fig. 3.
Histogram of the draft and deadweight percentile
KSOE-2020-047f3.jpg
Fig. 4.
Photographs of models and propulsion test of the 8,600 TEU container ship (TM 12.5 m)
KSOE-2020-047f4.jpg
Fig. 5.
Self-propulsion model test results of the 8,600 TEU container ship (TM 12.5 m)
KSOE-2020-047f5.jpg
Fig. 6.
Trim variation test results of the 8,600 TEU container ship (TM 12.5 m)
KSOE-2020-047f6.jpg
Fig. 7.
Photographs of energy efficiency monitoring system (EEMS)
KSOE-2020-047f7.jpg
Fig. 8.
Photographs of anemometer
KSOE-2020-047f8.jpg
Fig. 9.
SPA (Speed power analysis) procedure for existing ship based on ISO15016:2015 (Park et al., 2019; Lee et al., 2019)
KSOE-2020-047f9.jpg
Fig. 10.
Mean stowage diagram of the container ship and comparison of air drag coefficients between the Fujiwara regression formula by ISO 15016:2015 and CFD simulation (Ryu et al., 2016; Jeon et al., 2017) results
KSOE-2020-047f10.jpg
Fig. 11.
Time history of the wind velocity and direction at the reference height
KSOE-2020-047f11.jpg
Fig. 12.
Comparison of wind resistances owing to air drag coefficients using the Fujiwara regression formula (ISO15016:2015) and CFD (Ryu et al., 2016) result
KSOE-2020-047f12.jpg
Fig. 13.
Resistance increase owing to sea waves by ISO15016:2015 (STAWAVE-II)
KSOE-2020-047f13.jpg
Fig. 14.
Resistance increase owing to deviation of water and measured water temperature
KSOE-2020-047f14.jpg
Fig. 15.
Total resistance increase
KSOE-2020-047f15.jpg
Fig. 16.
Comparison of the speed-power analysis results in a calm sea environment between the Fujiwara regression formula (ISO15016:2015) and CFD results (Ryu et al., 2016; Jeon et al., 2017) for wind resistance
KSOE-2020-047f16.jpg
Fig. 17.
Measured DHP and speed-power analysis results (TM 13.6 m)
KSOE-2020-047f17.jpg
Fig. 18.
Speed-power analysis results in a calm sea environment (TM 12.5 m)
KSOE-2020-047f18.jpg
Table 1.
Principal dimensions of the 8,600 TEU container ship
Length 339.60 m
Breadth 45.60 m Maximum continuos rating 108,920 kW × 102 r/min
Depth 24.60 m Normal continuos rating 98,030 kW × 98.5 r/min
Designed draft 13.00 m Service speed 27.5 knot (14.1 m/s)
Scantling draft 14.50 m
Table 2.
Standard operating conditions for the speed-power analysis
TM 12.5 (Head haul) TM 13.6 (Back haul)
Length between Perpendiculars, Breadth (m) 322.6, 45.6
Displacement (t) 109,961.5 122,954.4
Volume (m3) 107118.5 119784.0
Wetted surface area (m2) 16125.4 17178.3
Draught aft, Draught forward (m) 12.5, 12.5 13.7, 13.5
TM (m) 12.5 13.6
Reference speed (knots) 18.5 (9.5 m/s) 15.3 (7.9 m/s)
Speed range (knots) 12.5–22 (6.4–1.3 m/s)
Transverse projected area (m2) 1754.6 1704.5
Anemometer height from base line (m) 46.5 45.4
Measurement range of draught TM: 11–13 m TM: 13–15 m
Table 3.
Load variation parameter as per ISO15016:2015 (TM 12.5 m)
VS (knots) ξP
15.3 (7.9 m/s) ‒0.1146
17 (8.7 m/s) ‒0.1149
18.5 (9.5 m/s) ‒0.1126
22 (11.3 m/s) ‒0.1099
Table 4.
Steady state criteria for speed-power analysis (8,600 TEU container ship, 2-min interval between the measured data)
Sea depth Deeper than shallow water criteria by ISO15016:2015
Rudder angle change Less Than 5°
DHP change Less Than 100 kW
Speed change Less Than 0.1 knots (0.051 m/s)
Wave direction Less Than 45°
Difference between GPS and gyro head Less Than 5°

References

Freitas, LD., Silberschmidt, N., Pappas, T., & Connolly, D. (2019). Full-scale Performance Measurement and Analysis of the Silverstream Air Lubrication System. Proceeding of the 4th Hull Performance & Insight Conference. Gubbio, Italy. p 201-210. http://data.hullpic.info/HullPIC2019_gubbio.pdf

ISO. (2015). Ships and Marine Technology – Guidelines for the Assessment of Speed and Power pPrformance by Analysis of Speed Trial Data (ISO15016:2015), International Standardization Organization, Geneva, Switzerland.

IMO. (2014). 2014 Guideline on the Method of Calculation of the Attained Energy Efficiency Design Index (EEDI) for New Ships. Resolution Marine Environment Protection Committee, 245(66), International Maritime Organization, London.

IMO. (2019). Energy Efficiency Improvement Measure for Existing Ships. Marine Environment Protection Committee, 2/7/2, International Maritime Organization, London.

Jeon, GM., Ryu, JH., Park, JC., & Shin, MS. (2017). CFD Simulation of Aerodynamic Effects due to Arrangement of Superstructures of Container Ship. Proceedings of the International Symposium on Marine Engineering (ISME). Tokyo, Japan.

Kim, JG., & Kim, DE. (2016). Comparison of the Speed Trial Results using ISO15016:2015 and Optimization (Tanker, Bulk Carrier). Bulletin of the Naval Architects of Korea, 53(1), 35-38.

Lee, GJ., Shin, MS., Park, BJ., Ki, MS., & Jeon, KH. (2019). Validity Analysis of Speed, Wave Height and Wind Speed for the Operational Performance of Bulk Carrier. Journal of the Korean Society of Marine Engineering, 43(3), 183-196. https://doi.org/10.5916/jkosme.2019.43.3.183
crossref
Lee, TI., An, GS., Ok, YB., & Kim, MU. (2016). Analysis of the Speed Trial and Application of ISO15016:2015 (Container). Bulletin of the Naval Architects of Korea, 53(1), 22-27.

Lim, S., Teo, R., & Sia, TC. (2019). A Digital Business Model for Vessel Performance Monitoring. Proceedings of the 4th Hull Performance & Insight Conference. Gubbio, Italy. p 103-113. http://data.hullpic.info/HullPIC2019_gubbio.pdf

Murrant, A., Kennedy, A., Pallare, R., & Montrose, M. (2019). Effect of Hull and Propeller Cleaning on Propulsion Efficiency of an Offshore Patrol Vessel. Proceedings of the 4th Hull Performance & Insight Conference. Gubbio, Italy. p 272-291. http://data.hullpic.info/HullPIC2019_gubbio.pdf

Park, BJ., Shin, MS., Lee, GJ., & Ki, MS. (2019). A New Method to Analyse the Speed Power Performance of Operating Ships and Its Implementation. Journal of Advanced Marine Engineering and Technology, 43(10), 822-829. https://doi.org/10.5916/jkosme.2019.43.10.822
crossref
Ryu, JH., Jeon, GM., Ock, DK., Park, JC., & Shin, MS. (2016). CFD Simulation of Aerodynamic Drag on Superstructures of Container Ship. Proceedings of Korean Society for Computational Fluids Engineering, 186-187. http://www.dbpia.co.kr/journal/articleDetail?nodeIdNODE07066013

Shin, MS., Park, BJ., Lee, GJ., & Ki, MS. (2016). Revision of the ISO15016 and Analysis Program (i-STAP) for the Analysis of the EEDI Reference Speed. Bulletin of the Naval Architects of Korea, 53(1), 17-21.

Yu, GB., Han, YS., & Gang, DY. (2016). Analysis of the Speed Trial and the Accuracy Validation of ISO15016:2015 (COT, LNGC). Bulletin of the Naval Architects of Korea, 53(1), 28-34.


ABOUT
BROWSE ARTICLES
ARTICLE CATEGORY

Browse all articles >

PUBLICATION ETHICS
FOR CONTRIBUTORS
Editorial Office
President Office BD Rm. 1302, 13 Jungang-daero 180beon-gil, Dong-gu, Busan 48821, Republic of Korea
Tel: +82-51-759-0656    Fax: +82-51-759-0656    E-mail: ksoehj@ksoe.or.kr                

Copyright © 2024 by The Korean Society of Ocean Engineers.

Developed in M2PI

Close layer
prev next