1. Introduction
Certain types of facilities operating offshore need to maintain their position, for which diverse mooring systems are employed, such as single point mooring (SPM), spread mooring, and turret mooring systems (TMSs). TMSs are widely used in relatively harsh environments. The use of a turret allows a vessel to rotate towards a predominant external load to reduce its effective load. However, floaters equipped with a turret might experience a fish-tailing phenomenon in specific conditions, and in severe cases, the motion will worsen.
Since turrets are widely utilized, abundant research has been accomplished, which has mainly been about the yaw behavior or factors related to heading stability. Various causes have been suggested as factors in yaw motion of turret-moored floaters, but the underlying causes still need to be verified. Munipalli et al. (2007) examined the response of the heading under conditions with multiple regular waves and fixed steepness from head sea. They found that large yaw motion occurred for a shorter wave period. Cho et al. (2013) experimented with the yaw motion of a turret-moored floating body in regular waves with fixed wave steepness.
Studies have examined the effect of the distance between the turret and the center of gravity (CG) of a system and the distance between CG and the center of the turret (CT). The maximum yaw angle in regular waves was analyzed, and it was found that when the turret is closer to CG, the yaw motion is larger (Yadav et al., 2007). Sanchez-Mondragon et al. (2018) compared the results of a similar study with different configurations and wave steepness. The configuration and the environmental conditions were varied, and the turret position and the mooring stiffness influenced the specific wave period between 15.0 and 19.0 s.
Kaasen et al. (2017) concluded that the interaction between yaw and sway is most important in their research on the heading control of turret-moored floating production storage and offloading (FPSO), which they performed with a simplified model. Garza-Rios and Bernitsas (1999) presented a mathematical model for the nonlinear dynamics of slow motions in the horizontal plane of a TMS in terms of the equation of motion. They proved that if the friction moment between the turret and the vessel is ignored, the dynamics in the parametric design space for both SPM and TMSs are qualitatively the same.
Mathematical approaches have been used to investigate yaw instability. Pinkster (1979) computed the second-order mean drift force through direct integration of the pressure on the wetted surface. The yaw motion depends on the wave drift force exerted by the first-order body motion and 2nd order low-frequency wave excitation force, which various studies have investigated. Morandini and Wong (2007) outlined a method to estimate the heading of a turret-moored vessel in terms of the relation between the equilibrium heading and stability. Milne et al. (2016) presented a reliable method to estimate the heading of an operating FPSO by combining numerical-based prediction of MetOcean conditions. They indicated that the mean drift force and wind load are dominant in the turret moment. However, these studies considered regular waves from the head sea or used information provided by a particular agency.
In this study, experiments were conducted on an FPSO that will be installed in the Arctic Ocean, where it will experience various wave conditions and incoming wave directions. The parameters related to the turret were used to reproduce the yaw motion. Simulations were done with consideration of the rotational stiffness and rotational damping on the turret, and the results were compared with experimental results.
2. Model Description
A model test of a turret-moored FPSO in deep water conditions was conducted in the wave basin at Changwon National University, Korea. The dimensions of the basin are 19 m (L) × 14 m (B) with an available depth of 1.5 m. With a scale ratio of 133.33, the total volume of the model achieves a 1.00% difference between the measured and target displaced volume (measured: 163,554 m3) for full load conditions. The main parameters of the original FPSO designed by Samsung Heavy Industries and the scale model are summarized in Table 1.
2.1 Coordinate System
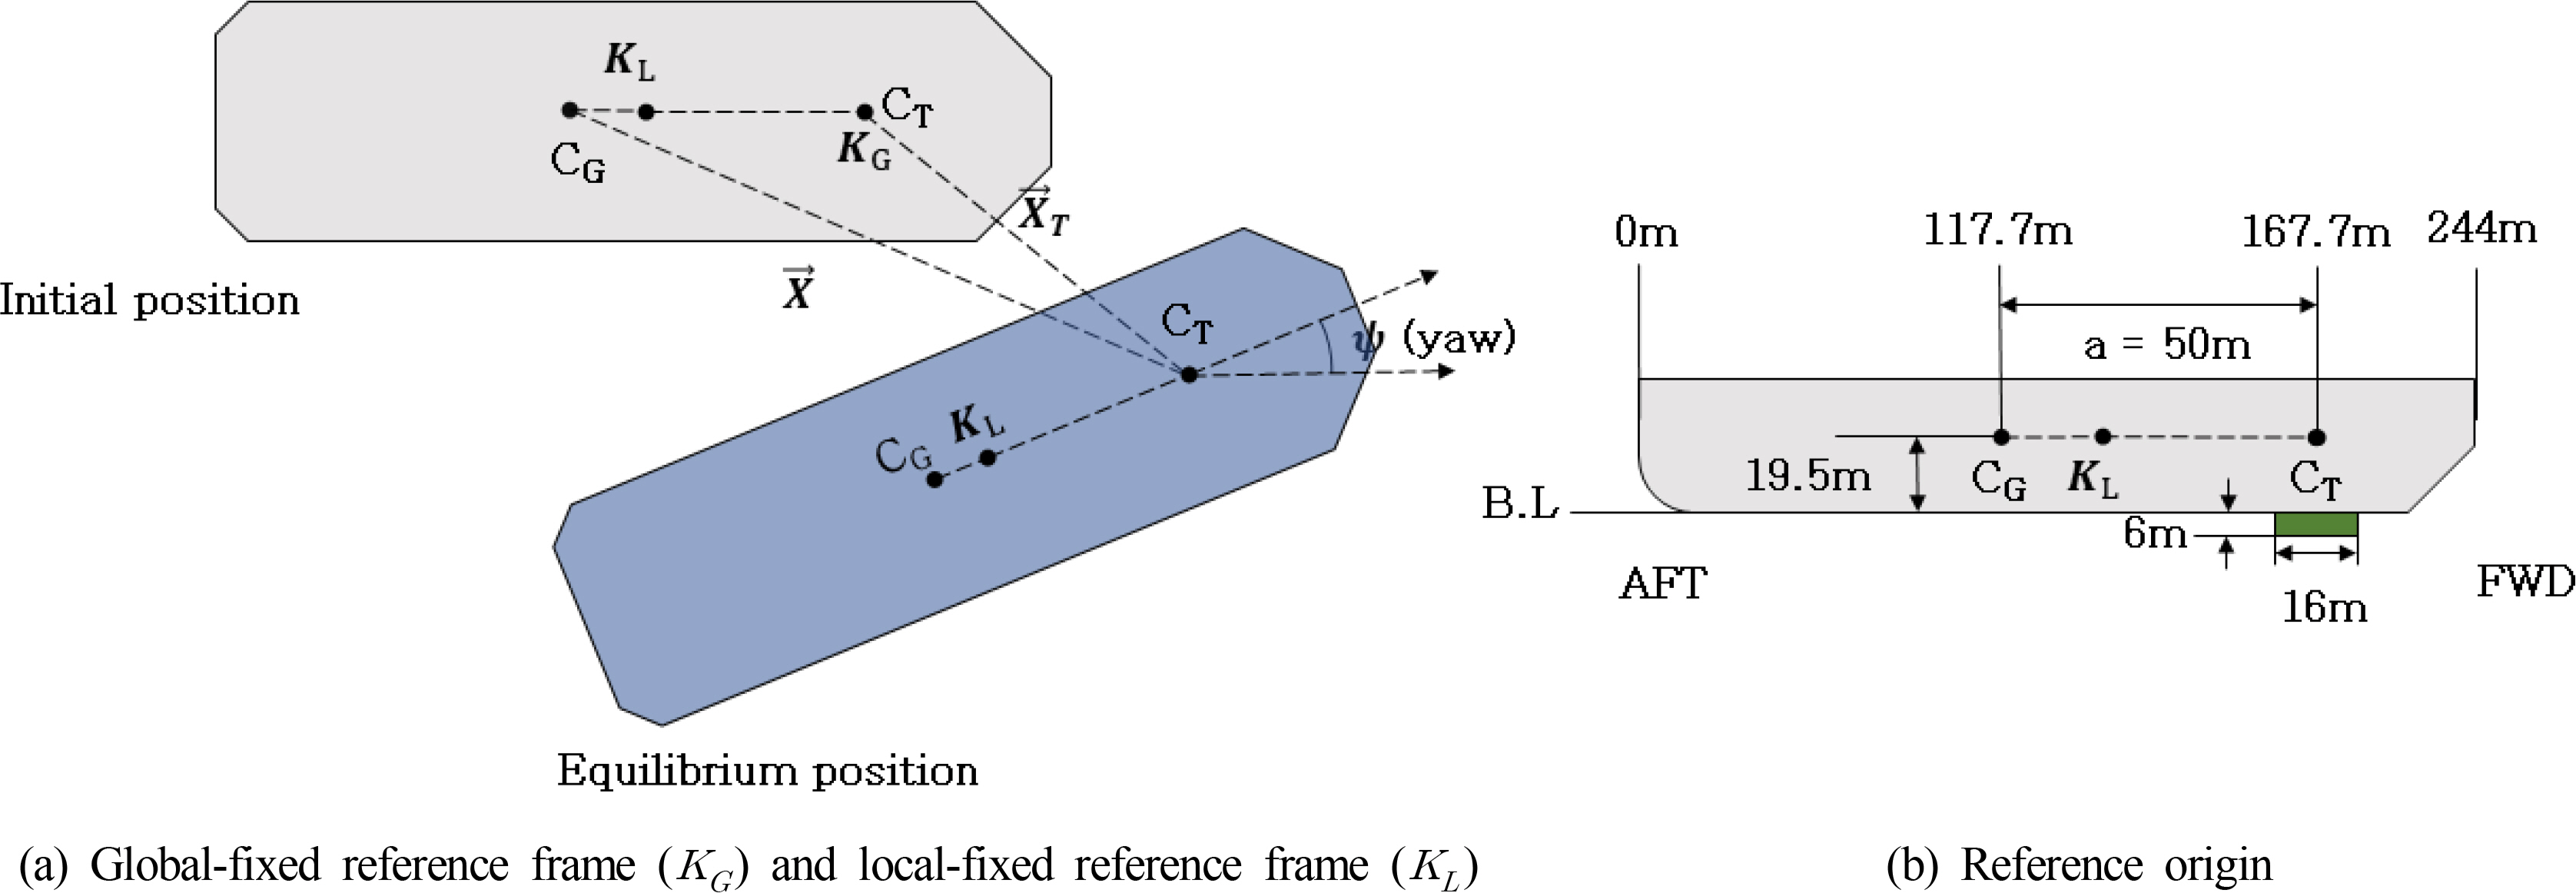
The origin of the global-fixed reference frame (KG) is regarded as CT, and that of the locally fixed reference frame (KL) is regarded as the center of the midship section. When the FPSO rotates with respect to CT, the surge and sway forces and yaw moment are applied to CG. Thus, the movement of CG (X⃗) is described with respect to KG and the turret position (X⃗T), as shown in Fig. 1. X⃗T can be described using Eqs. (1)–(3) (Ragazzo and Tannuri, 2003; Sanchez-Mondragon et al., 2018).
where a is the distance between CG and CT, ψ is the yaw angle, and (T(ψ)) is the attitude matrix of the vessel.
2.2 Turret Mooring Arrangement
To provide a weathervaning function, the model is equipped with an internal turret as a structural component, which allows the vessel to rotate to the equilibrium angle to counteract to the varying environment. The turret is located at 50 m in front of. It has a diameter of 16 m and a projection area of 6 m underneath the baseline. The turret is fixed to the seabed through 16 identical mooring lines, which are composed upper and lower chain segments and middle wire segments. A catenary mooring system was adopted.
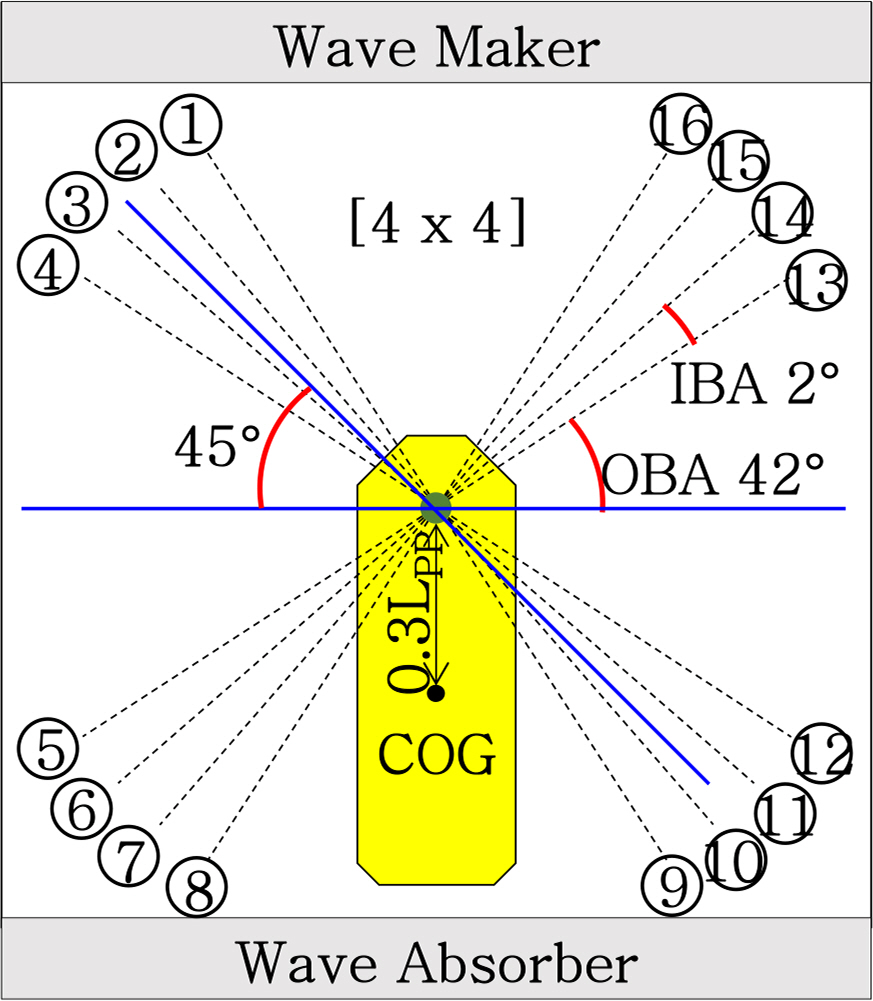
The mooring lines are symmetrically arranged in four groups of four lines, and the lines are 2° away from each other. Each groupis separated by an angle of 42°, as shown in Fig. 2. The properties of each mooring element are shown in Table 2. The designated pretension for all lines is 2,703 kN in loaded conditions.
2.3 Test Conditions
Regular wave sets were tested, and their parameters are summarized in Table 3. The incoming waves were considered as coming from three directions at counterclockwise intervals of 45° from 180°. Head sea, oblique sea, and beam sea were examined, and the incident wave angles were 180°, 225°, and 270°, respectively. The ITTC (2002) recommends analyzing 5 to 20 signals to obtain steady-state results from model tests in regular waves. Therefore, signals were measured for 2,000 seconds using a scale prototype. Various wave directions were not available in the model test, so the model was tested in multiple directions by rotating it.
3. Experiment of Heading Stability
3.1 Experimental Setup
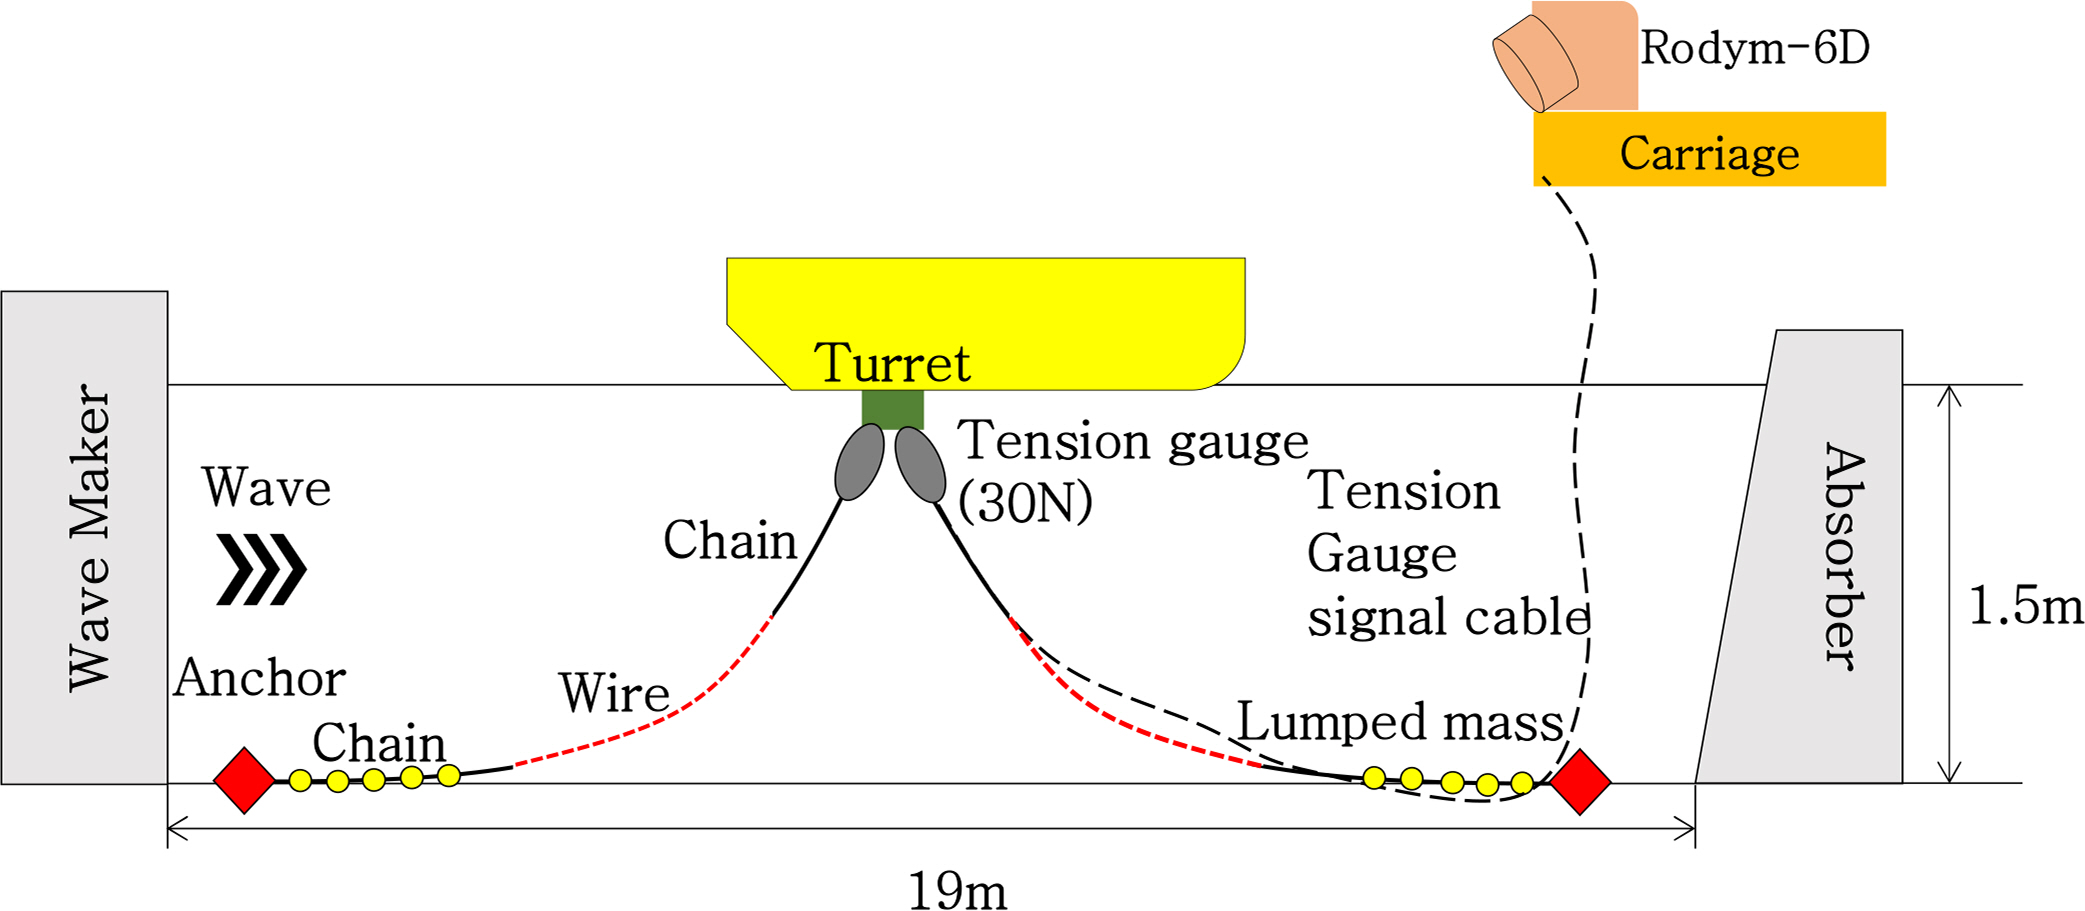
Several instruments were used to measure the motion of the FPSO and the tension of the mooring lines, as illustrated in Fig. 3. To achieve the target wave conditions in Table 3, the wave height at the position where the model would be installed was measured by a wave gauge with 1% tolerance. An optical measuring instrument (RODYM-6D) was used to measure the 6-degree-of-freedom (DOF) motion of the vessel at . Its tolerance is 0.1 mm in this arrangement, which is considered adequate to collect data. The mooring tension on the turret was measured by water-proof load cells, which each have a maximum capacity of 30 N with 1% tolerance. All channels were calibrated.
3.2 Experimental Results
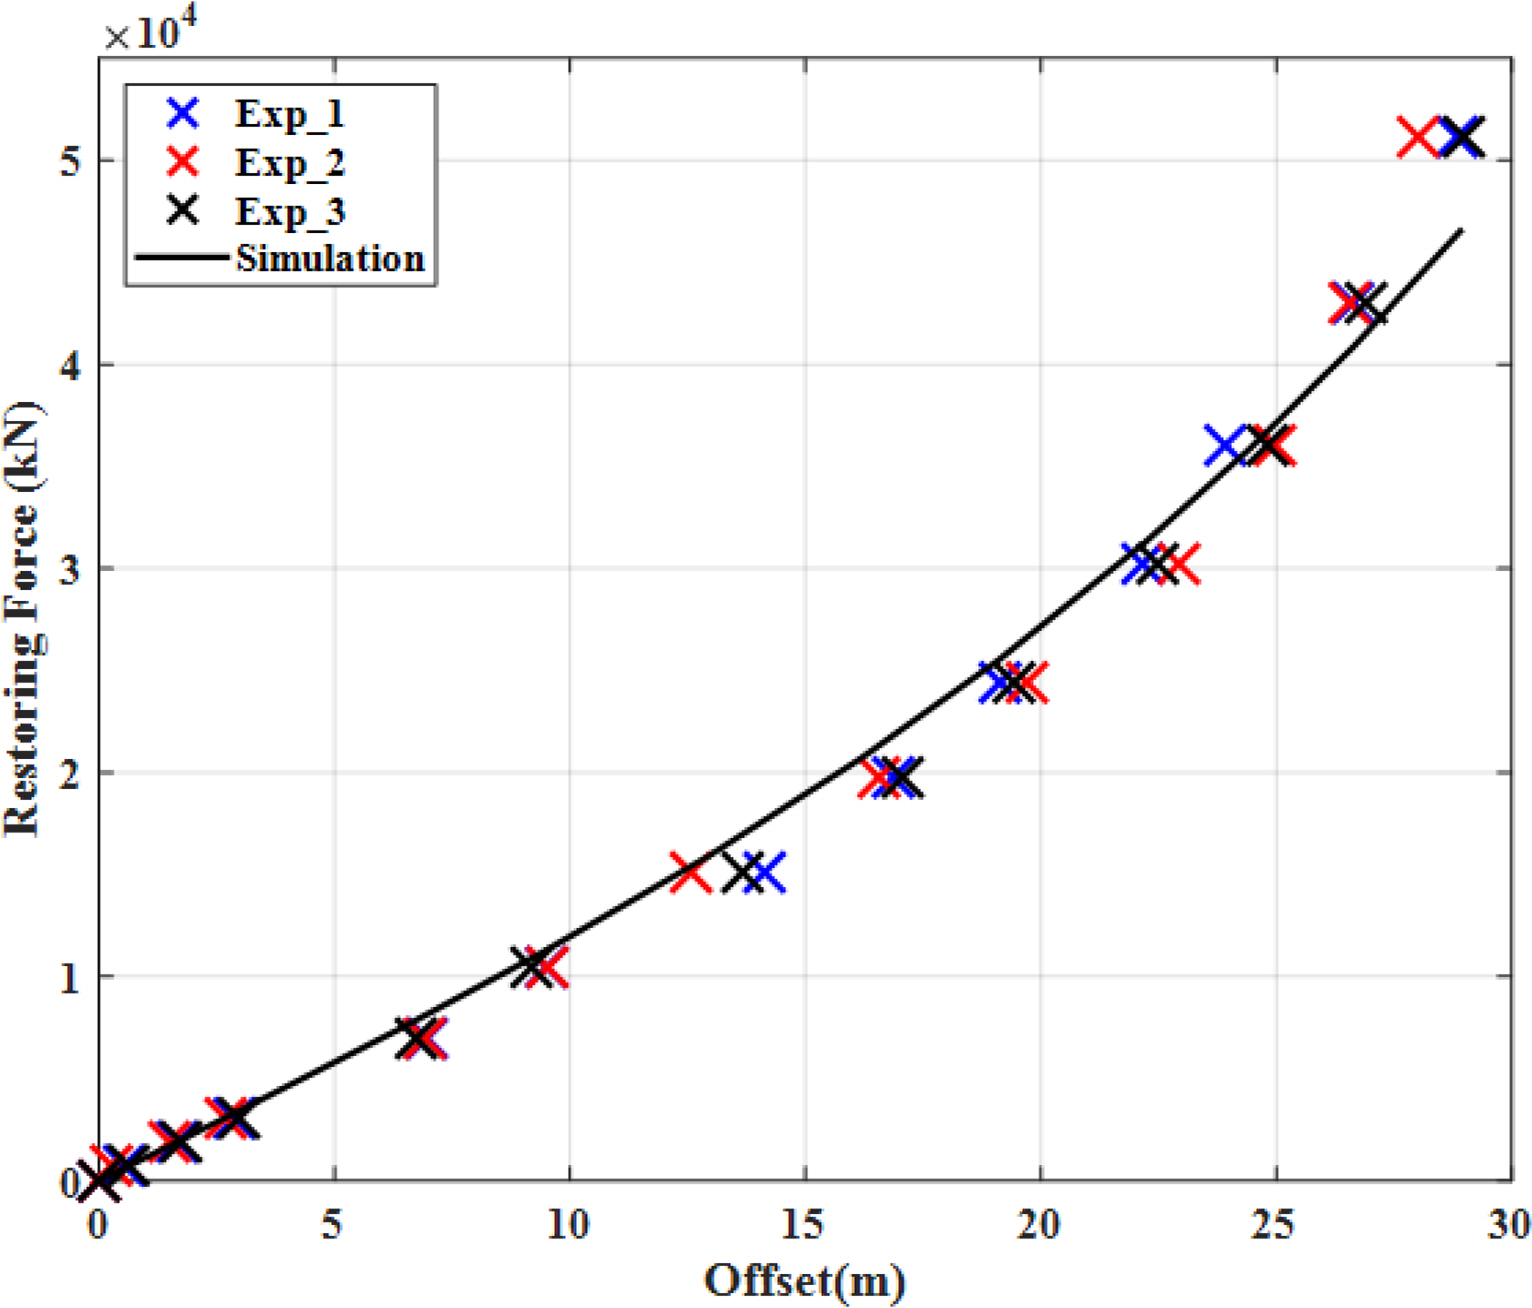
Static analysis was conducted to verify the horizontal restoring-force characteristics of the full-scale prototype. Since the mooring lines were arranged symmetrically, the mooring restoring forces in the surge and sway directions were considered to be the same. A static pull-out test was performed in the surge direction by applying different weights to move the model slowly, and the mooring tension was recorded. The test results were compared to those obtained from Orcaflex 10.3 and are plotted in Fig. 4. Both results match well, so the mooring system was deemed suitable.
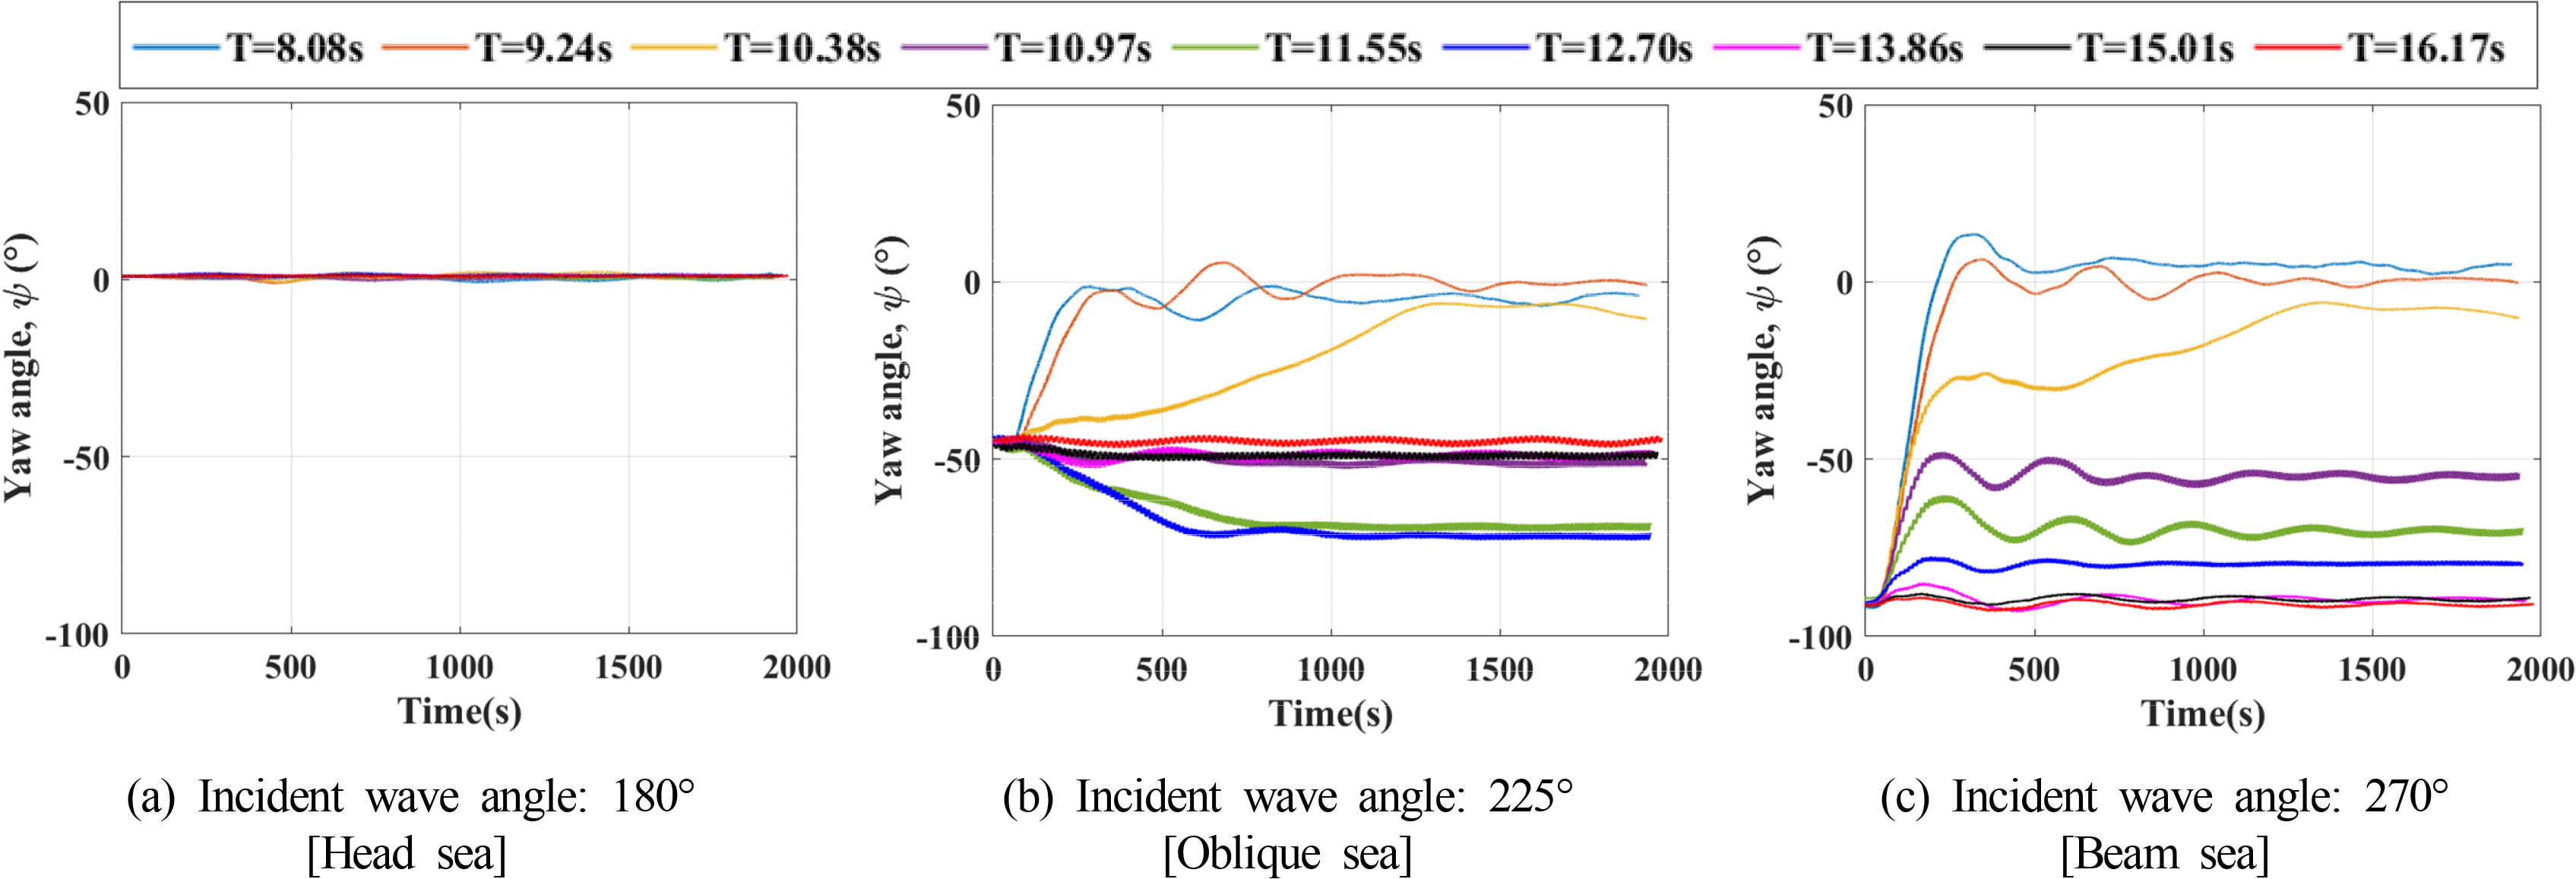
Model tests were performed under several regular wave conditions. Various wave heights were applied in the model test, but in this study, a wave height (H) of 5.33 m was considered. The results of the yaw angle for each period in Table 3 are shown in Fig. 5. The heading angles converged depending on the varying wave periods, and the vessel heading rotated closer to the incoming direction of regular waves, which have relatively short periods in both sea states. Moreover, the equilibrium headings are identical for both oblique sea and the beam sea conditions at the same wave period except for the three longest wave periods.
4. Numerical Analysis
4.1 Hydrodynamic Computation
To obtain the hydrodynamic properties of the model, a numerical analysis was performed using Hydrostar v7.3, which was developed by Bureau Veritas. This software is capable of calculating the first-order and the second-order wave-induced forces and motions on a floating structure. Diffraction and radiation problems are solved based on potential flow theory (Chen, 2009), and the velocity potential is solved by the panel method. The examined FPSO has a box shape (Fig. 6), so there is negligible influence of the hull shape due to the limited analysis range of potential theory, which is limited to below the free surface. For computational efficiency, 3,250 mesh elements were applied, and 40 wave frequencies of .05 to 2.00 rad/s were used with 36 headings at 10-degree intervals from 0 to 360°. To validate the results, the displaced volume was compared, and it had a 0.11% difference from the prototype results, so it is regarded as suitable for further analysis.
The wave drift force is a second-order load acting on the vessel subject to the waves. It is important for the horizontal motion of the vessel as the force occurs in a region of relatively low frequency. The second-order wave drift force can be estimated from the first-order QTF matrix using a middle-field formulation presented by Chen (2007). In the new middle-field formulation, the second-order wave loads are obtained by applying two variants of Stokes’s theorem and Gauss’s theorem to the near-field formulation. The shape of the bow and stern near the free surface is not quite wall-sided, the middle-field formulation was selected to calculate the second-order wave load.
4.2 Heading Stability Analysis with the Vessel’s Hydrodynamic Characteristics
Orcaflex 10.3 was used to analyze the heading stability of the turret-moored FPSO. The reference system in Orcaflex consists of a global-fixed frame of reference, in which the centers of the turret and local fixed frame of reference are located at the center of gravity (Fig. 1) (Orcina, 2018). The FPSO motion was modeled with 6 DOF, and the wave frequency (WF) excitation forces were obtained from the results of Hydrostar v7.3. Newman’s approximation was chosen for wave drift QTFs at the draft. The equilibrium position of mooring lines was computed based on the catenary method.
The vessel can rotate independently of the turret, so the turret was modeled with limited rotation in only the z-direction, and a mooring line was attached to the turret edge. The build-up period was set to twice the wave period, and the dynamic calculation period was set to 2,000 s. Static analysis was not performed so that the vessel response to the changing incident wave directions could be monitored.
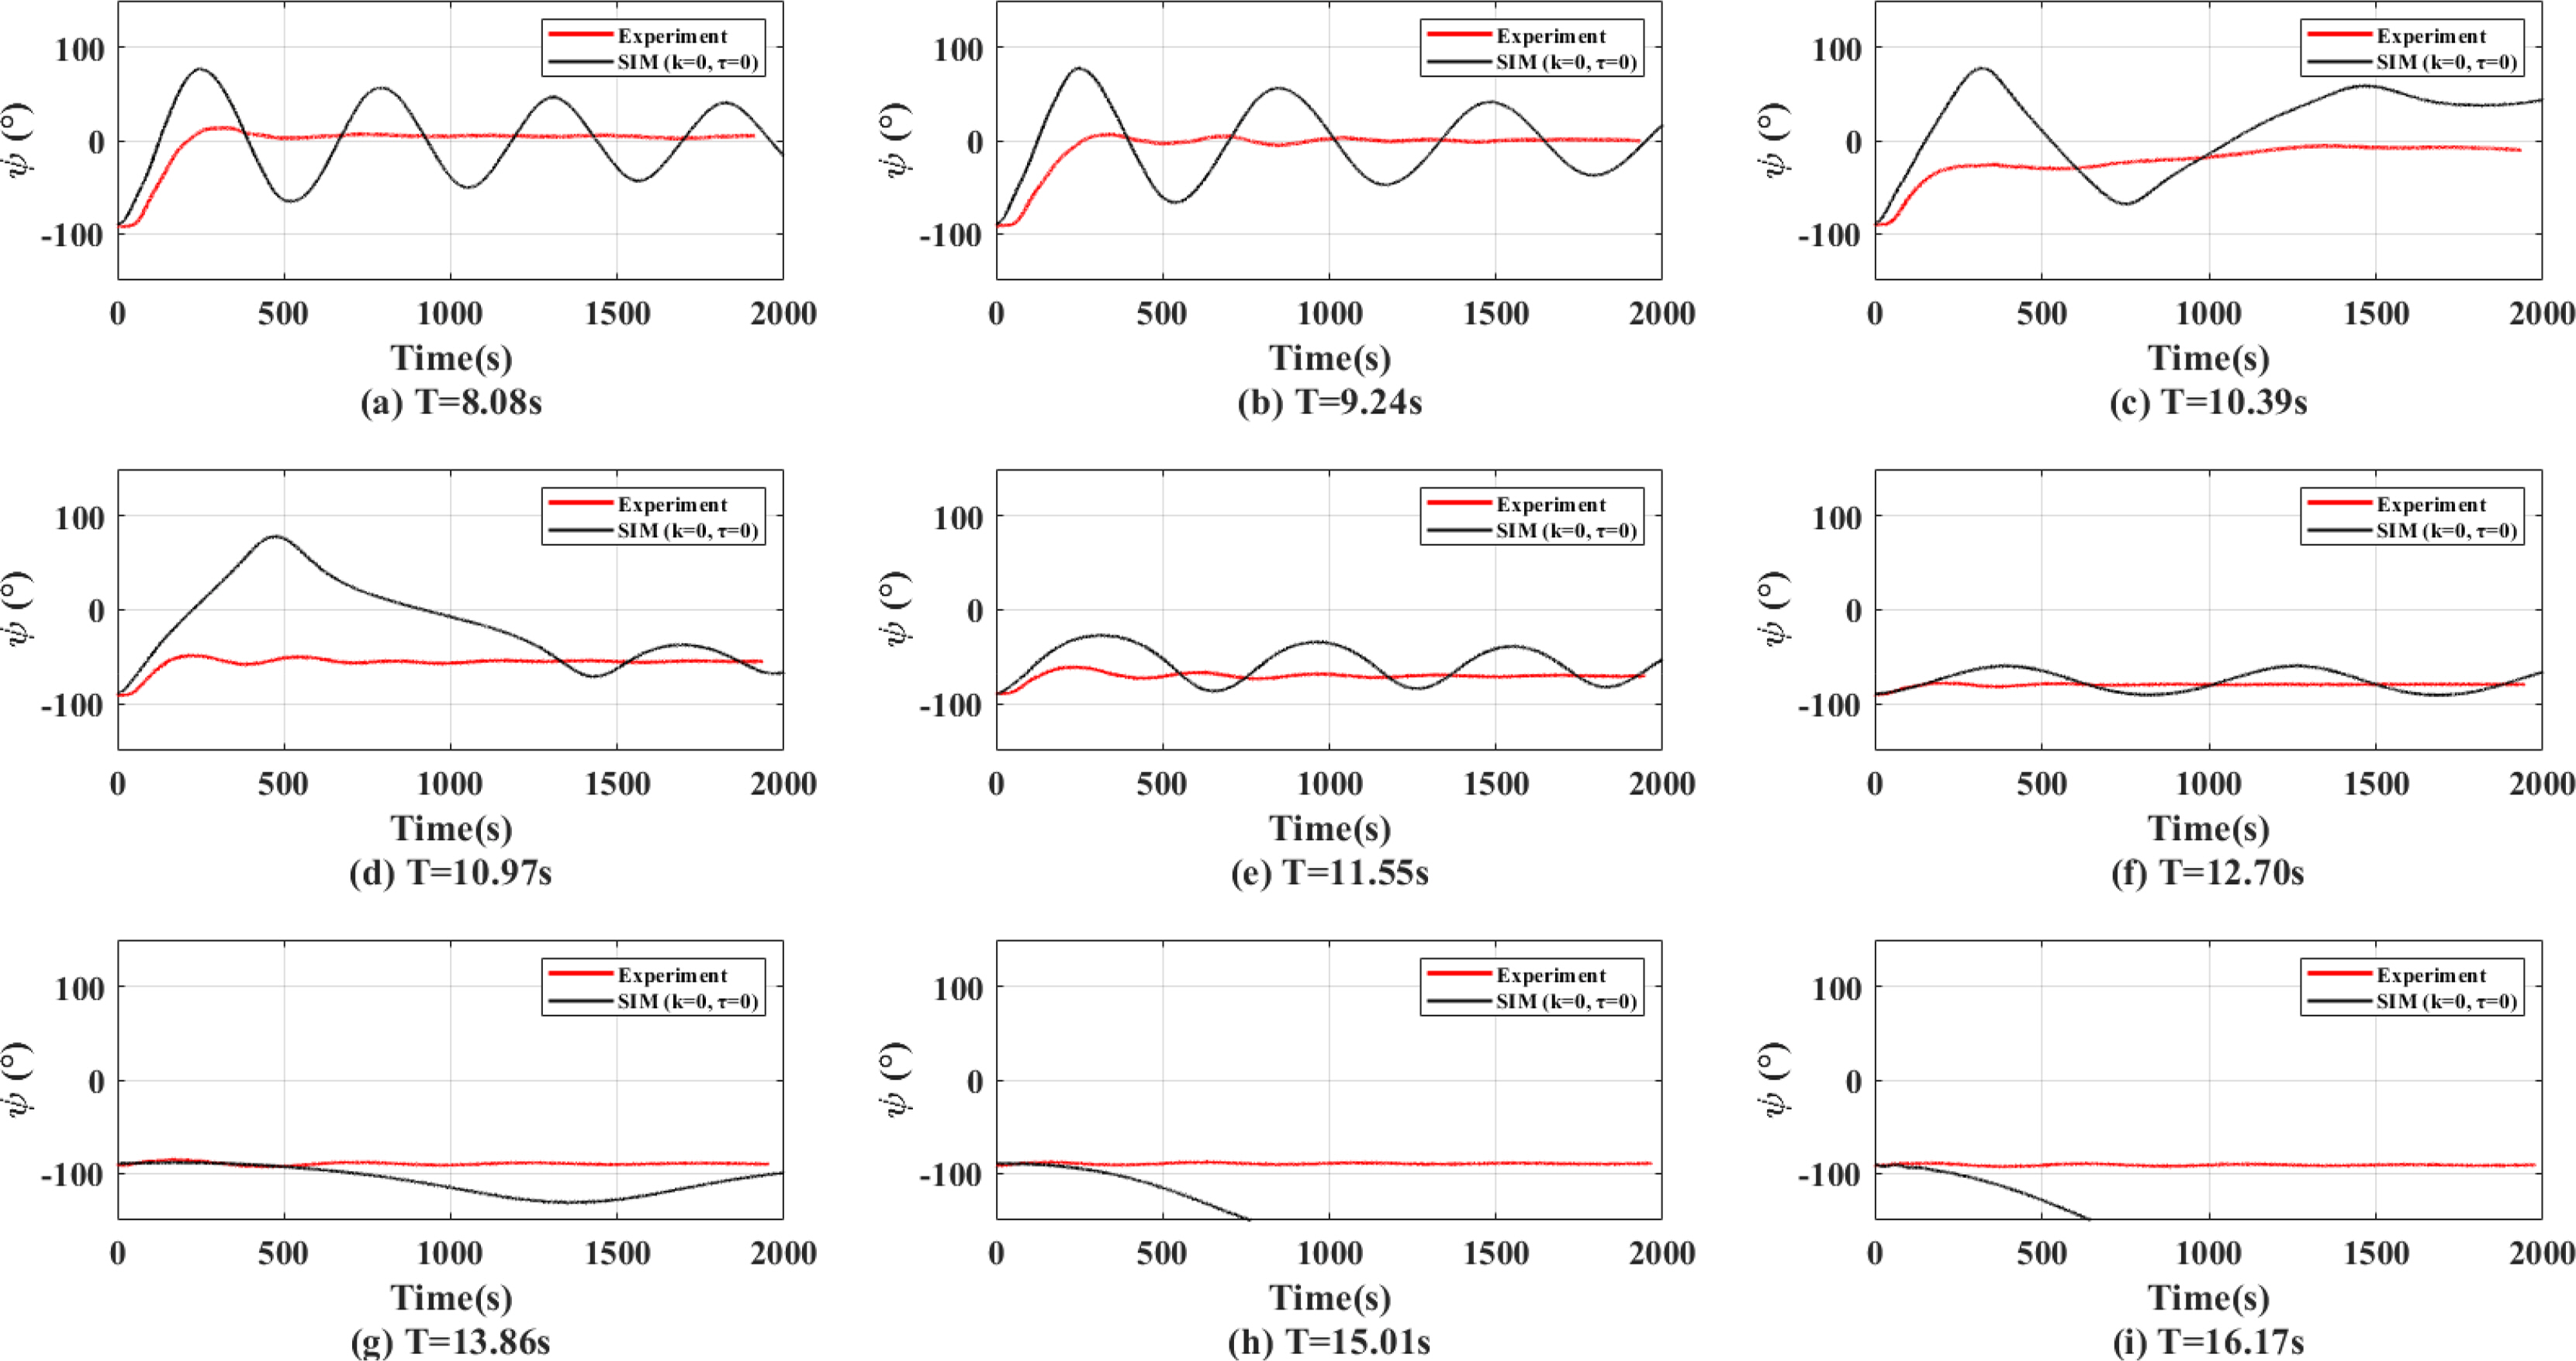
Only the hydrodynamic properties of the FPSO acquired from Hydrostar v7.3 were considered, which means that none the parameters were applied to the turret. Figs. 7,–9 show the yaw angles in the head sea, oblique sea, and beam sea conditions with the regular wave conditions specified in Table 3. The results show that Orcaflex might require an additional parameter, such as the turret’s rotational stiffness or damping, which is related to the rotational velocity.
4.3 Relative Motion of the Turret and Vessel
A parametric study was conducted to examine the dependency of the parameters on the heading stability in regular waves (RW02). The parameter settings are shown in Table 4. The linear damping coefficient in the surge (B11), sway (B22), and yaw (B66) directions was calculated based on the recommendations of BV NR-493 (Bureau Veritas, 2015). To minimize the effect of roll on the yaw motion (Lugni et al., 2015), the linear roll damping coefficient (B44) was considered based on the result of a free decay test, which was obtained using the relative decrement method. The rotational stiffness (k) and rotational damping (τ) were alternately applied in the range of 0 to 1.00E07.
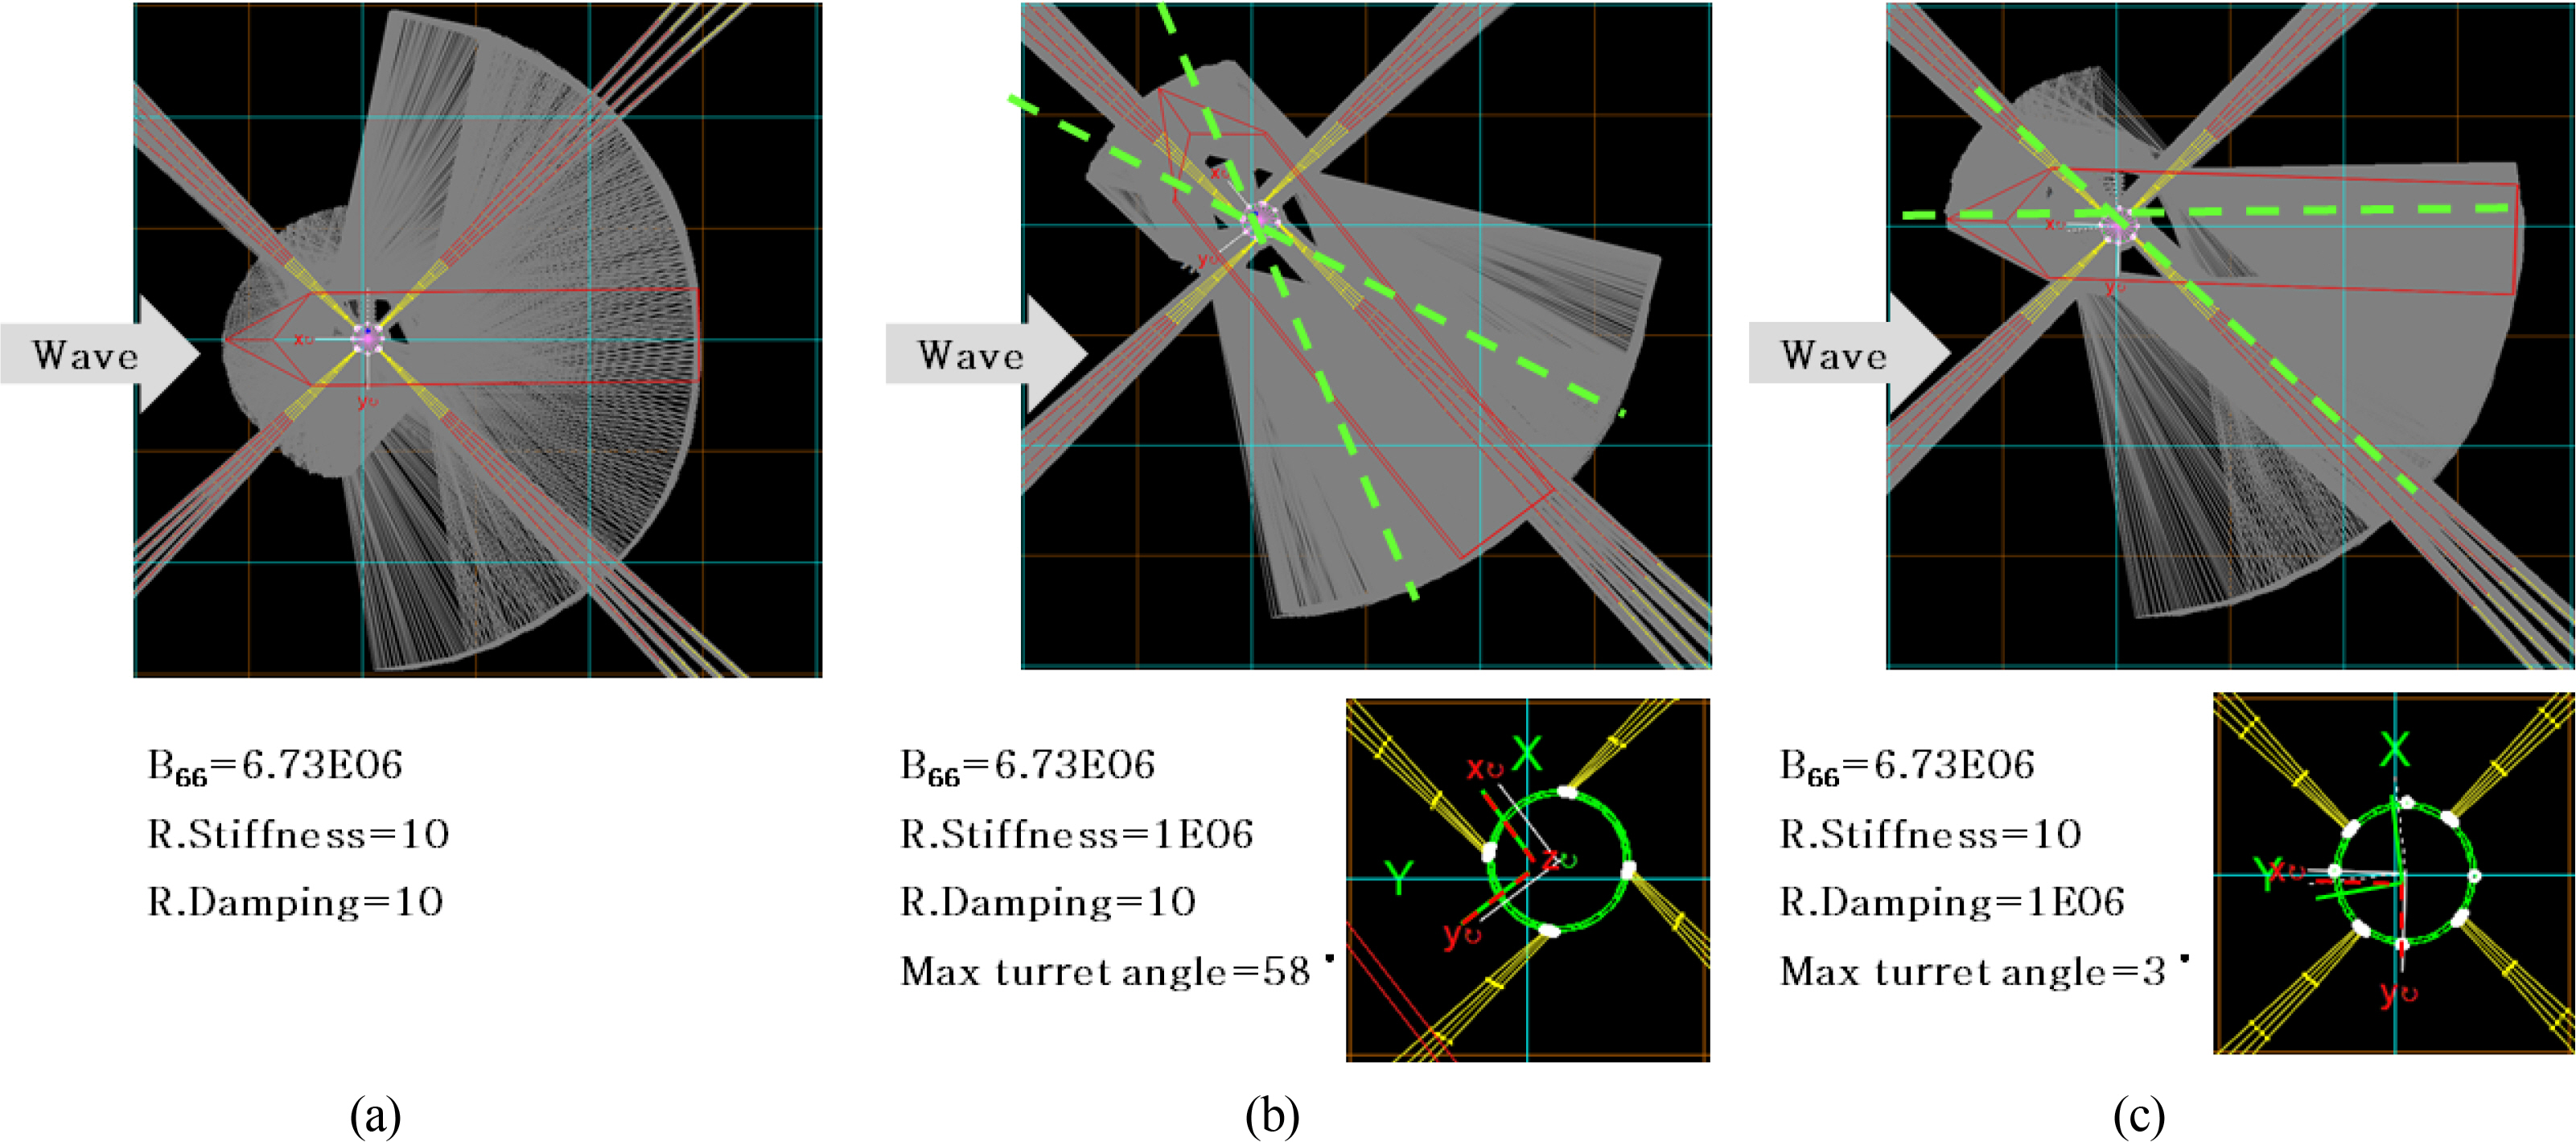
The maximum turret angle in beam sea conditions varied with the rotational stiffness (see Fig. 10). When the turret’s rotational stiffness was high (1E06 kN·m/deg), the turret rotated up to 58° with the vessel. On the other hand, the turret’s maximum rotation was 3° when the turret rotational stiffness was 10 kN·m/deg. Caille et al. (2014) estimated the turret release angle as 3.7°. Since the turret’s rotational stiffness is relatively small, the result can be considered reliable. For Fig. 10(b), a smaller turret rotational damping of 10 kN·m·s/deg was applied. The results fluctuate evenly, and the converged heading does not face the incident wave direction. However, in the case in Fig. 10(c), the damping was 1E06 kN.m.s/deg, and the heading converges with a skewed fish-tailing phenomenon toward the incident wave direction.
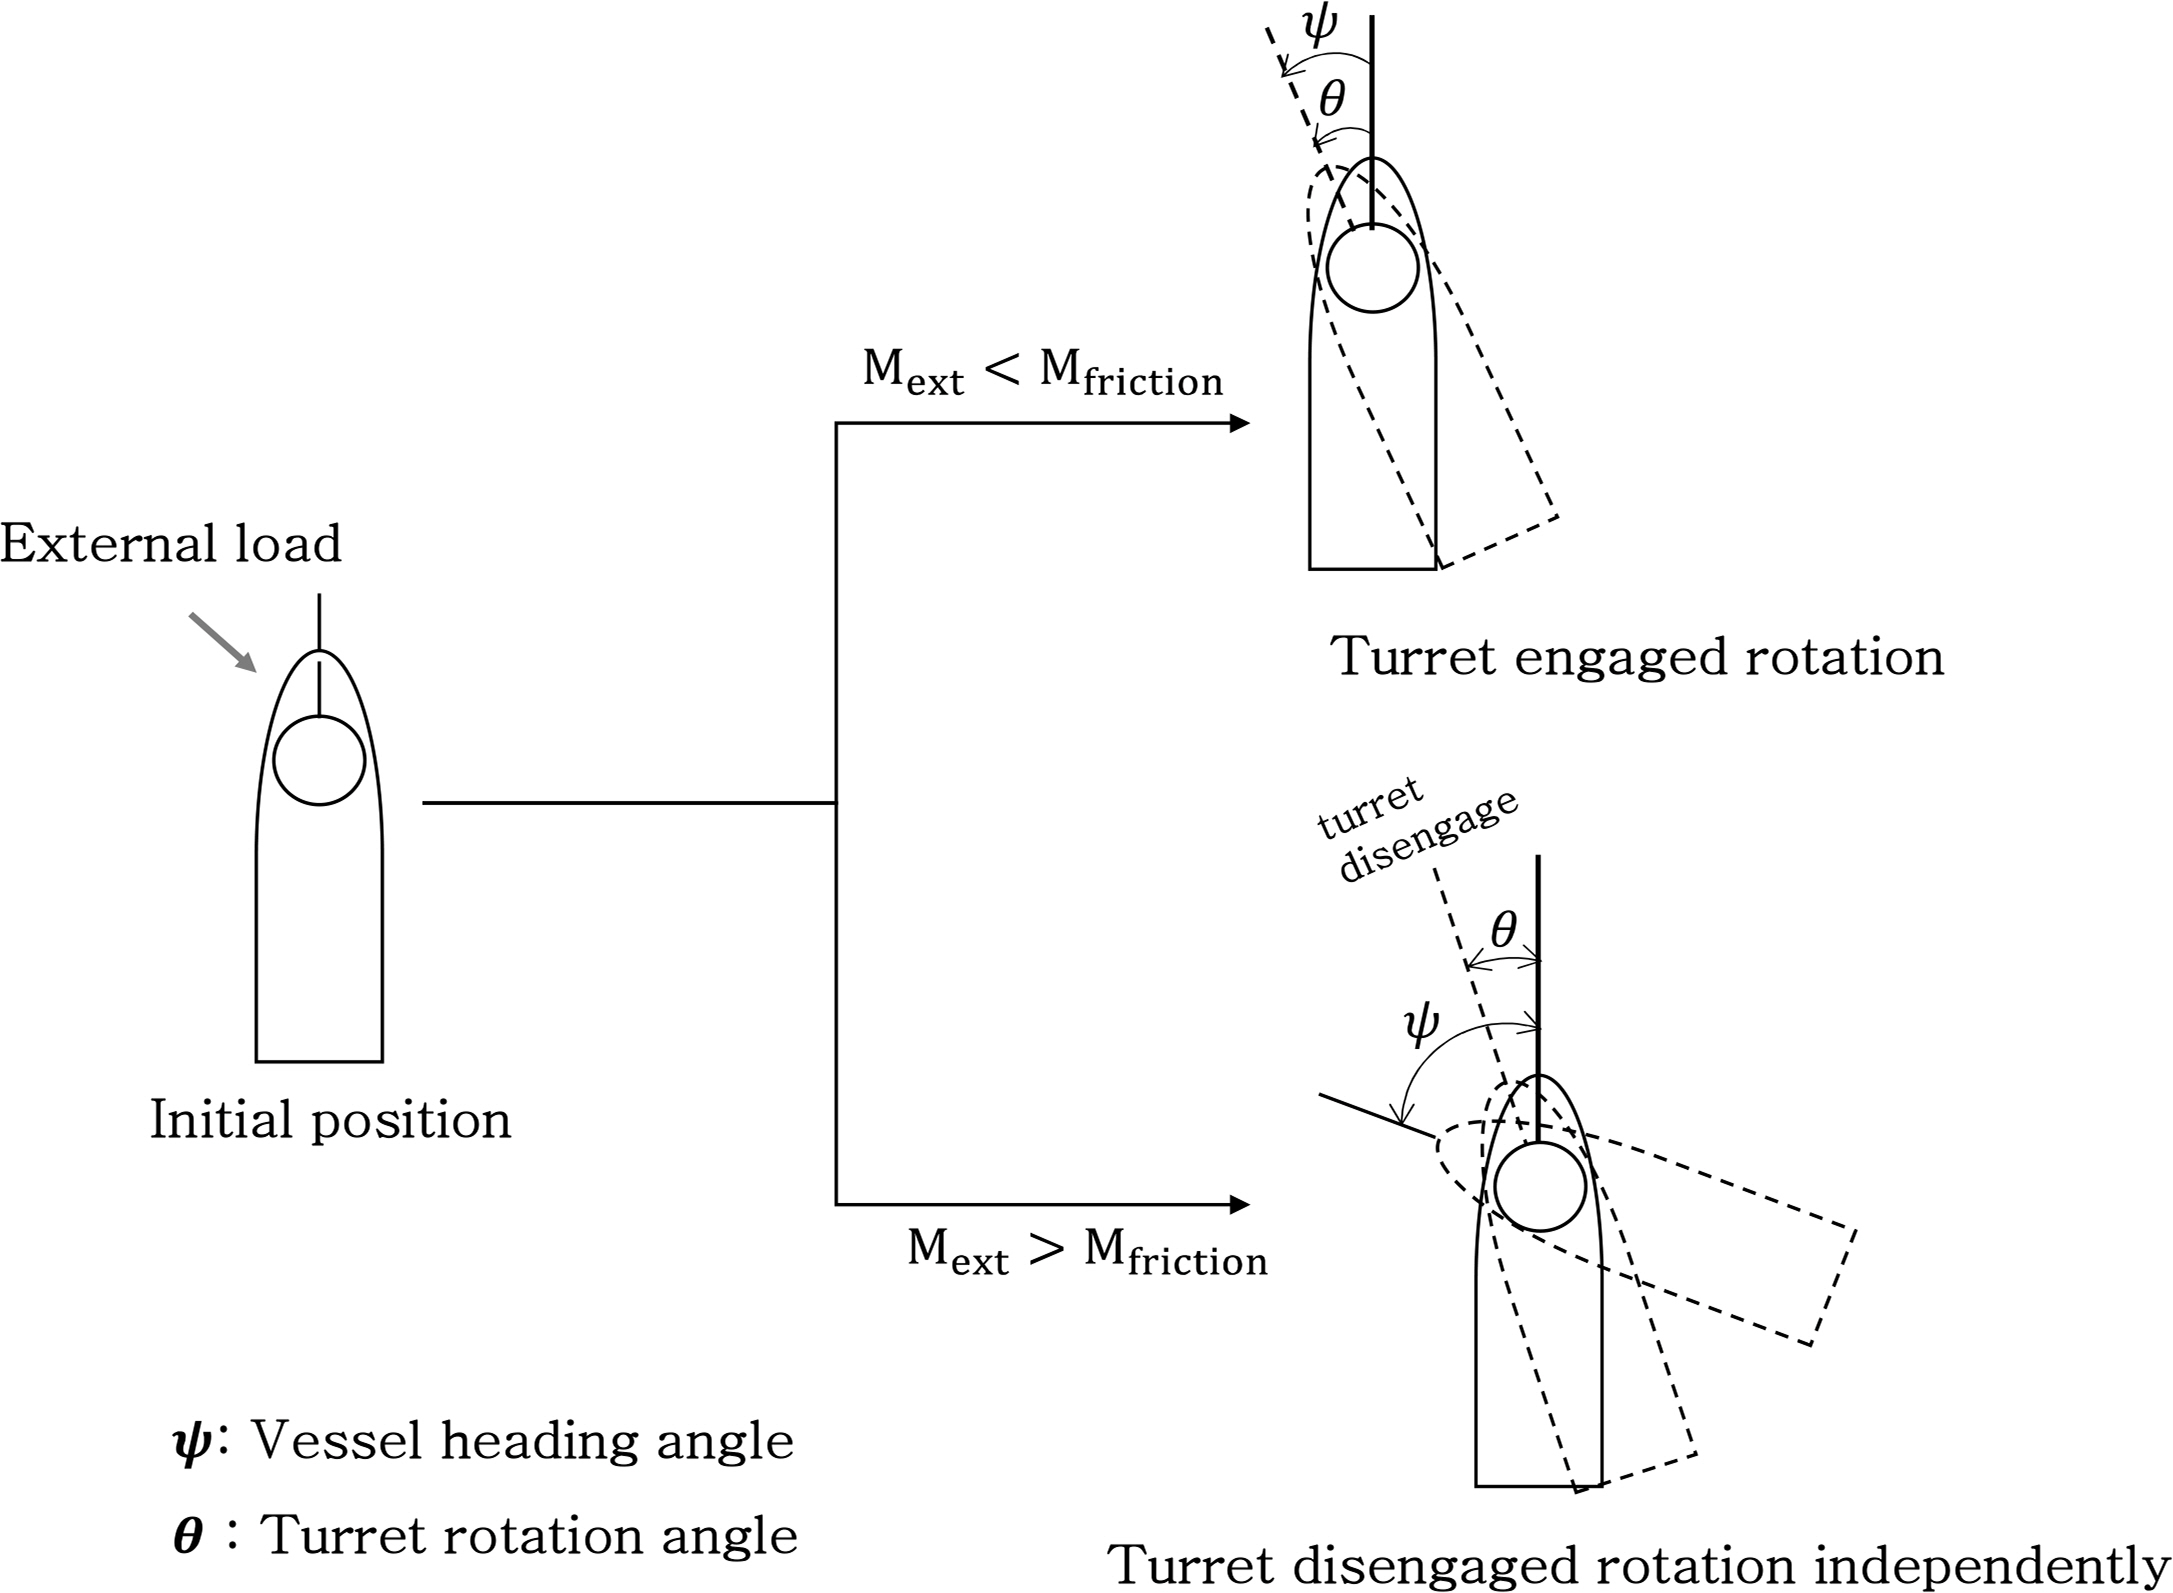
Based on the results of the parametric study, Fig. 11 illustrates the relationship between the turret and vessel when the vessel rotates under the influence of external forces. When the environmental load increases, the vessel rotates with the turret until the moment on vessel due to the external load (Mext) becomes greater than the moment due to friction (Mfriction) on the contact surface between the vessel and turret. As the external load increases, the turret is released from the vessel and then both rotate independently. The vessel rotates toward the predominant environmental load, while the turret rotates until the difference between moments caused by the external force and the moment generated by the distortion of mooring line (Caille et al., 2014).
5. Estimation of Turret Parameters
5.1 Rotational Stiffness
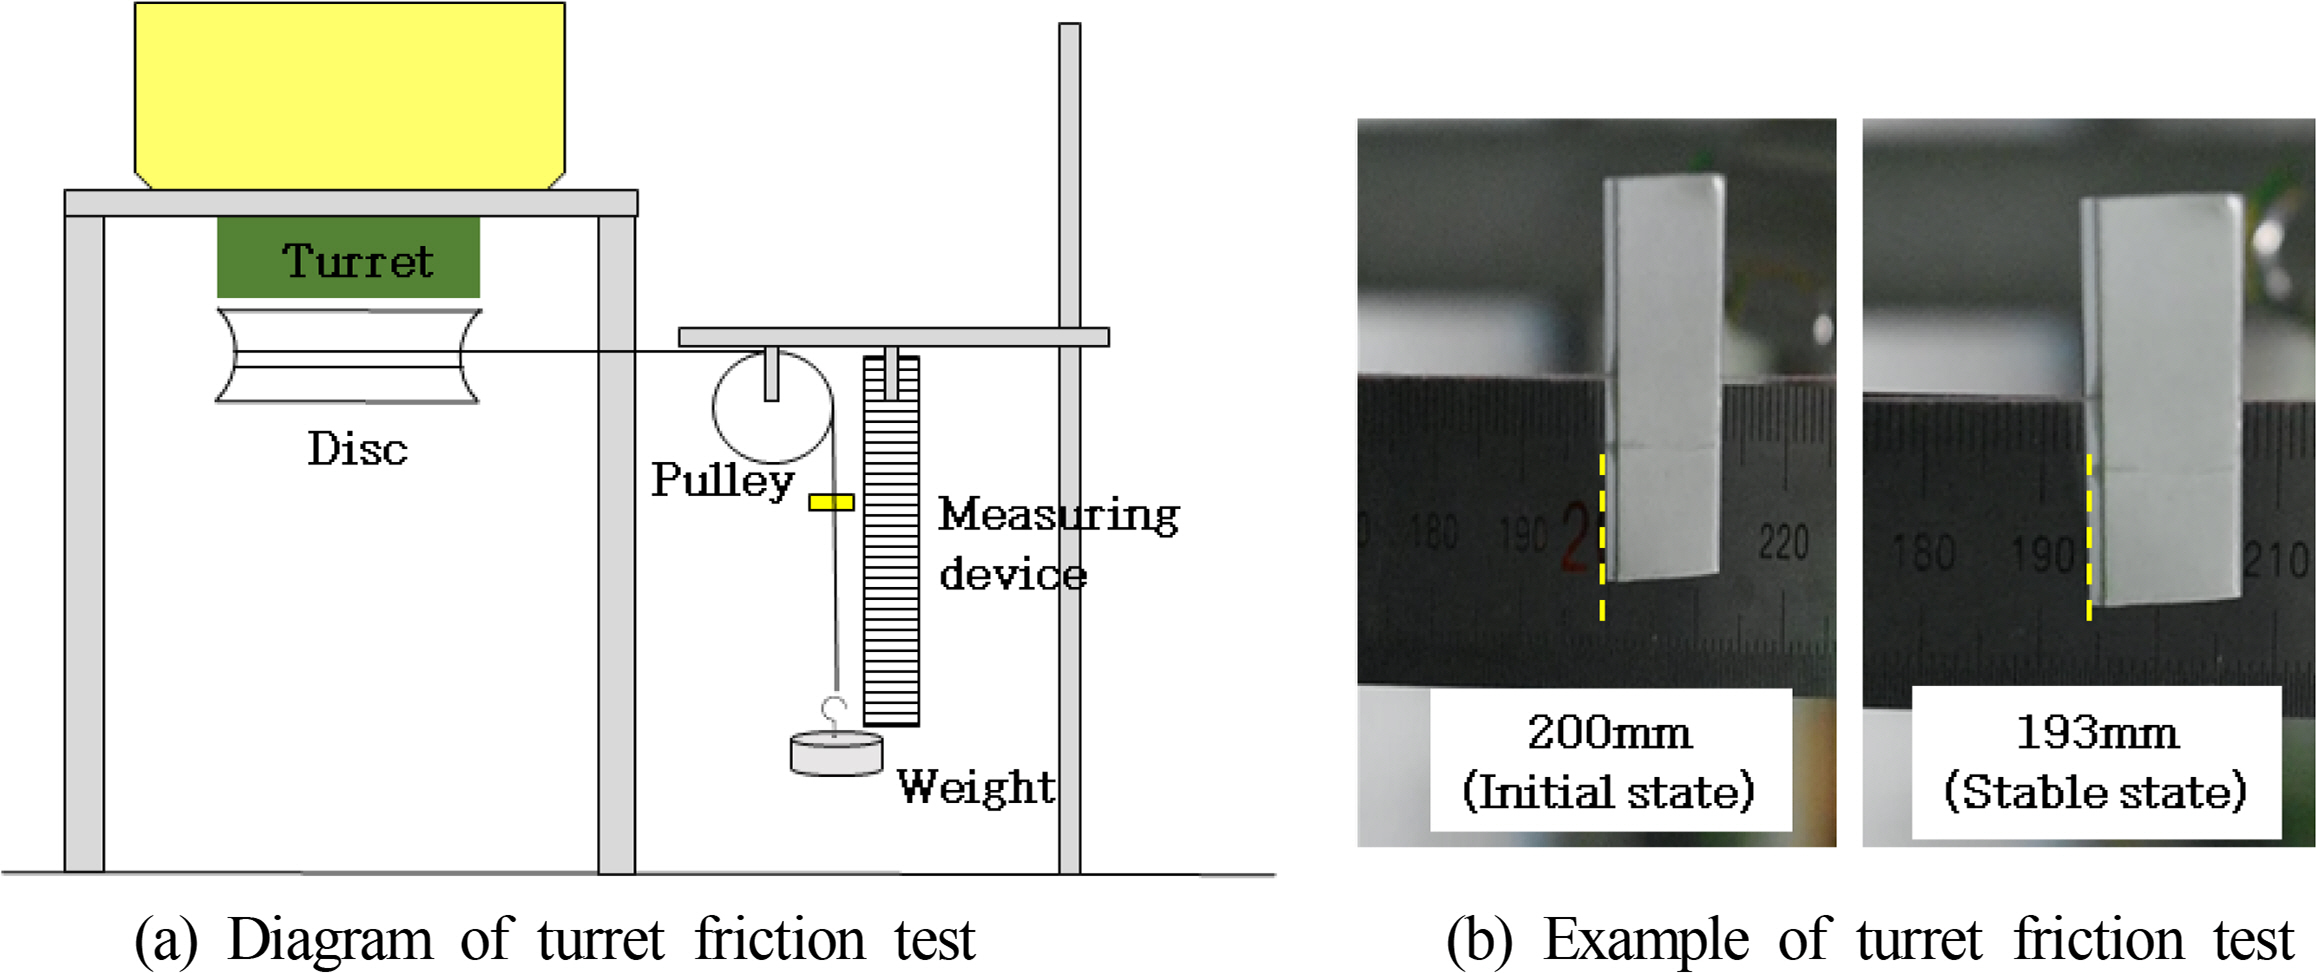
The friction of the turret was tested in the air to obtain the rotational stiffness (k) caused by the turret. The model ship was placed on a cradle and a disc to wrap it with a wire that is attached to the bottom of the turret. One end of the wire was secured to the disc, and the other was connected to the weight through a pulley, as shown in Fig. 12(a). The traveling time and distance were measured when the turret rotates with differing weights (Fig. 12(b)). Constant velocity sections were considered to obtain the rotational velocity of the turret.
The rotational stiffness was calculated using Eq. (4) with the result of the turret friction test and the properties. The rotational stiffness (k) was approximately 1.93 kN for the scale prototype.
where the frictional moment of the roll bearing is obtained by Eq. (5) (Koyo, 2007)
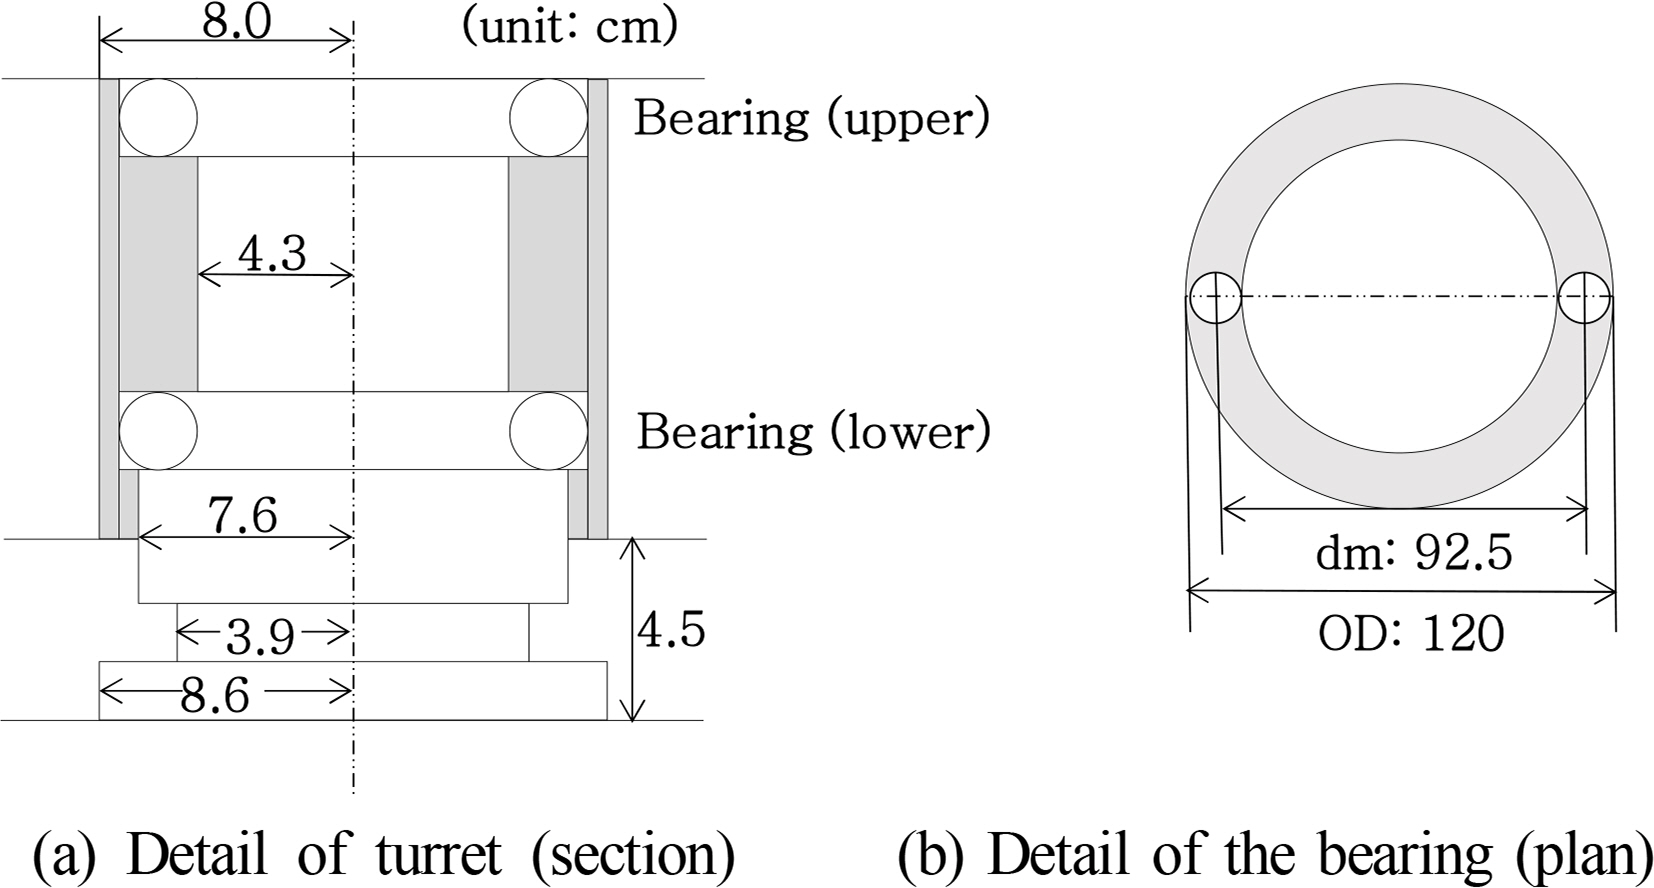
where P is an equivalent weight load on the bearing, μ is the friction coefficient and equal to 0.0015 (Koyo, 2007), and is the diameter between the ball centers (Fig. 13(b)).
5.2 Rotational Damping using Rotational Velocity (RDV Method)
As mentioned in 4.3, additional parameters to suppress the rotational velocity was considered. Generally, acting like a decelerator is known as damping, and this might be related to the rotational velocity as well as the moment in this case. Thus the difference of the velocity between simulation without additional parameter and the experiment was used. As only the wave load had been considered for the experiment, the total moment (Mtotal= Mwave) on the vessel in the yaw direction due to environmental load is the same as the sum of load RAO and wave drift force. So the difference between the rotational velocity with (ψ̇with= ψ̇exp) and without (ψ̇without) additional parameter acting on turret deemed as a turret rotational damping which should be considered for the turret-moored FPSO in Orcaflex. As a result, the rotational damping (τ) using the difference between the rotational velocity of the model test, and the simulation without consideration of additional parameters on turret can be defined as Eq. (6).
As mentioned, additional parameters were considered to suppress the rotational velocity. The damping can be related to the rotational velocity and the moment. Thus, the difference of the velocity between the simulation without additional parameters and the experiment was used. Only the wave load was considered for the experiment, so the total moment (Mtotal= Mwave) on the vessel in the yaw direction due to environmental load is the same as the sum of response amplitude operator (RAO) load and wave drift force. The turret’s rotational damping is considered as the difference between the rotational velocity with additional parameters (ψ̇with= ψ̇exp) and without them (ψ̇without) acting on turret deemed. As a result, Eq. (6) defines the rotational damping (τ) obtained using the difference between the rotational velocity of the model test and the simulation without additional turret parameters.
5.3 Rotational Damping using Equilibrium State (RDE Method)
To obtain the turret’s rotational damping, an equilibrium state in yaw is considered as in Eq. (7) (Sanchez-Mondragon et al., 2018).
where Fx and Fy are the mooring restoring forces on CT in the surge and sway directions, respectively.
m: mass of the vessel
mij: added mass or added moment of inertia of the vessel with respect to the KL (i=1,2,6, j=1,2,6)
xg: the CG position with respect to the KL
I66: moment of the inertia of the vessel with respect to the KL
a: distance between CG and CT
Fmy: restoring force from the mooring system on CG in sway, and can be obtained by Eq. (8)
fy: environmental force on the vessel in sway direction, which is defined in Eq. (9)
Mext: moment in yaw direction generated by external force, and is defined in Eq. (10) (Sanchez-Mondragon et al., 2018).
MCG: yaw moment at CG due to the environmental forces
MCT: rotational moment at CT induced by the interaction between the turret and vessel
Sanchez-Mondragon et al. (2018) described MCT = τ(rturret − rvessel), where rvessel and rturret are the rotational velocity of the vessel and turret, respectively, and τ is the rotational damping. τ can be obtained by solving Eqs. (7) and (10). It is assumed that the restoring force in the sway direction is equal to the restoring force in the surge direction, so the results of the static pull-out test in the surge direction were used for the sway direction.
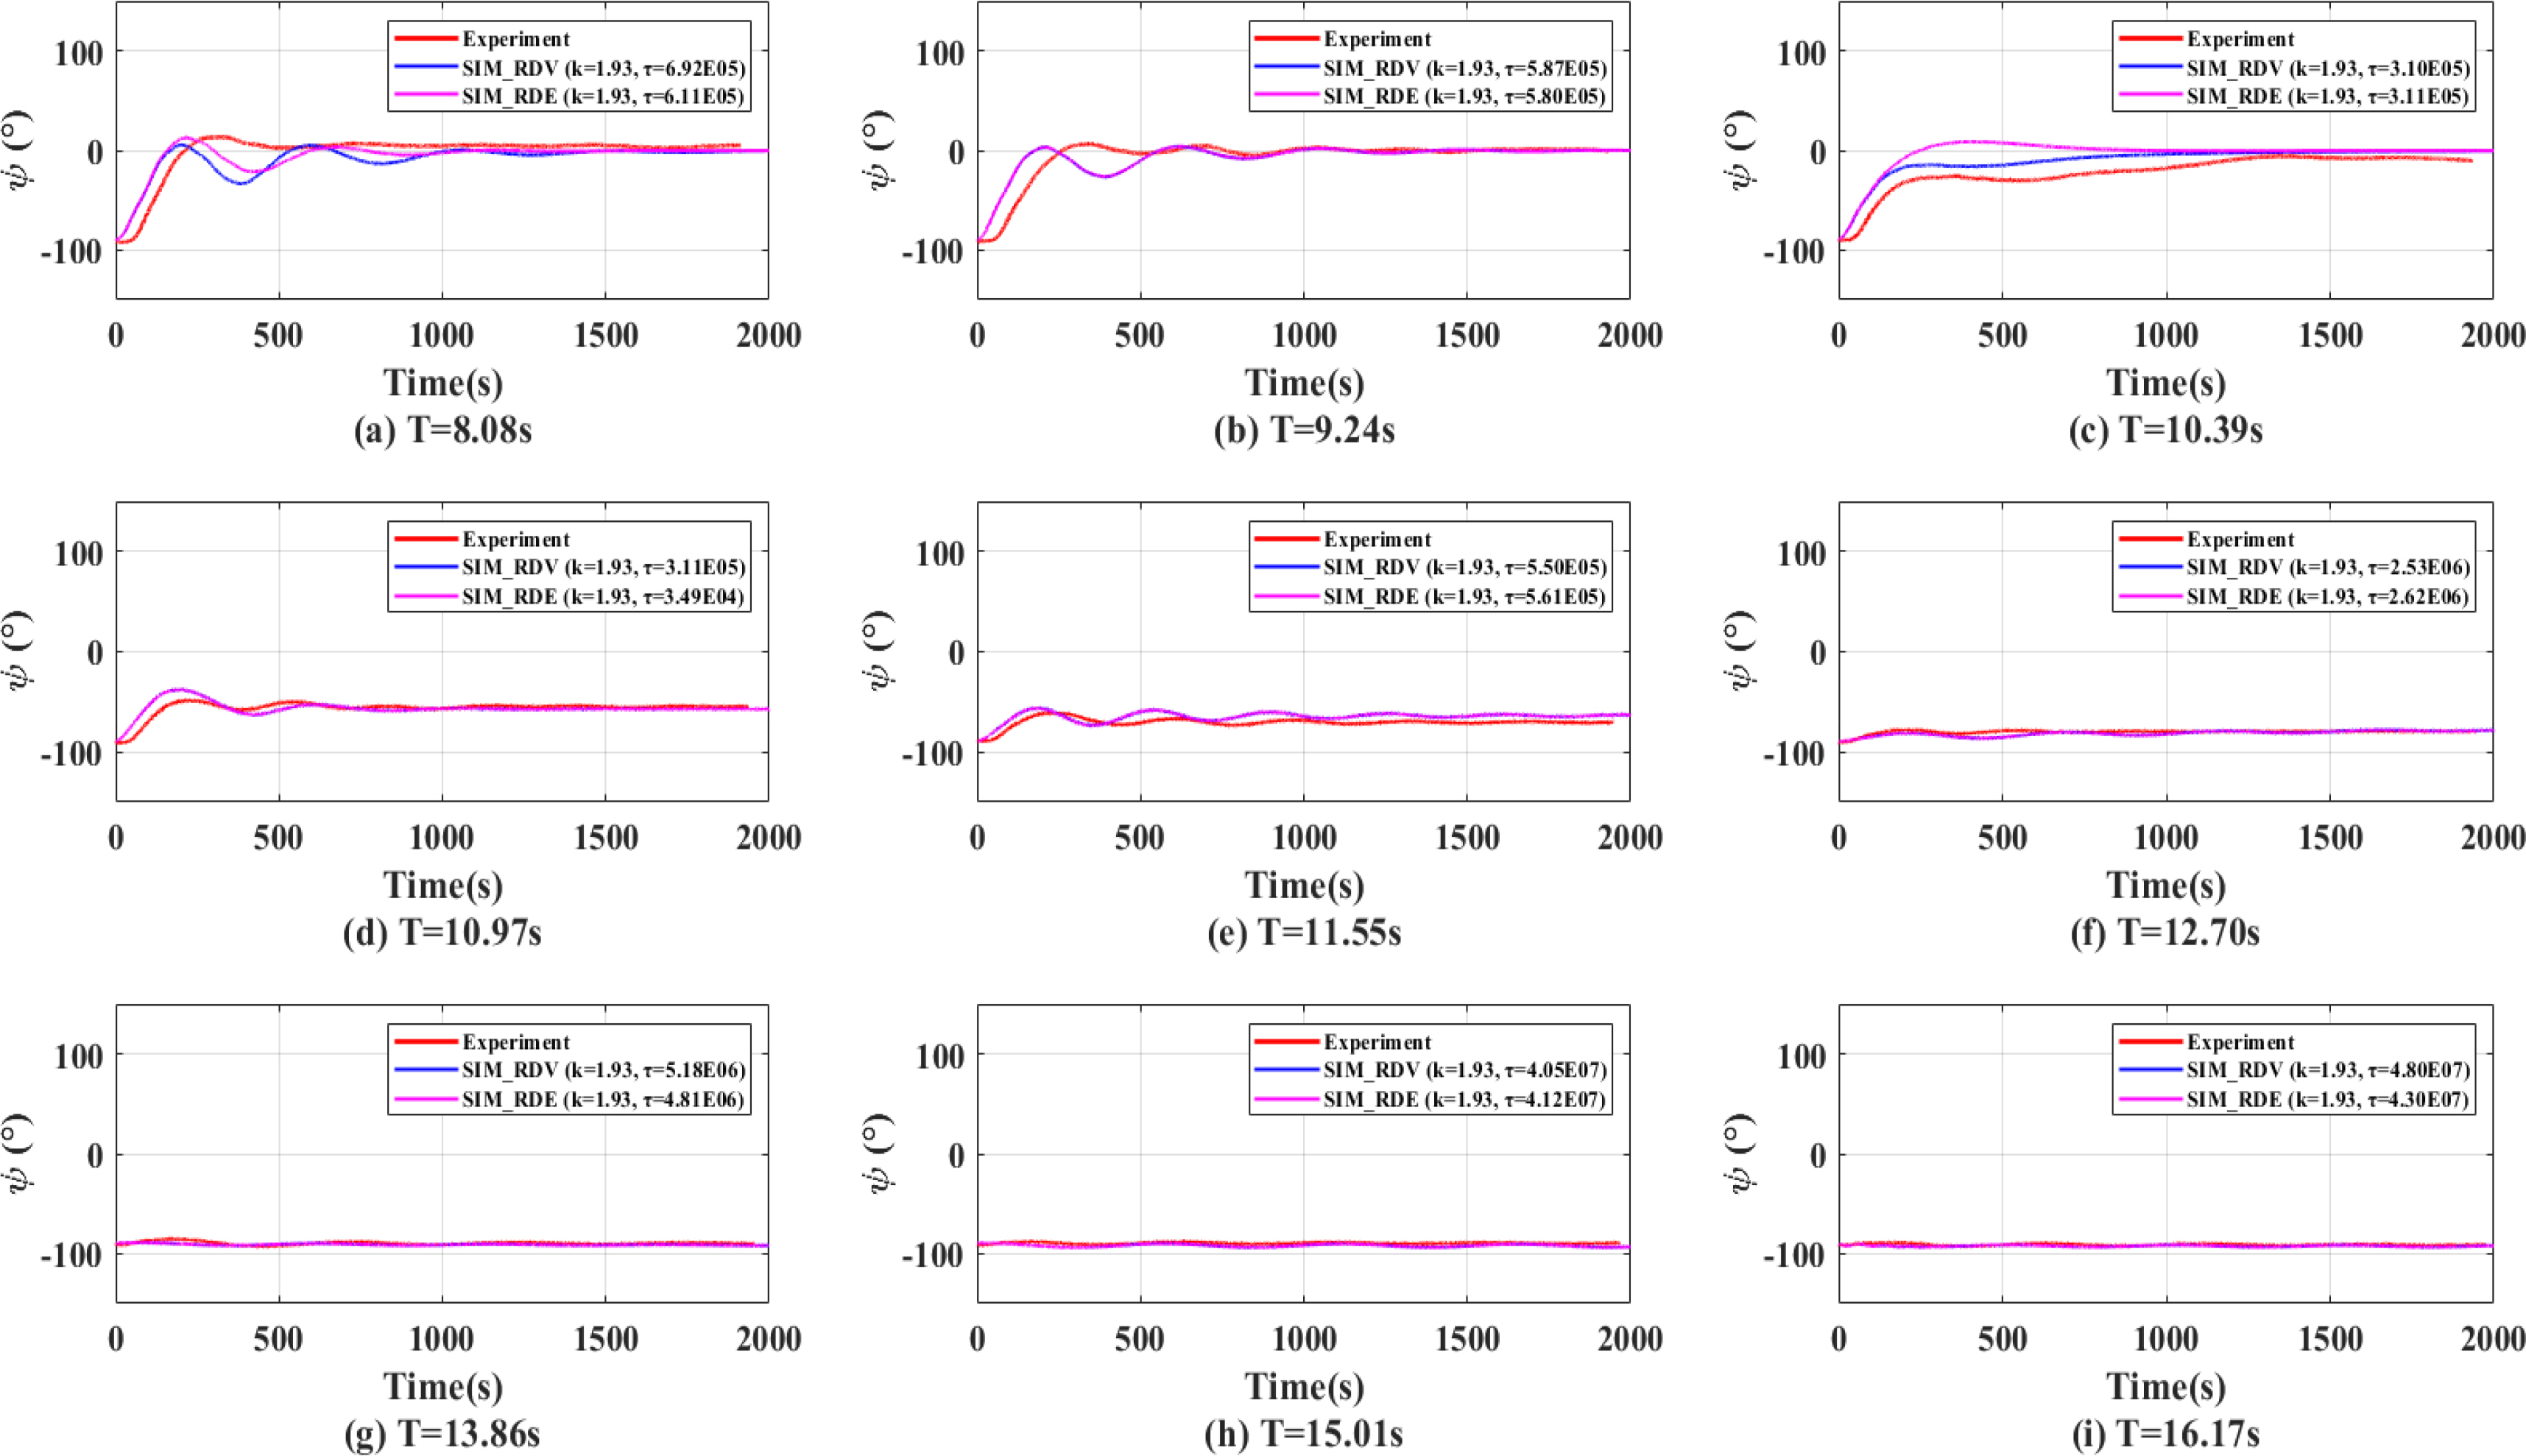
Figs. 14,–16 show the yaw angles in head sea, oblique sea, and beam sea conditions that were calculated while considering the rotational stiffness (k) and the rotational damping (τ) on turret surface obtained by the RDV method and RDE methods. The red, blue, and magenta lines represent the experimental results, the simulated results with turret parameters obtained in the RDV method, and the simulated results with turret parameters obtained in the RDE method, respectively. The RDV results and RDE results showed a tendency of a large fish-tailing phenomenon appearing before approximately 1,000 s. However, compared with Figs. 7,–9, the overall heading angles tend to agree well with the experimental results. As with the results of the model tests, the amount of fish-tailing was decreased, and there was no rotation toward the wave direction at wave periods longer than 10.38 s.
The equilibrium heading angles from the experiment and computation are shown in Table 5. The equilibrium headings were considered the average of the angles from the first peak to the end in each case. The difference in equilibrium heading was compared between the experiment and simulation with additional parameters. The error range of the equilibrium heading angles between the experiment and simulation was 2 to 10%, excluding the maximum and minimum errors for each sea state. Thus, the τ results are reasonable.
6. Conclusions
A turret-moored FPSO has been analyzed under different regular wave conditions with various wave periods and directions. It was found that the heading change was greater with relatively short waves. A numerical analysis was performed for verification, and factors that affect the yaw behavior were investigated to reproduce the heading results from model tests.
The turret’s rotational stiffness was obtained using the physical properties of the bearings and a friction test. It acts as the maximum static frictional force against the contact surface between the turret and the vessel. The turret’s rotational damping mainly affects the rotational velocity, which plays an important role in the fish-tailing phenomenon, so the rotational velocity and equilibrium state were considered. The simulation results were compared to the experimental results, and both methods showed good agreement. However, the RDV method is more appropriate if the turret friction has not been tested. Even if practical data are unavailable, as long as an experimental study is performed, the presented methods can be applied.