1. Introduction
Ocean accidents typically result in environmental pollution. Among the various causes of environmental pollution, such as ship wastewater or unauthorized oil discharge, oil spill accidents cause damage on the largest scale. Because the oil begins to diffuse instantly when it is spill, the contaminated area increases with time. Therefore, a quick response is necessary.
Typically, when an incident is reported, aerial surveying is conducted over the incident area to prepare an initial report. The oil spill area can be calculated using a global positioning system (GPS), side-looking airborne radar, and infrared or ultraviolet scanners (IPIECA, 2016). According to the International Tanker Owners Pollution Federation (ITOPF), oil-contaminated areas are currently estimated using GPS measurements.
The US national weather service uses satellites to not only estimate the range of an oil spill, but also to predict its spread. It is known that remote sensing technology can be used to collect information regarding the wind, ocean currents and tides, sea level heights, and other estimates, including the damage from oil spills (NOAA, 2016). Synthetic aperture radar (SAR) technology has been continuously used as a powerful tool for providing various types of information regarding sea conditions. An example of an oil spill region shown in a SAR image is depicted in Fig. 1 (Fiscella et al., 2000).
A study was performed to distinguish between pixels with and without oil using the histogram shape of SAR images (Kim et al., 2013). A special model, called the thresholding-guided stochastic fully connected conditional random field model, was introduced to infer binary labels from SAR images (Xu et al., 2015). Machine learning techniques have been applied to find oil spill areas. Topouzelis (2008) introduced a method for distinguishing oil films using the phenomenon where an oil film appears to be darker than its surroundings by reducing the backscatter of the sea level in SAR images. Subsequently, an automatic detection algorithm using nonlinear spatial filters was proposed. This algorithm scans the region that appears darker than its surroundings (Schvartzman et al., 2016). Unlike previous studies that approached SAR images visually, images were analyzed based on various types of data in this study.
By analyzing SAR images, a relatively accurate oil spill area can be estimated. However, to obtain SAR images at an accident location, a satellite should be orbiting above the location, or SAR equipment should be installed on an aircraft performing reconnaissance. Given that an immediate action is essential to control oil spills at sea, an effective method that does not require the abovementioned preconditions is strongly recommended.
Herein, to identify oil spill regions promptly, a method for estimating an oil spill area from a digital image is proposed. Such digital images are normally obtained from drones or an aircraft flying around the accident area. Image processing is required to automatically digitize and process information such as the size or direction of the contamination. An algorithm that automatically calculates the oil spill area in the digital domain was developed based on the assumption that the oil spill images captured with a digital camera are similar to those confirmed visually. The general image processing techniques needed for the algorithm are explained, and the theory and practical application of filtering and thresholding are discussed. This paper analyzes numerous oil spilled images currently available and classifies them according to their characteristics; subsequently, an appropriate analysis method is proposed for each classification.
2. Image Processing Preliminaries
2.1 Digital Image
A digital image is generated by sampling and quantizing a portion of light reflected by an object into a camera sensor. The process of converting an analog value sensed by a sensor to a digital value is defined as sampling, while quantization is the process of ŌĆ£integerizingŌĆØ an infinite sequence of sampled digital values. An image can be mathematically defined by a two-dimensional function f(x, y), where x and y are the two-dimensional coordinates of the image.
Image processing techniques are typically used to extract the desired pieces of information from images (Petrou and Petrou, 2010). After an image is represented digitally, an appropriate image processing technique is used for each image analysis. Image processing refers to comprehensive technology that uses a computer to process images and acquire the desired results. Image processing includes both low-level processing to reduce noise or improve contrast and high-level processing to analyze and recognize images. An image may be characterized by observing its changing period in the frequency domain and detecting specific objects or textures in the image using the pixel value distribution. These techniques were actively used in this study.
2.2. Filtering
Image processing can yield improved results by appropriately utilizing the relevant techniques involved. Among these, the role of a filter is essential. Filtering removes noise in an image and extracts visual features, thus enabling resampling functions such as image scaling and pixel value conversion, among others.
Most digital images are accompanied by unwanted noise. Photographs of the sea taken from an aircraft or other flying object are no exception; in particular, noise such as that caused by reflected ambient light is inevitable. An image typically includes other noise components that can be removed or reduced using ultraviolet and polarizing filters (ITOPF, 2014). Nevertheless, the noise caused by the remaining light must be treated using other filters.
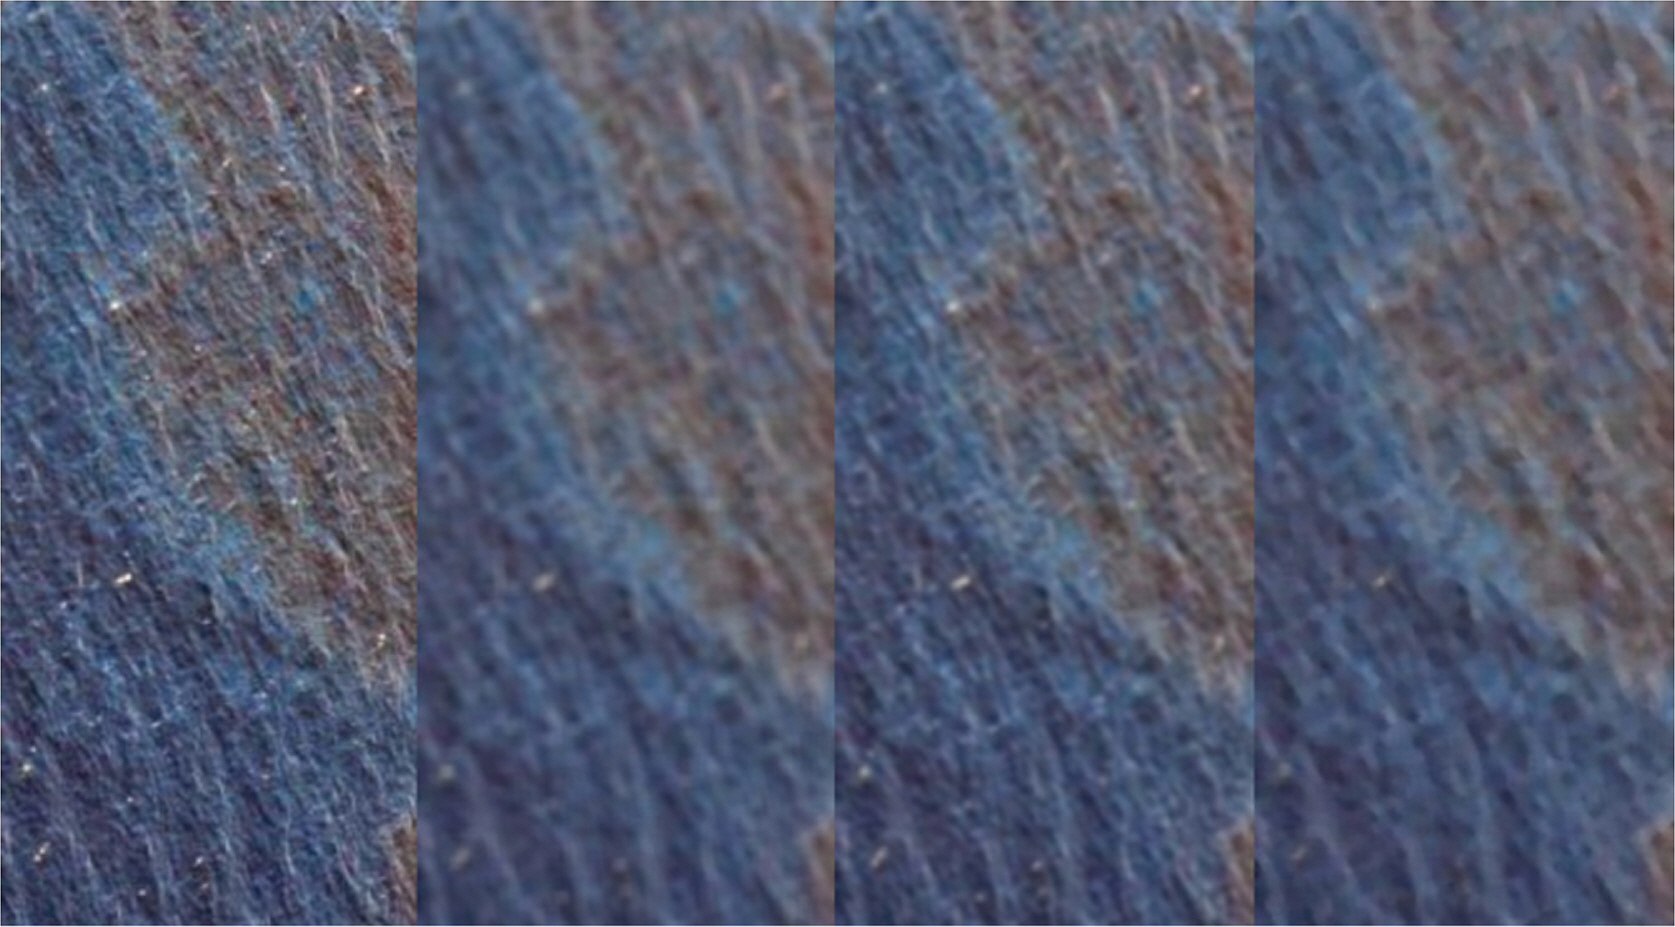
Filters are used according to their principles and characteristics (Gonzalez and Woods, 2017). A linear filter typically represents an entire image smoothly. A blur filter, as a representative linear filter, blurs an image by replacing each pixel with an average pixel value calculated over a rectangular neighborhood. Similar to the blur filter, a Gaussian filter imposes the weights of neighboring pixels by applying the Gaussian function. A median filter uses the median of a set calculated by converting a pixel and its surrounding pixels into a set of median values. The ripples appearing in images captured from the sea produce noise by reflecting the sunlight. This noise is similar to the salt-and-pepper noise that can be effectively removed or reduced by applying a median filter. The median filter tends to outshine the original colors, as shown in Fig. 2.
2.3. Binarization
Spilled oil diffuses over the sea surface over time. If the shape of the diffused oil can be defined geometrically, it is possible to calculate its area mathematically. Unfortunately, because the shape is typically random and irregular, it is complex to define a mathematical representation of the shape, which renders it difficult to calculate its area analytically. Herein, a binarization technique is proposed that uses the digital characteristics of an image to classify the area according to the pixel information.
Binarization represents all of the pixel values as either black or white. When the number of bits of one pixel representing the color is N, the range of the color representation becomes [0, 2NŌłÆ1]. For example, the color range of an 8-bit image primarily used in image processing is [0, 255]. Because binarization uses only two extreme values in this color range, it can theoretically split two other objects in the image, such as water and oil.
To binarize an image, the threshold must be calculated in advance. Representative methods for calculating the threshold value include global fixed binarization using the brightness values of the entire image and local variable binarization using the neighboring pixel values of each pixel.
Among the global fixed binarization methods, the Otsu (1979) algorithm has been widely used. It calculates the threshold value using the brightness distribution of an entire image. However, when determining the threshold value for a wide range of color information, all of the areas are not readily distinguished by the Otsu method because it only uses a single threshold value. The adaptive thresholding method, which is categorized as a local variable binarization method, uses a weighted average calculated by setting the size of a block to determine neighboring pixels at a selected pixel position (Bradley and Roth, 2007). When adaptive thresholding is applied, pixels with a large difference from their neighboring pixels are binarized to obtain an edge-highlighted result.
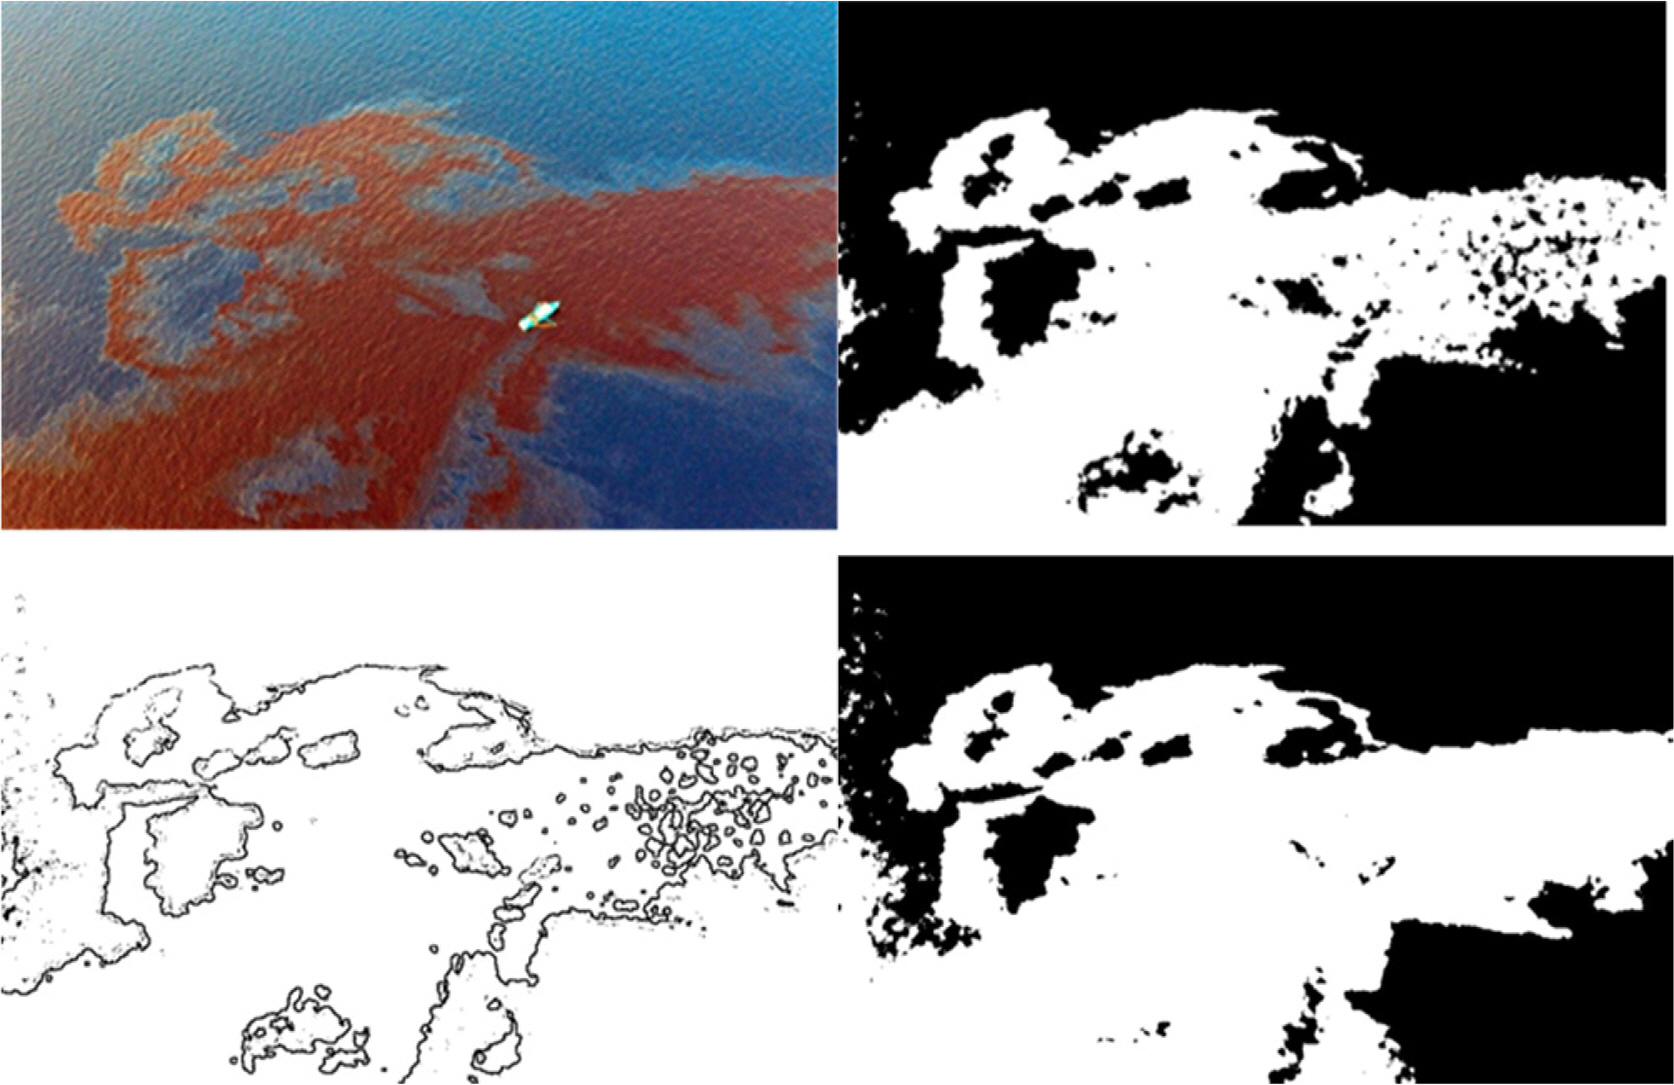
Fig. 3 compares the results obtained by the Otsu method and adaptive thresholding, as well as those by the algorithm developed in this study. The developed algorithm synthesizes binarized images using multiple thresholds. Details regarding the algorithm are presented in the upcoming section.
3. Calculation of Oil Spill Area
3.1 First Step: Analysis by Hue Property
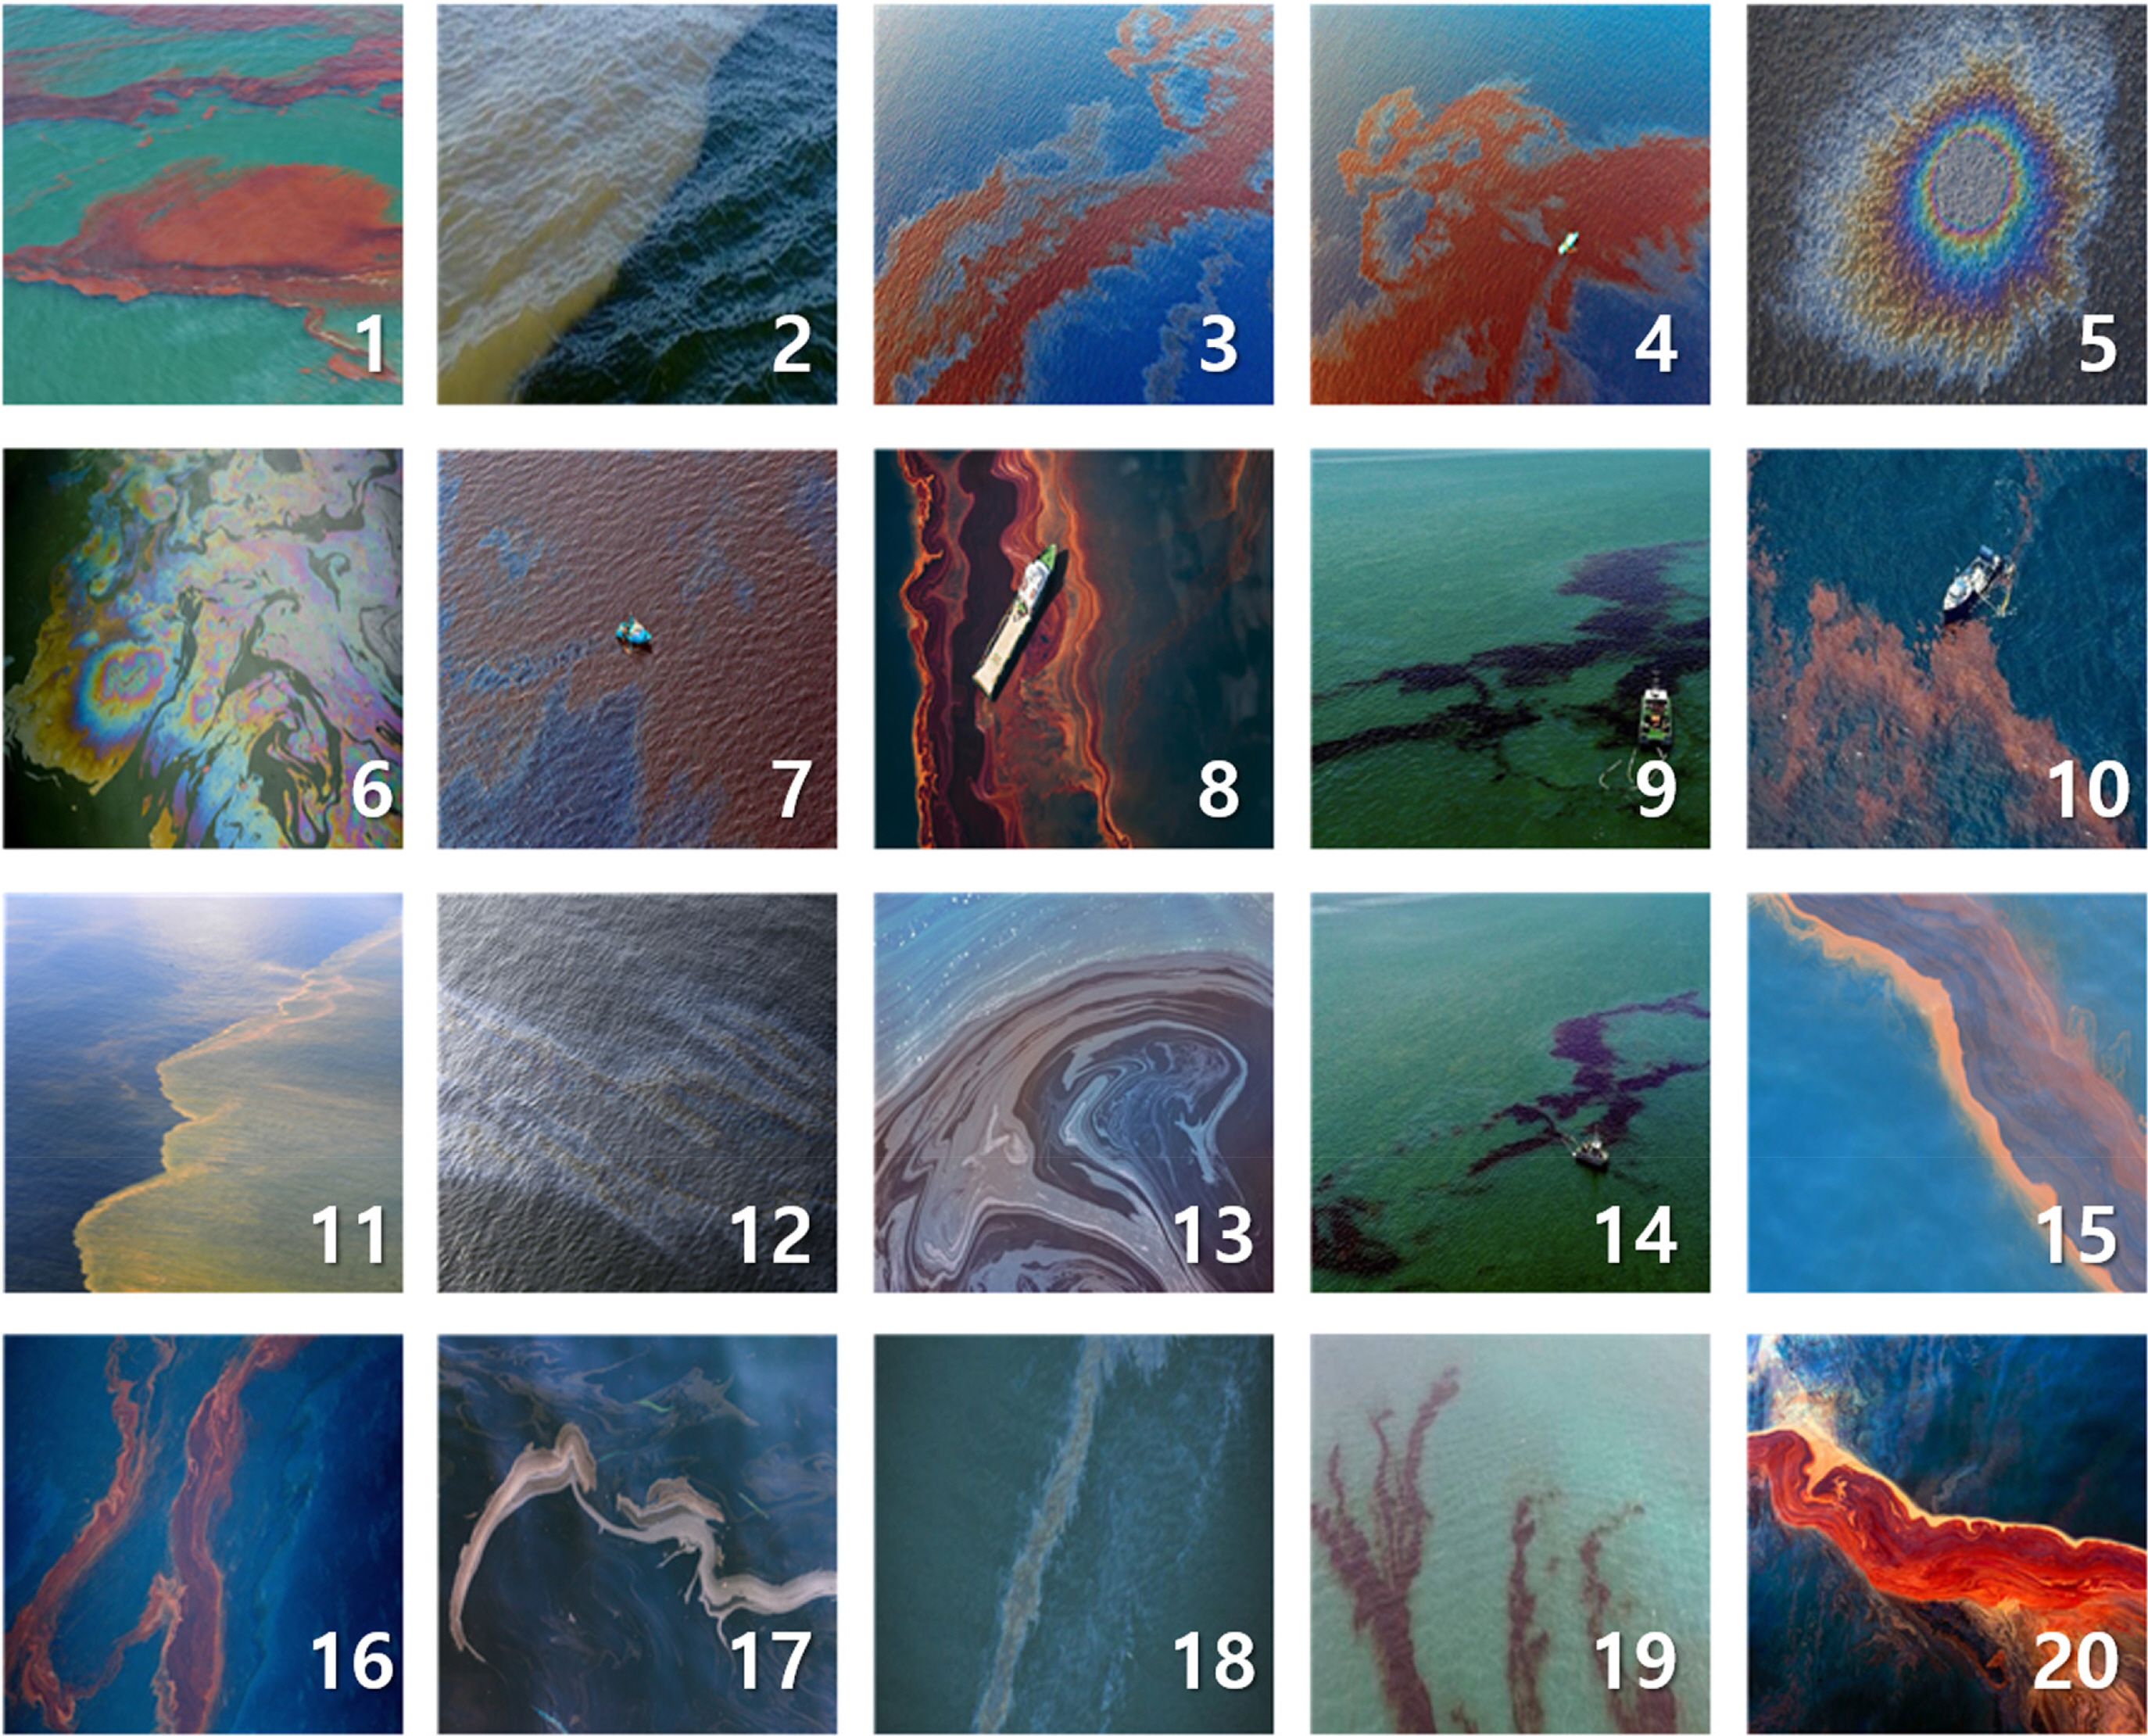
To estimate the extent of spilled oil at sea, it is necessary to separate the fraction of oil from seawater. In this study, histograms of 20 images, as shown in Fig. 4, of distinct oil-spilled patterns were collected and analyzed for a clear separation. The images used in the analysis were color-expressed scenes in a digital format and were regarded as a population of various oil patterns appearing at the accident site.
To obtain the desired characteristics from an image, it is necessary to extract the distinct feature included in the image. It is clear that most viewers can intuitively identify an oil spill from seawater using their eyes. Because human intuition is influenced by the color difference shown in the image, the first step is to select a method that distinguishes the areas using this color difference.
A digital image is a medium that expresses an entire image as a mathematical model, called a color model, by combining the specific colors of each pixel of an image. The typical color models used in image processing include red, green, blue (RGB); hue, saturation, value (HSV); and hue, saturation, lightness (HSL). The RGB model is a numerical representation of the changes in the three major colors, which allows it to be easily understood. However, when the three colors are combined, the results are difficult to predict. Meanwhile, the HSV and HSL models have structures that make it easy for humans to perceive color; thus, they are widely used in image processing. When only the desired color information from the RGB model must be extracted, RGB is converted to either HSV or HSL.
The OpenCV library is used for the computational treatment of image processing techniques. OpenCV is an open-source library for developing computer vision applications (OpenCV, 2019). It provides numerous functions necessary for image processing; furthermore, it can be seamlessly executed on multiple platforms.
An OpenCV function is utilized to convert the color space read in RGB into the HSV color space. General equations for changing the color space are easily found in the literature or online, as in Eq. (1).
After the color space conversion, when processing for a single color is required, a three-channel (HSV) image is separated into single channels (H/S/V). Subsequently, the histogram of the separated channel image is obtained, and binarization is performed.
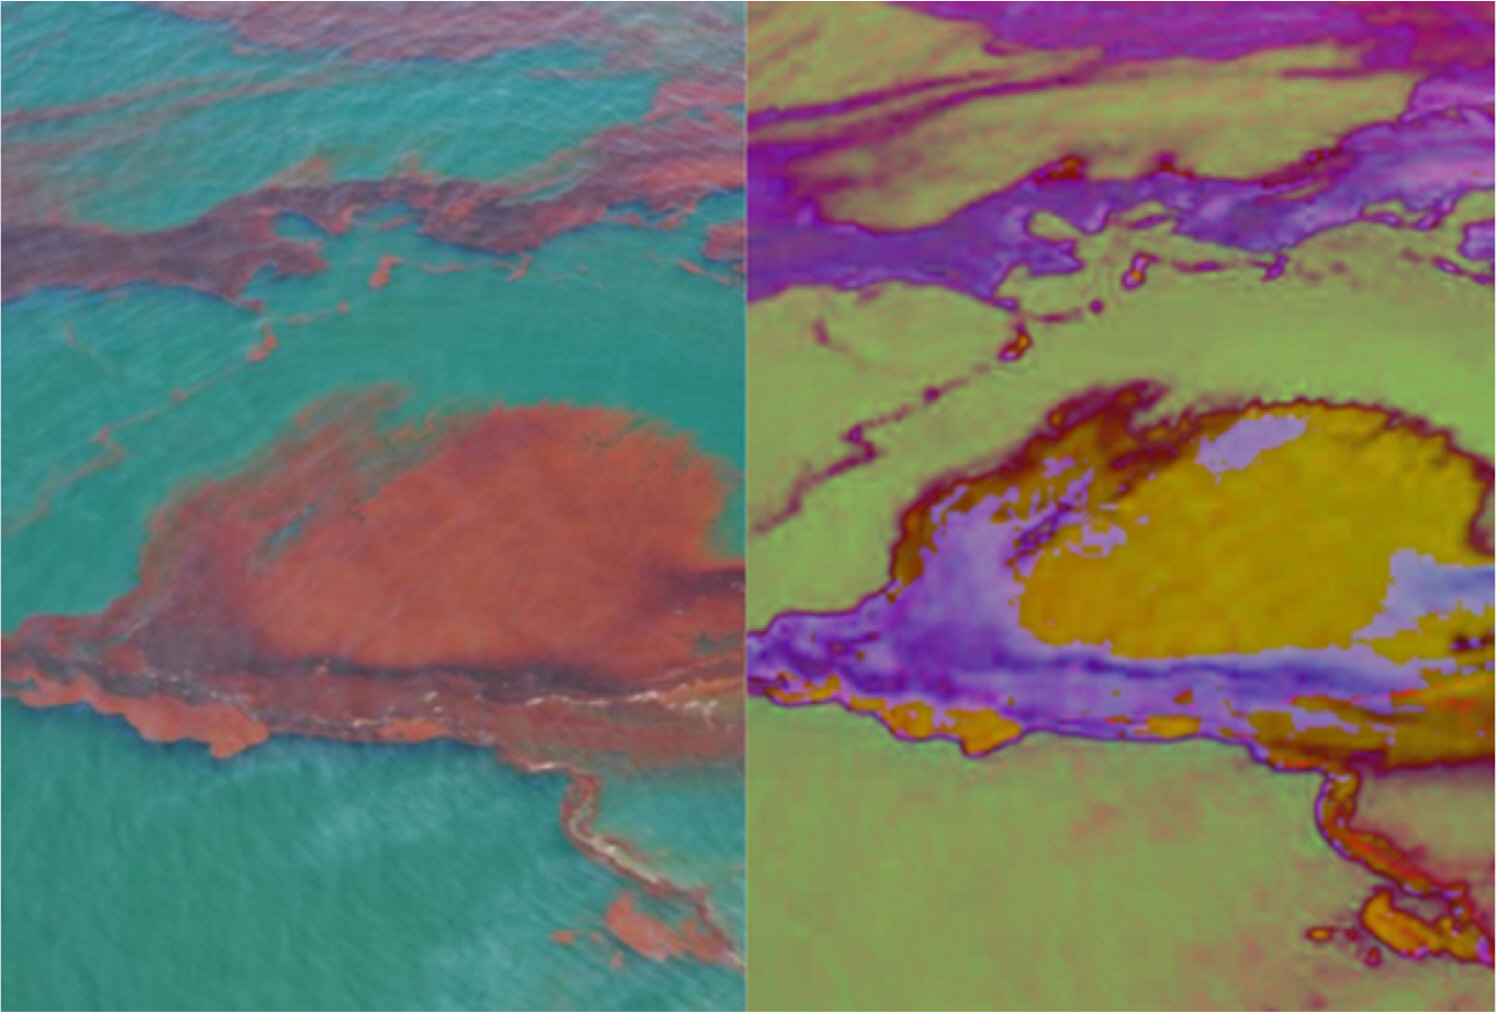
An example of changing the RGB color space to HSV is shown in Fig. 5, followed by three images after separation into individual channels in Fig. 6. The histogram for the left hue image of Fig. 6 is depicted in Fig. 7. After the minimum and maximum values are obtained from the histogram, the peaks and valleys are determined using the slopes of the neighboring values. To find the peaks or valleys, the histogram is first blurred and curved. To distinguish neighboring peaks, certain parameters are used as criteria. The parameters are determined in the image analysis step according to the image size, that is, the total number of pixels of the image, and the determined parameters are applied in the image processing step.
Table 1 lists the number of peaks in the hue histograms of the 20 sample images.
Even though multiple peaks appear in the color range of seawater, not all of these peaks represent meaningful values. Thus, it is plausible to discard peaks other than the peak with the lowest value within the range. The number of valid peaks adjusted from the number of peaks in Table 1 is rewritten in Table 2.
The spilled crude oil initially appears black (#9 in Fig. 4; the image index is denoted by a mark (#) followed by its number, hereinafter) and becomes emulsified to a reddish color over time. By analysis, the color histogram of the black or red image shows two peaks near both ends and one peak in between. With three peaks, the two valleys between the peaks can be used as the thresholds. Images with two peaks, e.g., #2 and #11, do not show red or black colors, but the seawater and oil can easily be distinguished by different colors when confirmed visually. Histograms with silver or iridescent oil films such as #5, #6, #12, #13, and #18 have either one, four, or more than four peaks, which make the analysis more complicated. The histograms for the selected sample images are illustrated in Fig. 8.
When the images were binarized using the threshold value obtained by the histogram analysis, the separation between water and oil was possible in the 13 three-peak images (#1, #3, #4, #7, #8, #9, #10, #14, #15, #16, #17, #19, and #20) through two binarizations. However, in the images with other peak numbers, the separation was not successful in whole or in part. The separation failure could be attributed to several reasons, but it can be deduced that an important factor was the fact that the hue characteristic considered in this step was limited to chromatic colors. This implies that other separation methods are needed.
3.2 Second Step: Analysis by Saturation Property
Saturation is used for images whose hue histogram has either a single threshold value or when a valid threshold value cannot be obtained. This is a strategy to separate different regions by utilizing the level of sharpness, which the hue itself cannot express. In other words, through saturation, some achromatic information can be utilized, which can provide a clue for additionally processing regions not separated by the hue.
Saturation histograms were created and analyzed for the seven sample images that did not have valid threshold values in the hue analysis. The results are summarized in Table 3.
If the saturation histogram is bimodal, then one effective threshold is obtained. In this case, two binary images obtained by the hue and saturation analyses, separately, are synthesized to generate a combined image that attempts to complement the two results. Consequently, valid threshold values could be obtained for images #2, #5, #6, and #11.
Fig. 9, for instance, illustrates the synthesis process for sample #2, which combines the hue image (left) and saturation image (middle) to yield the synthesized result shown on the right.
If a binarized result is obtained from the hue images such as #2 or #11, the oil spill area can be obtained by additionally considering the result of the saturation image. However, when three or more valleys are obtained from the hue images, such as #5 or #6, some regions are still not detected, as shown in Fig. 10.
In some cases (#5, #6, #12, #13, and #18), hue and saturation analyses were not applicable. Hence, the regions had to be separated using a feature other than the hue or saturation.
3.3 Third Step: Analysis by Lightness Property
A smaller spill or already decomposed oil appears as a thin film that shows silvery or iridescent colors. The silvery film shows little difference from the sea in terms of color, while the rainbow colors produce many different colors simultaneously, rendering it difficult to calculate a valid threshold value with hue and saturation analyses.
In this case, it will be effective to use the lightness information as a new characteristic by focusing on the fact that the oil film reflects more light than the seawater. This is due to the nature of the oil film floating on the water surface. In this study, the separation was performed using the grayscale lightness after the original image was converted to grayscale.
Table 4 lists the number of peaks obtained from the lightness histogram. Because the lightness histogram indicates the increase or decrease in lightness, even if two or more peaks occur, only one binarization is performed using the value located at the lowest valley as a threshold. For example, sample image #6 shows three peaks, that is, two valleys, after the lightness histogram analysis. In this case, one binarization is performed using the lowest threshold value.
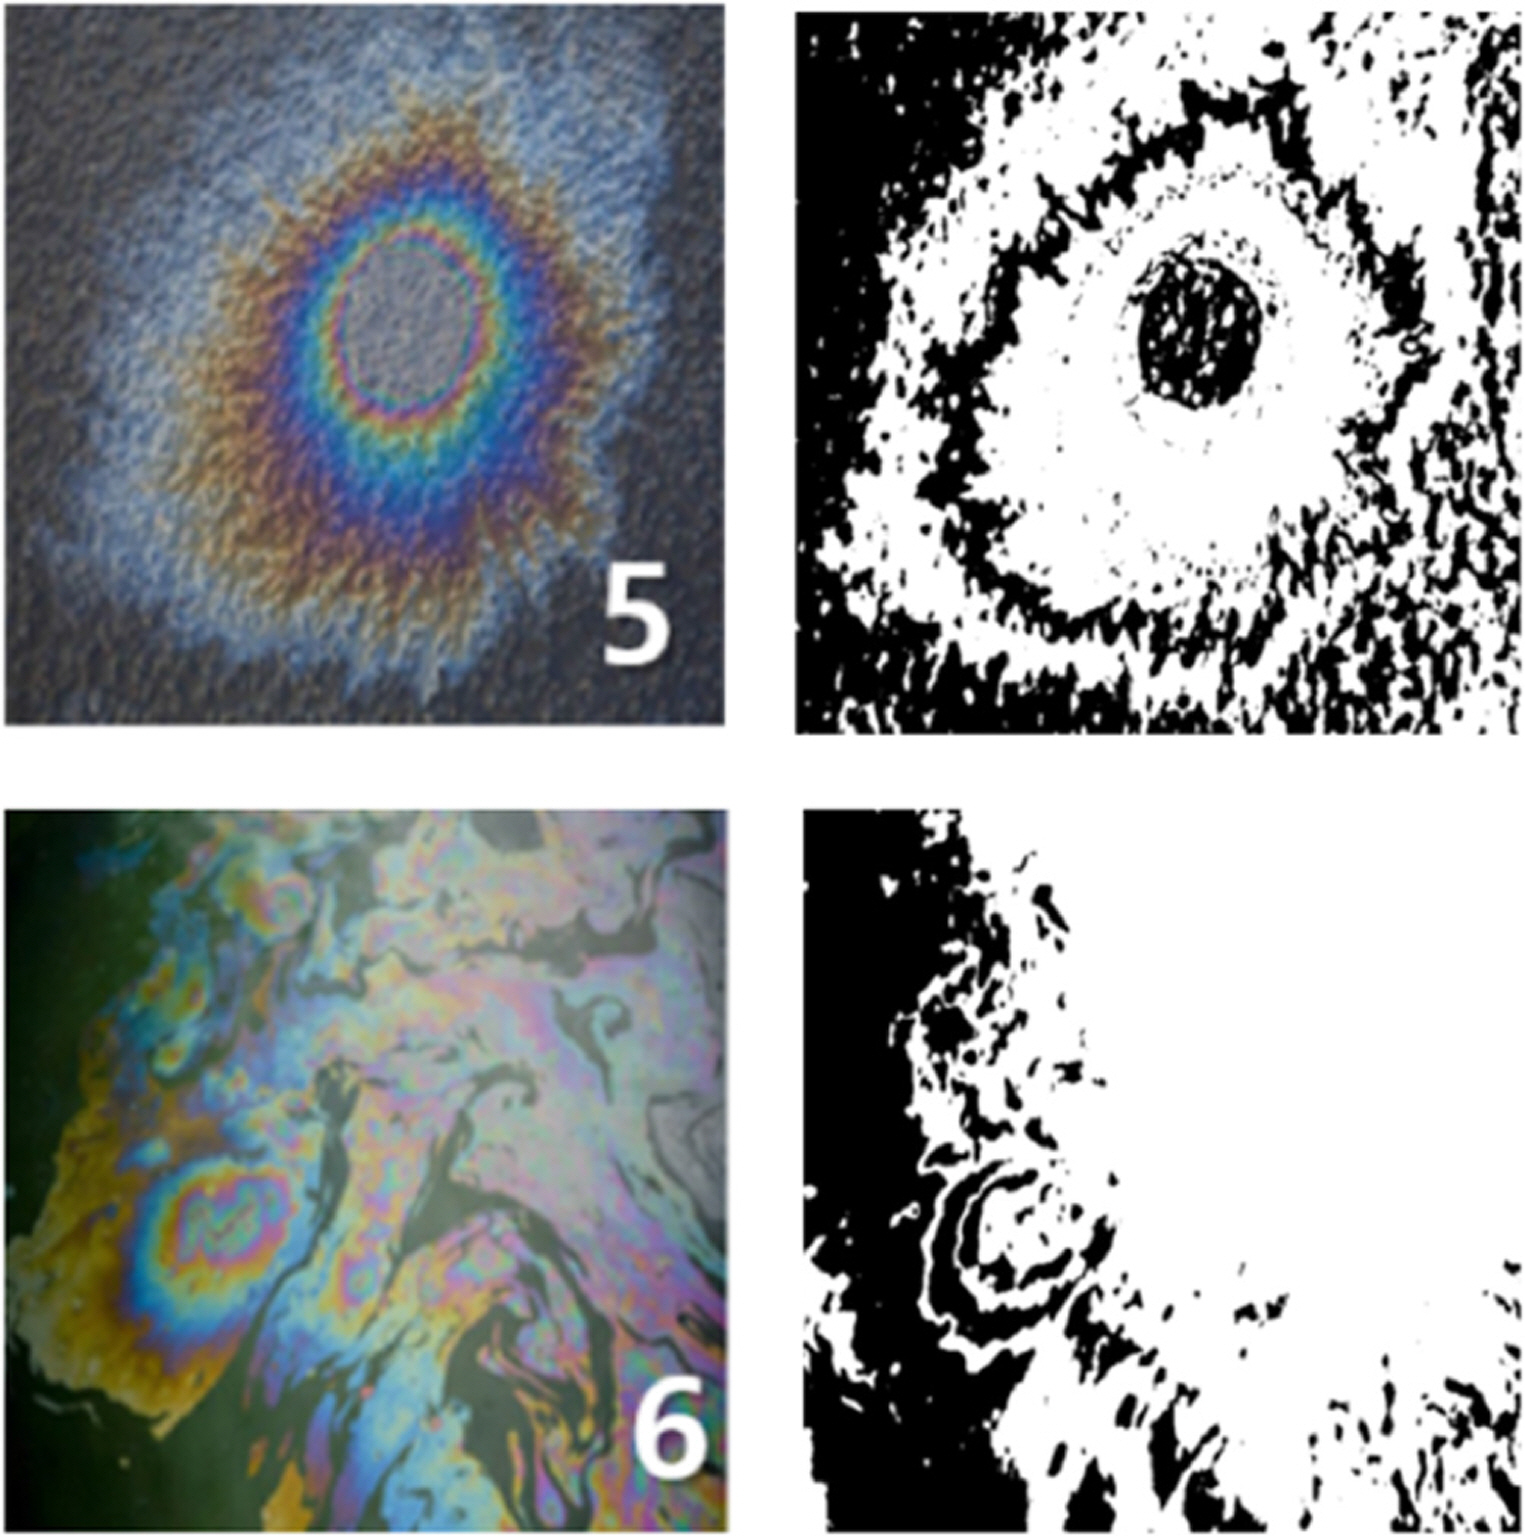
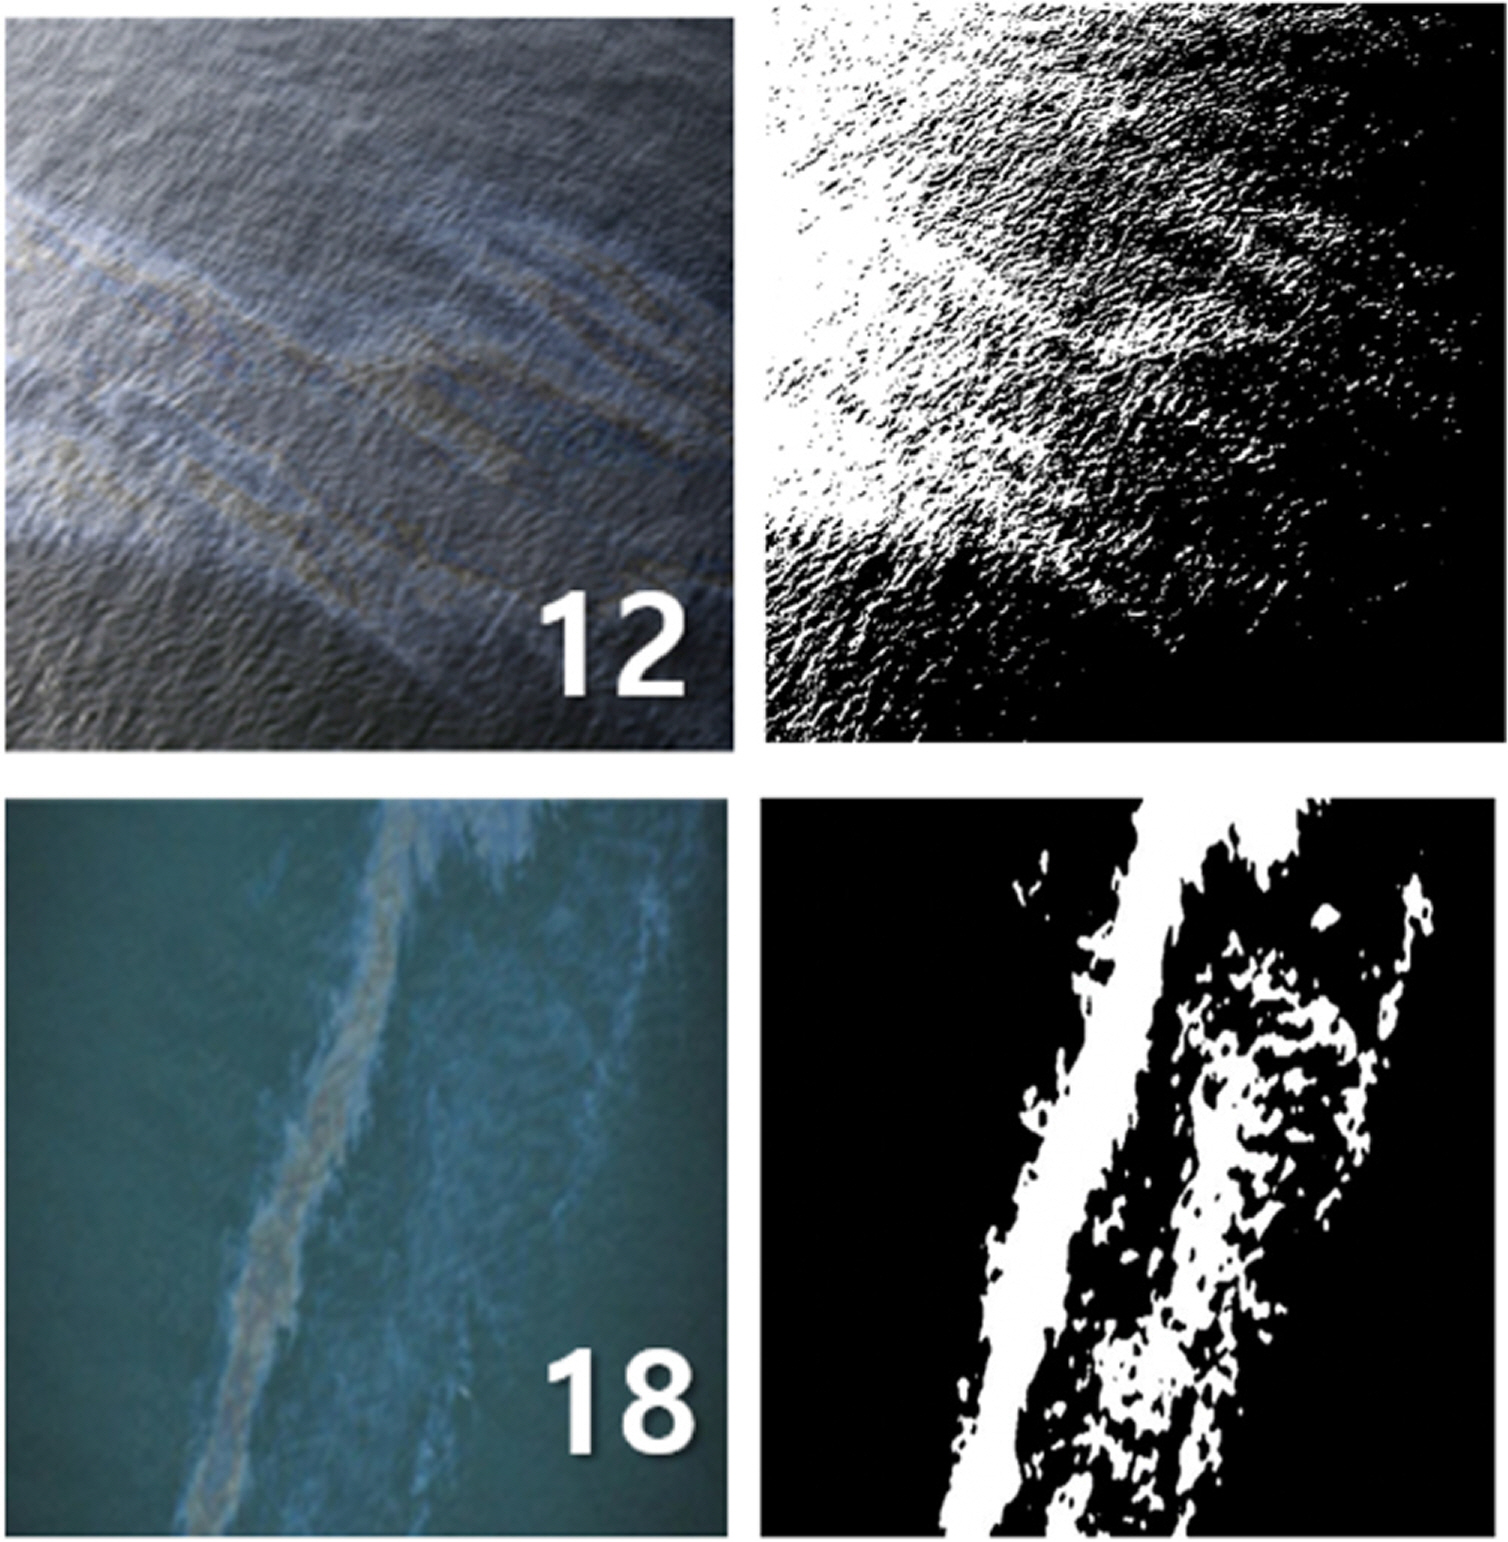
Fig. 11 shows the results of binarization using the lightness valley as a threshold. The three-step binarization reveals a reasonable separation. Nevertheless, all of the results are far from ideal. In some regions, water and oil are reversed. The fact that the oil and water areas in #13 are difficult to distinguish even with the naked eye is also a cause of incomplete results.
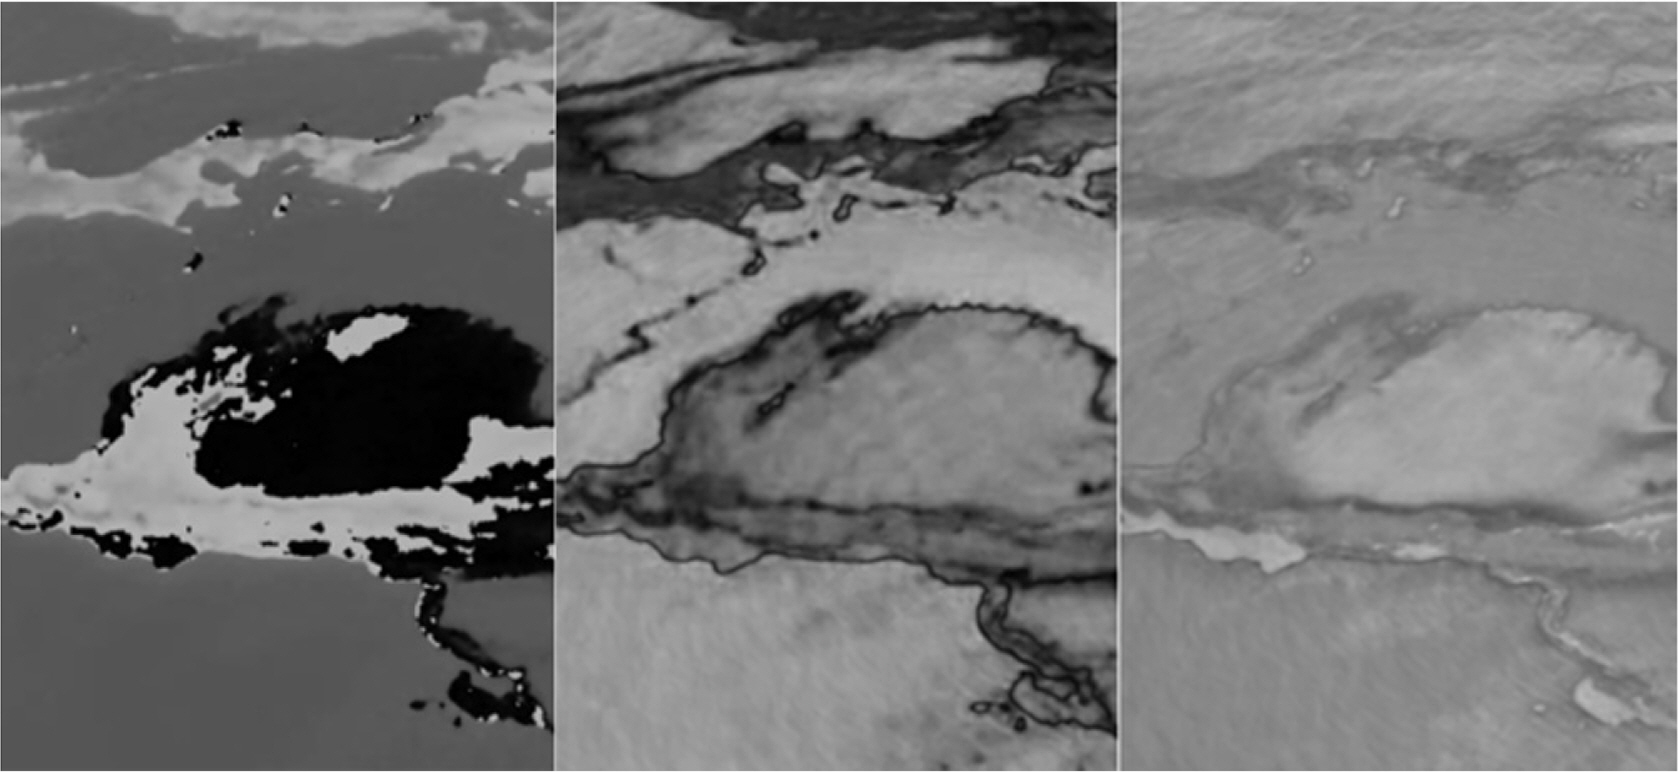
Because the #12 and #18 images with one peak could not be determined because no valley existed, the binarization was performed using the Otsu (1979) method. The results are shown in Fig. 12, and it is difficult to infer the oil spill area from the binarization result. In the #12 image, the binarization result becomes meaningless because the spilled oil and highlight of the reflected light are mixed for the binarization. In this study, it was considered impossible to automatically separate images such as #12 and #18. It is more logical for the user to perform the separation semi-automatically or manually.
3.4 Summary of Proposed Algorithm and Binarization Results
The flowchart of the developed oil spill separation algorithm is summarized in Fig. 13.
After preprocessing, the resulting histograms are classified into three different cases, depending on the number of peaks in a histogram. The first case includes three-peak histograms that possess two valid thresholds. In this case, the oil area can be inferred by synthesizing two binarized images obtained using those threshold values from an image converted into the hue. If the number of peaks obtained from the hue histogram is either one or more than three, a further analysis is required. The saturation histogram is further analyzed in this case. With two peaks, binarization by saturation is first performed, and the result is combined with that of the hue histogram. Otherwise, the lightness histogram should also be analyzed. If two peaks occur in the lightness histogram, the oil area can be estimated as a result of binarization. Table 5 lists the binarized results for all of the oil spill images analyzed in this study.
3.5. GUI Design
The initial screen of the GUI system for implementing the developed algorithm is shown in Fig. 14. The area ratio of the image extracted from the binarized result is recorded below the original image. If the user knows the scale of an input image, then the actual area of the image can be computed. The area calculation is based on a pixel-millimeter conversion, and the scale can be calculated using the aerial altitude where the camera is positioned.
4. Conclusions
An algorithm for rapidly estimating oil spills at sea was introduced. SAR images, which have been widely used, can be used to produce accurate data; however, the difficulty in promptly accessing an accident site is disadvantageous. The purpose of this study was to suggest a method to analyze an oil spill site quickly using a digital image.
Binarization was performed by sequentially considering the hue, saturation, and lightness of an oil spill image. Color is an important factor that indicates the thickness of the spilled oil. Because an oil film is typically black, brown, or orange, the color can be used to differentiate an oil spill area from the surrounding seawater. If separation by color is difficult or not applicable, additional image binarizations are performed by examining other characteristics of the image, such as the saturation or lightness.
Using the algorithm proposed in this paper, oil spill areas could be estimated quickly, and oil accident sites could be controlled.