J. Ocean Eng. Technol. Search

CLOSE


J. Ocean Eng. Technol. > Volume 35(6); 2021 > Article
Kim, Kang, Kwon, Lee, and Kwon: A Review on the Building Wind Impact through On-site Monitoring in Haeundae Marine City: 2021 12th Typhoon OMAIS Case Study

Abstract

Overcrowding of high-rise buildings in urban zones change the airflow pattern in the surrounding areas. This causes building wind, which adversely affects the wind environment. Building wind can generate more serious social damage under extreme weather conditions such as typhoons. In this study, to analyze the wind speed and wind speed ratio quantitatively, we installed five anemometers in Haeundae, where high-rise buildings are dense, and conducted on-site monitoring in the event of typhoon OMAIS to determine the characteristics of wind over skyscraper towers surround the other buildings. At point M-2, where the strongest wind speed was measured, the maximum average wind speed in 1 min was observed to be 28.99 m/s, which was 1.7 times stronger than that at the ocean observatory, of 17.0 m/s, at the same time. Furthermore, when the wind speed at the ocean observatory was 8.2 m/s, a strong wind speed of 24 m/s was blowing at point M-2, and the wind speed ratio compared to that at the ocean observatory was 2.92. It is judged that winds 2–3 times stronger than those at the surrounding areas can be induced under certain conditions due to the building wind effect. To verify the degree of wind speed, we introduced the Beaufort wind scale. The Beaufort numbers of wind speed data for the ocean observatory were mostly distributed from 2 to 6, and the maximum value was 8; however, for the observation point, values from 9 to 11 were observed. Through this study, it was possible to determine the characteristics of the wind environment in the area around high-rise buildings due to the building wind effect.

1. Introduction

Overcrowding and high-rise buildings in cities change the airflow pattern in the surrounding areas. Depending on the geometry, arrangement, and height of buildings, strong gusts and eddies are caused, lowering the wind comfort. The wind reflected by buildings is scattered to the surrounding area, causing various phenomena, such as localized gusts and eddies. These phenomena are collectively referred to as building wind. Building wind can always be found around buildings. It hardly causes problems around low-rise buildings, but the social damage caused by it has become an issue because more high-rise buildings have been built and the frequency of extreme weather events has increased. Thus, building wind has been established as a new form of urban pollution.
In countries, such as the United States, Japan, Germany, and the UK, it is mandatory to perform environmental impact assessments, following wind environment assessment guidelines and wind-way regulations, in the planning and design stages of the structure. As an example, the City of London in the UK provides general guidelines to be considered for designing a building in downtown London through the “Wind microclimate guidelines for developments in the city (City of London Corporation, 2019)” and performs preliminary impact assessments for building wind. It conducts wind tunnel tests, computational fluid dynamics (CFD) simulations, and cross-tabulation analyses according to the characteristics of the buildings because it is difficult to apply a unified standard due to the high variability in the field of turbulence. Meanwhile, the building design standards in South Korea suggest the design loads of buildings against the wind load, but do not present criteria for the impact of buildings on the surrounding area (Oh et al., 2020).
Recently, the building wind phenomenon has been recognized as a social problem, and the central and local governments have attempted to prepare measures. Basic research data, however, are still insufficient for preparing countermeasures suitable for the domestic situation. You et al. (2021) evaluated the wind environment around two apartment buildings using wind tunnel tests and CFD analyses. Choi et al. (2019) compared the wind pressure coefficient and natural ventilation performance according to the apartment layout through CFD, and roughly categorized the characteristics of the wind pressure coefficient (ventilation performance) according to the position. Lee et al. (2021) analyzed the wind pressure characteristics of an open-center elliptical building through a wind tunnel test and compared them with the standards for building structures. In this study, changes in the wind environment in Haeundae due to the building wind effect were quantitatively analyzed by performing on-site monitoring of the building wind near the ground surface in the impact range of the 12th typhoon OMAIS in 2021 for the areas around high-rise buildings.

2. Definition of Building Wind

When the wind hits a building, its turbulence energy increases due to the friction and resistance effects and a high wind speed is generated locally. In addition, when the wind flows along passages or narrow gaps between buildings, the wind speed is increased by the Venturi effect. All the airflows that are generated around buildings are collectively referred to as building wind. The building wind phenomenon significantly varies depending on the geometry and arrangement of buildings or the surrounding conditions, as shown in Fig. 1.
In building and wind dynamics (Kim, 2018), the building wind is defined as follows. Separated flow occurs when the wind is separated to the left and right sides after hitting a building. The wind that passed the corner of the building has a higher wind speed than that at its surroundings. Downslope wind occurs when the wind separated to the left and right sides is sucked into the low-pressure area generated behind the building. Thus, it is fast and headed down on the side of the building. High-rise buildings are the main cause of building wind because the downslope wind generated when the fast wind above the ground hits a high-rise building affects the airflow near the ground surface. In general, as the altitude increases, the wind speed increases exponentially. Therefore, strong downslope wind is highly likely to occur around high-rise buildings. Valley wind is the strong wind formed between buildings due to the overlapping between the separated flow and downslope wind. Moreover, there is backward flow, which flows in the opposite direction to the wind in the sky after a collision with a building; pilotis wind, which flows rapidly along openings, such as pilotis; and upward flow, which rises with eddies near the corners of buildings. Behind buildings, windless zones with low wind speed are formed along with large and small eddies that are generated by unstable airflows.

3. On-site Monitoring

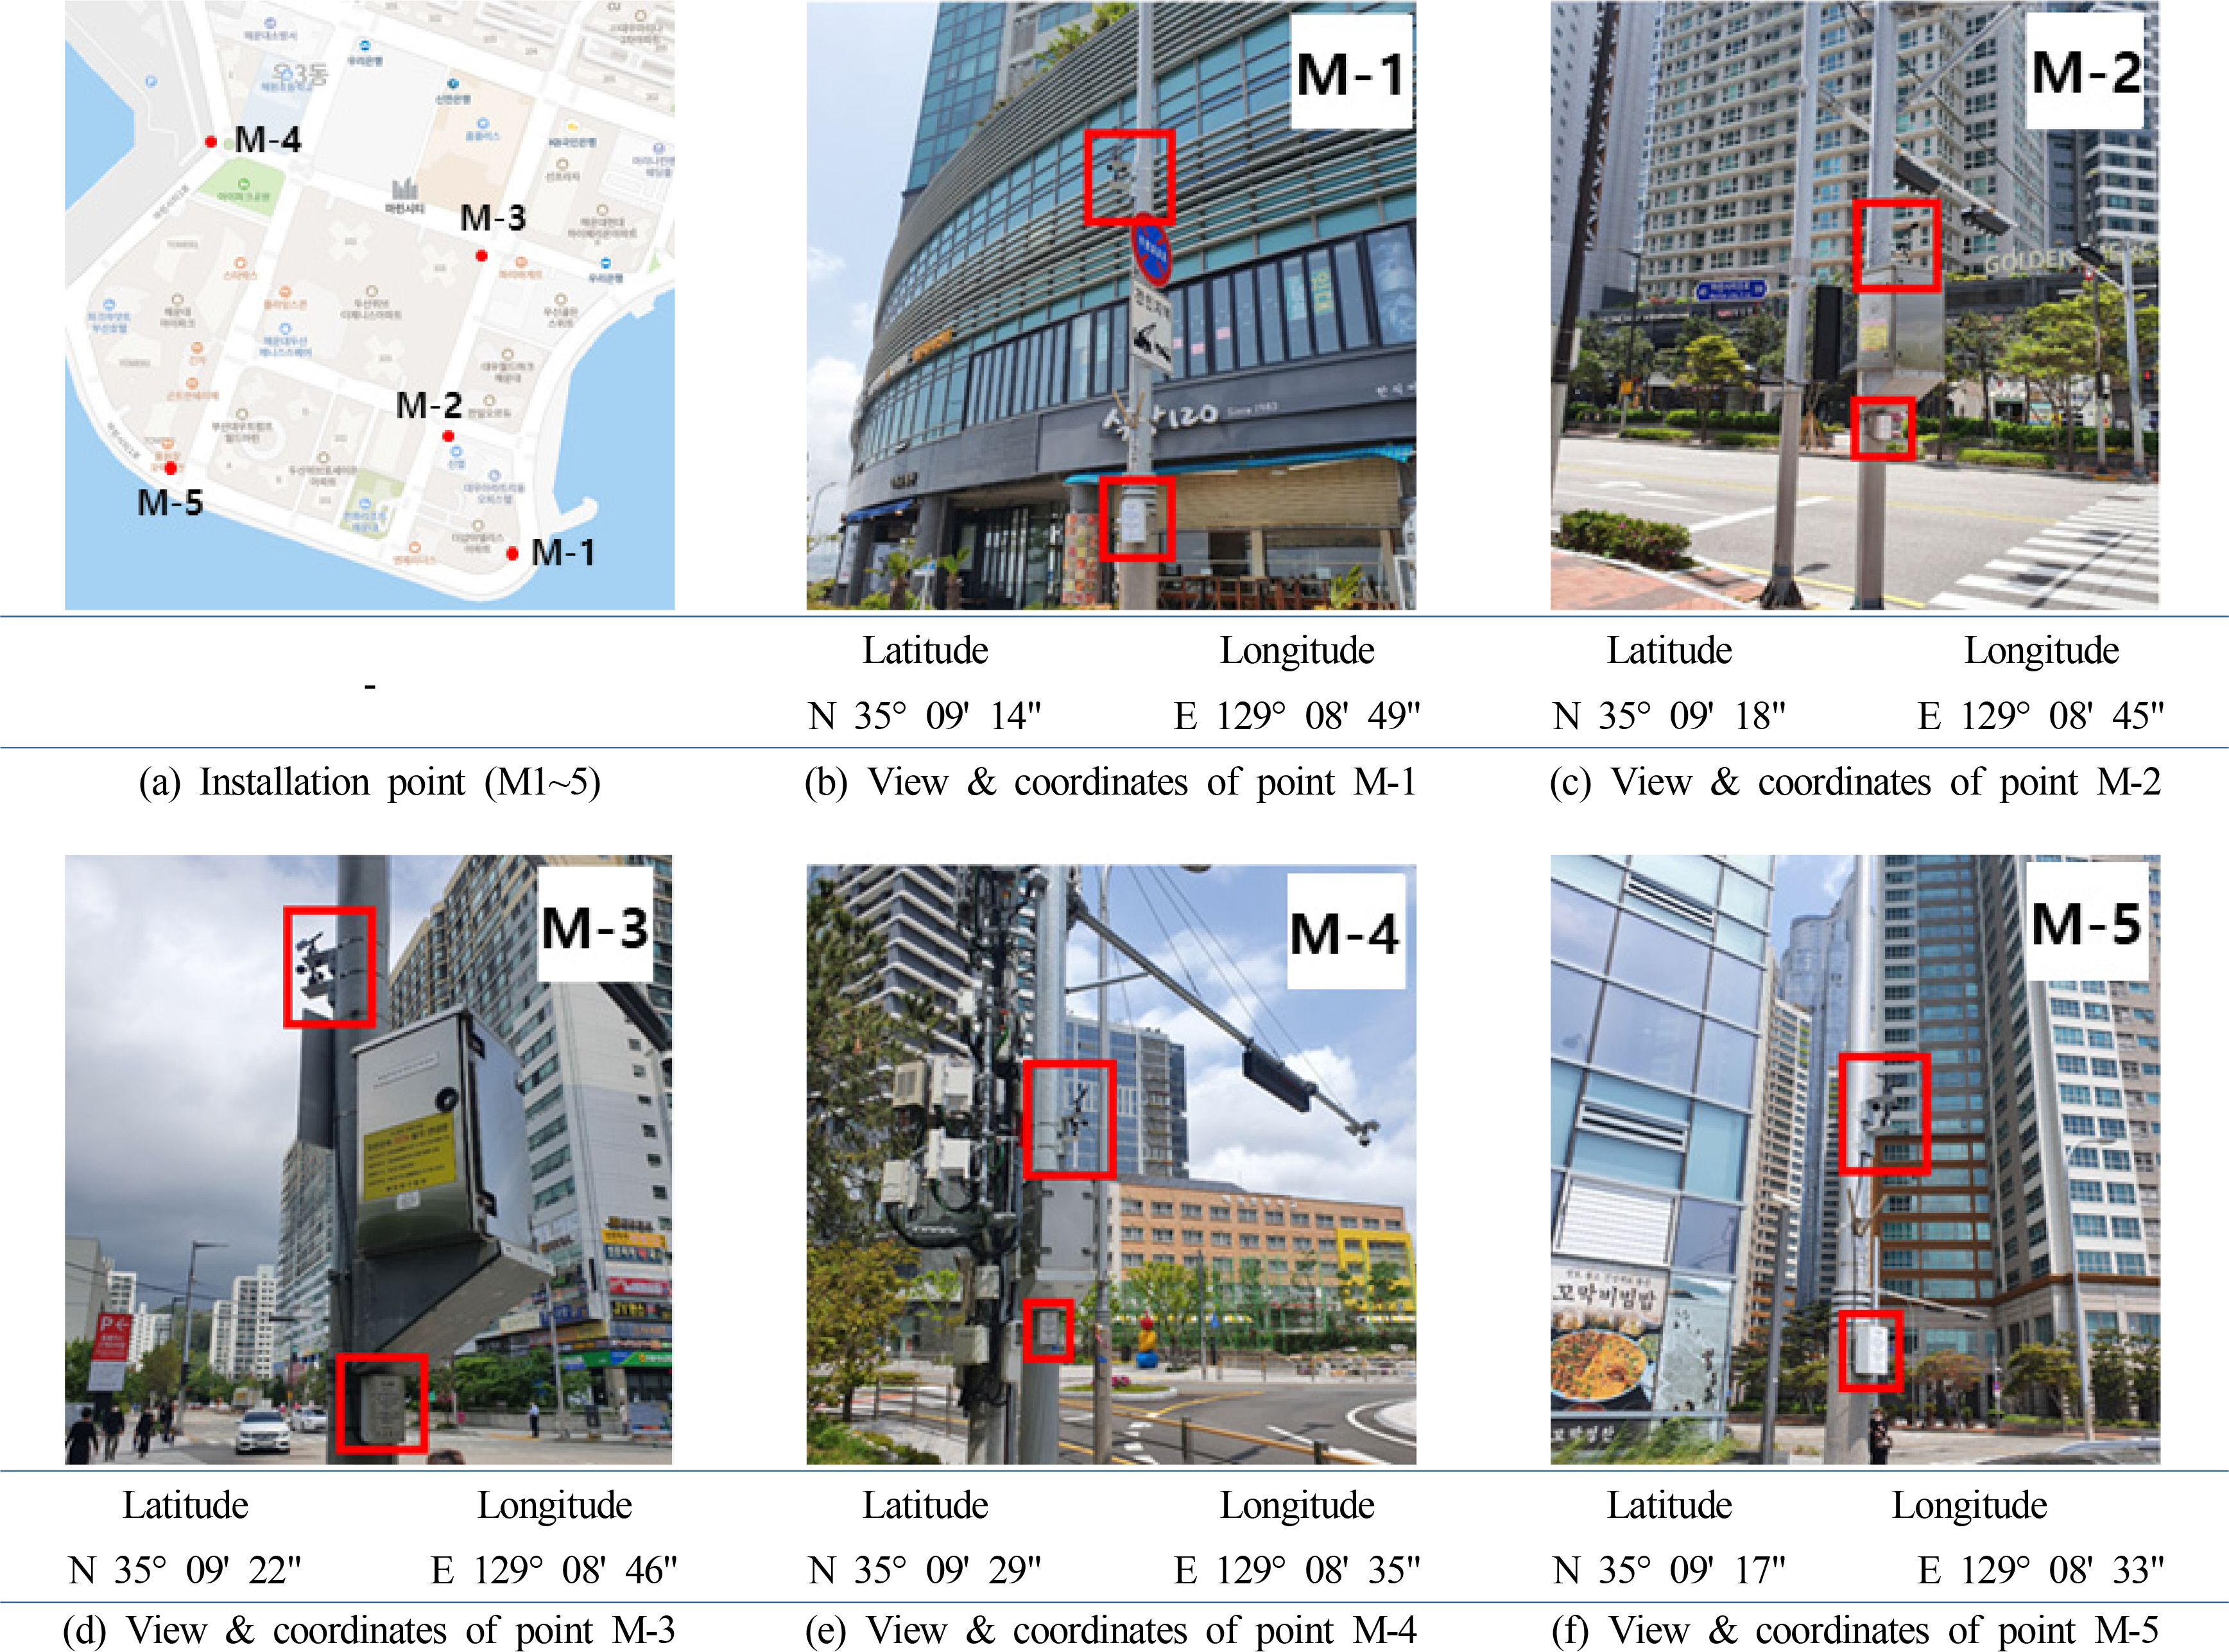
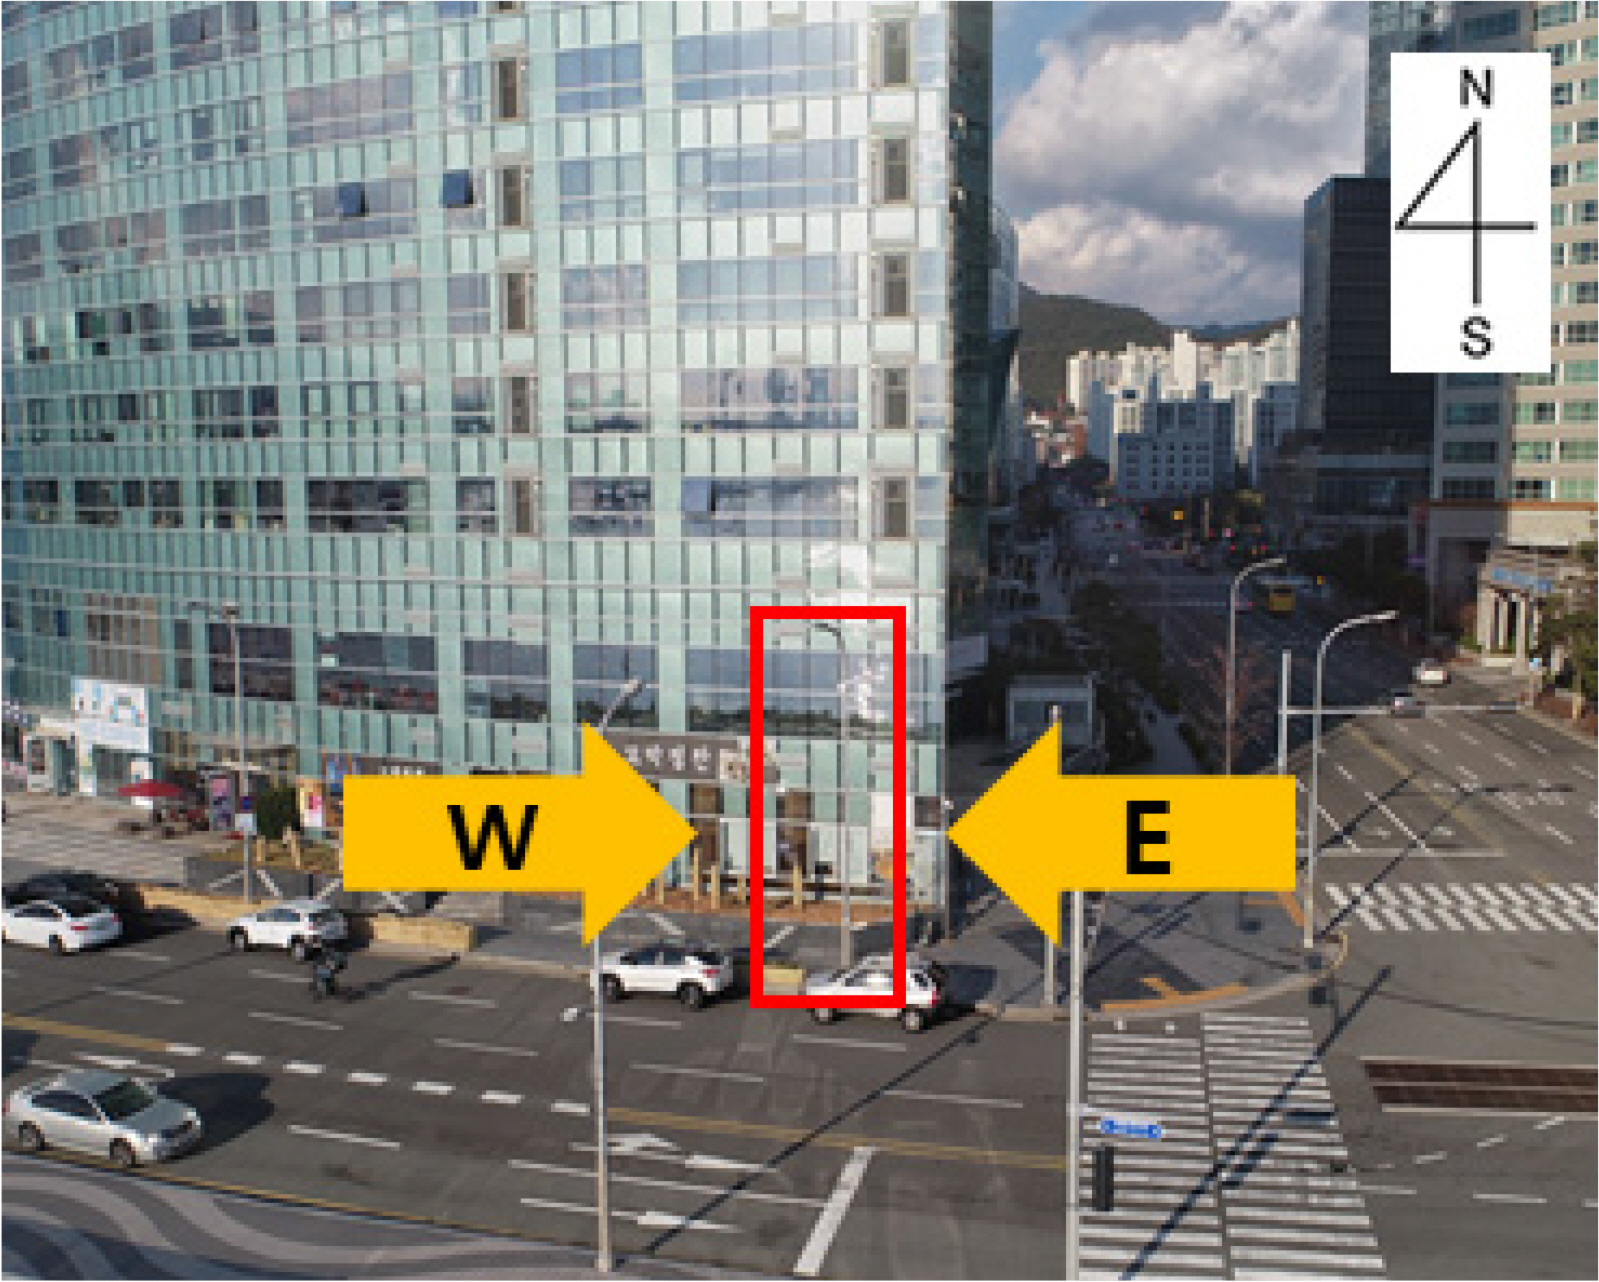
3.1 Research Site and Monitoring Points

The Marine City area in Haeundae-gu, Busan (Fig. 2) was selected as the research site because it is frequently damaged by building wind as it has a high density of high-rise buildings and is located in the coastal area vulnerable to storm and flood damage. In the area, high-rise apartment complexes, higher than 120 m, are densely located and there is also a skyscraper with a maximum height of approximately 301 m.
To observe the building wind in areas close to the high-rise buildings, fixed-type anemometers were installed in the research site. Through preliminary on-site measurements at 25 points during the invasion of the 9th typhoon Maysak and 10th typhoon Haishen in 2020, wind speed data were collected. The points with the highest wind speed were selected among the measurement points, and the anemometers were installed at five points (M-1 to M-5) as shown in Fig. 3. They were installed in structures located at the monitoring points at a height between 4.0 and 8.0 m considering the site conditions. The monitoring points were classified into the points at which the inflow of wind from the open sea is expected (M-1, 4, and 5), the points at which the highest wind speed was measured through the preliminary on-site survey (M-1, 2, and 5), and the intersection points (M-2, 3, and 5).

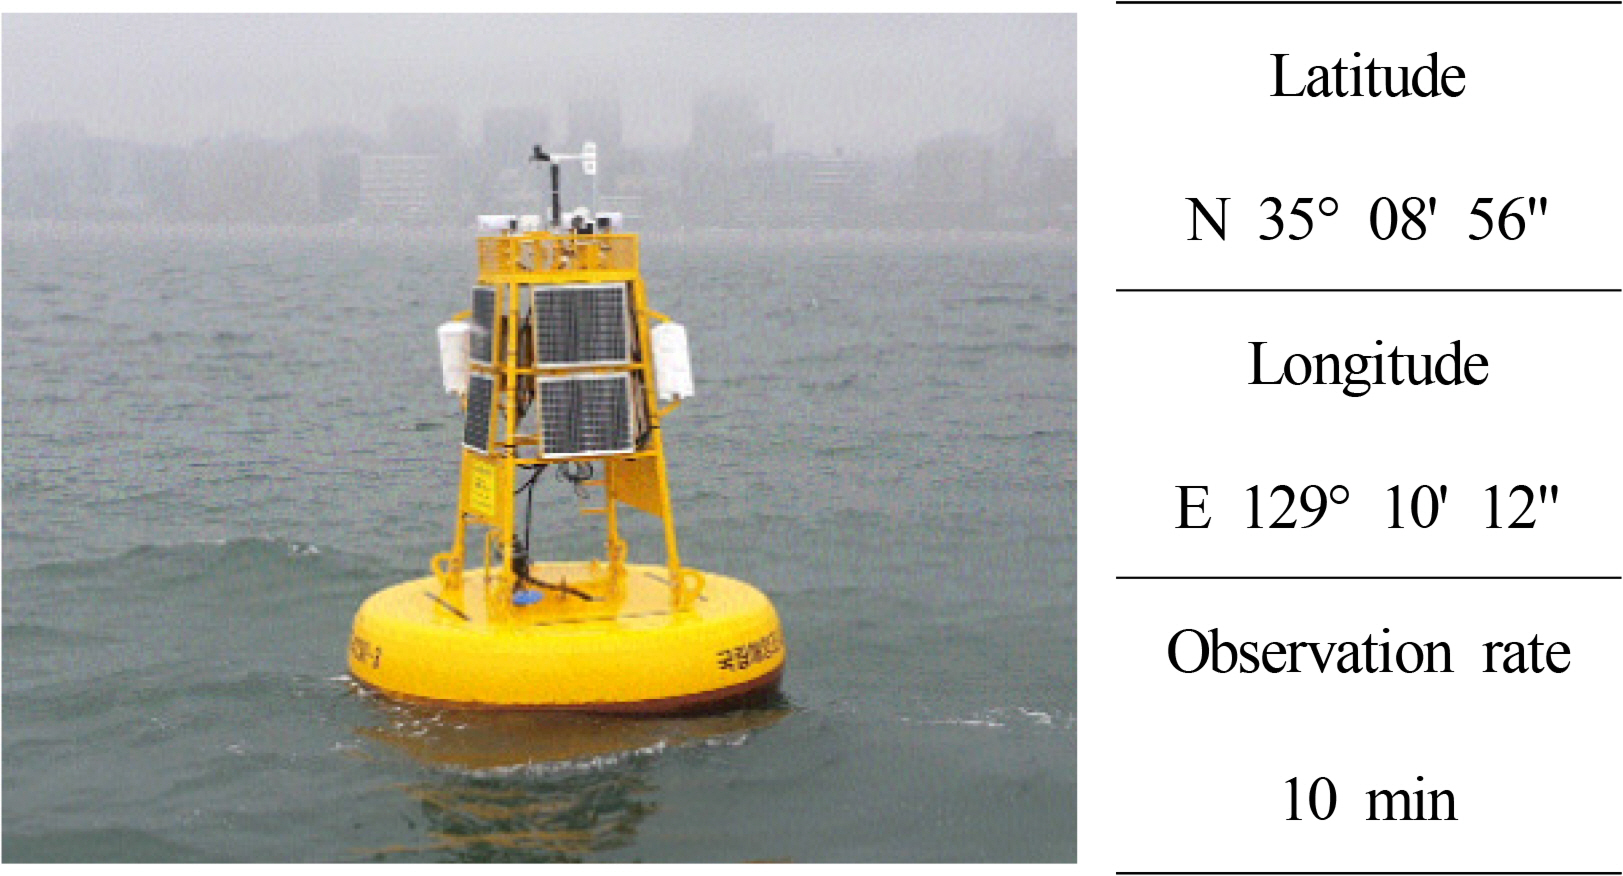
3.2 Monitoring Equipment and Method

The equipment for monitoring the building wind was designed in accordance with the “Standard specifications for automatic weather observation equipment” (KMA, 2016). According to the “Standard specification of observation sensors” (article 7) of this standard, the equipment had the performance presented in Table 1. According to the “Standard for signal and data processing” (article 9), four data were acquired per second (345,600 data/day), and the 1-min average wind direction and wind speed were calculated by averaging data for 60 s (240 data).
The Haeundae beach ocean observatory operated by the Korea Hydrographic and Oceanographic Agency (Fig. 4) is located approximately 2 km east of Marine City (Fig. 2). Considering that the impact range of the building wind is wider than the height of the buildings (Kim and Im, 2012), the location of the ocean observatory is within the building wind impact range of LCT, a skyscraper. The ocean observatory, however, was selected as a comparison group because it is located in the area closest to the research site and in the sea, with relatively little interference. Given that building wind causes local gusts within a short period of time (Roh, 2008), the 1-min average, which is the shortest time unit provided by the ocean observatory, was compared with the monitoring data of the research site.

3.3 The 12th Typhoon OMAIS

The 12th typhoon OMAIS in 2021 occurred in the sea, approximately 850 km south-southeast of Okinawa, Japan, at 21:00 on August 20th and disappeared at approximately 09:00 on August 24th. The record of the typhoon is presented in Table 2. The typhoon affected Korea from August 23rd, as shown in Fig. 5. Therefore, in this study, the data measured for 48 h from 00:00 on August 23rd to 00:00 on August 25th were analyzed.
The building wind is evaluated using methods such as the strong wind occurrence probability (probabilistic evaluation method), wind speed increase rate (relative evaluation method), and allowed wind speed (absolute evaluation method). Given that the application of the probabilistic evaluation that predicts the strong wind occurrence frequency was judged to be difficult in this study considering the short-term (2 days) data and small number of samples, the relative and absolute evaluation methods were used for building wind evaluation. As for the relative evaluation method, the reference wind speed was that at the weather station (ocean observatory). The wind speed ratio (R) at each point compared to the reference wind speed was derived to calculate the wind speed increase rate by the building wind effect. as expressed in Eq. (1). In the case of the absolute evaluation method, the Beaufort wind scale proposed by Lawson and Penwarden (1975) was applied, as presented in Table 3.
(1)
windspeedratio(R)=windspeedMiwindspeedoceanobservatory(m/s)

4. Monitoring Results

4.1 One-minute Average Wind Speed of the Ocean Observatory

For the time period between 00:00 on August 23rd and 00:00 on August 25th, which was the impact range of typhoon OMAIS, the Marine City on-site monitoring data were compared with the 1-min average wind speed data of the ocean observatory.
Fig. 6 shows the 1-min average wind speed data (ksoe-2021-079i1.jpg) and the 1-h average wind direction to identify the atmospheric wind direction (ksoe-2021-079i2.jpg), which were provided by the Haeundae beach ocean observatory. At the ocean observatory, a maximum wind speed of 18.5 m/s (southwest) was recorded as the first peak at 01:07 on August 24th after the invasion of the typhoon. At 06:00 on August 24th, a maximum wind speed of 15.5 m/s (southwest, west-southwest) was recorded as the second peak as the wind speed increased again even after the typhoon changed into an extratropical cyclone. The wind direction did not show a certain tendency when the observatory was in the indirect impact range of the typhoon. After 14:00 on August 24th when it was in the direct impact range of the typhoon, however, the wind direction was observed in the order of northeast → southeast → southwest, showing an obvious clockwise direction as in an area located on the right side of a typhoon’s path.

4.2 Marine City Wind Speed and Wind Speed Ratio (Relative Evaluation)

Fig. 6 shows the 1-min average wind speed (ksoe-2021-079i3.jpg) and 1-h average wind direction (ksoe-2021-079i4.jpg
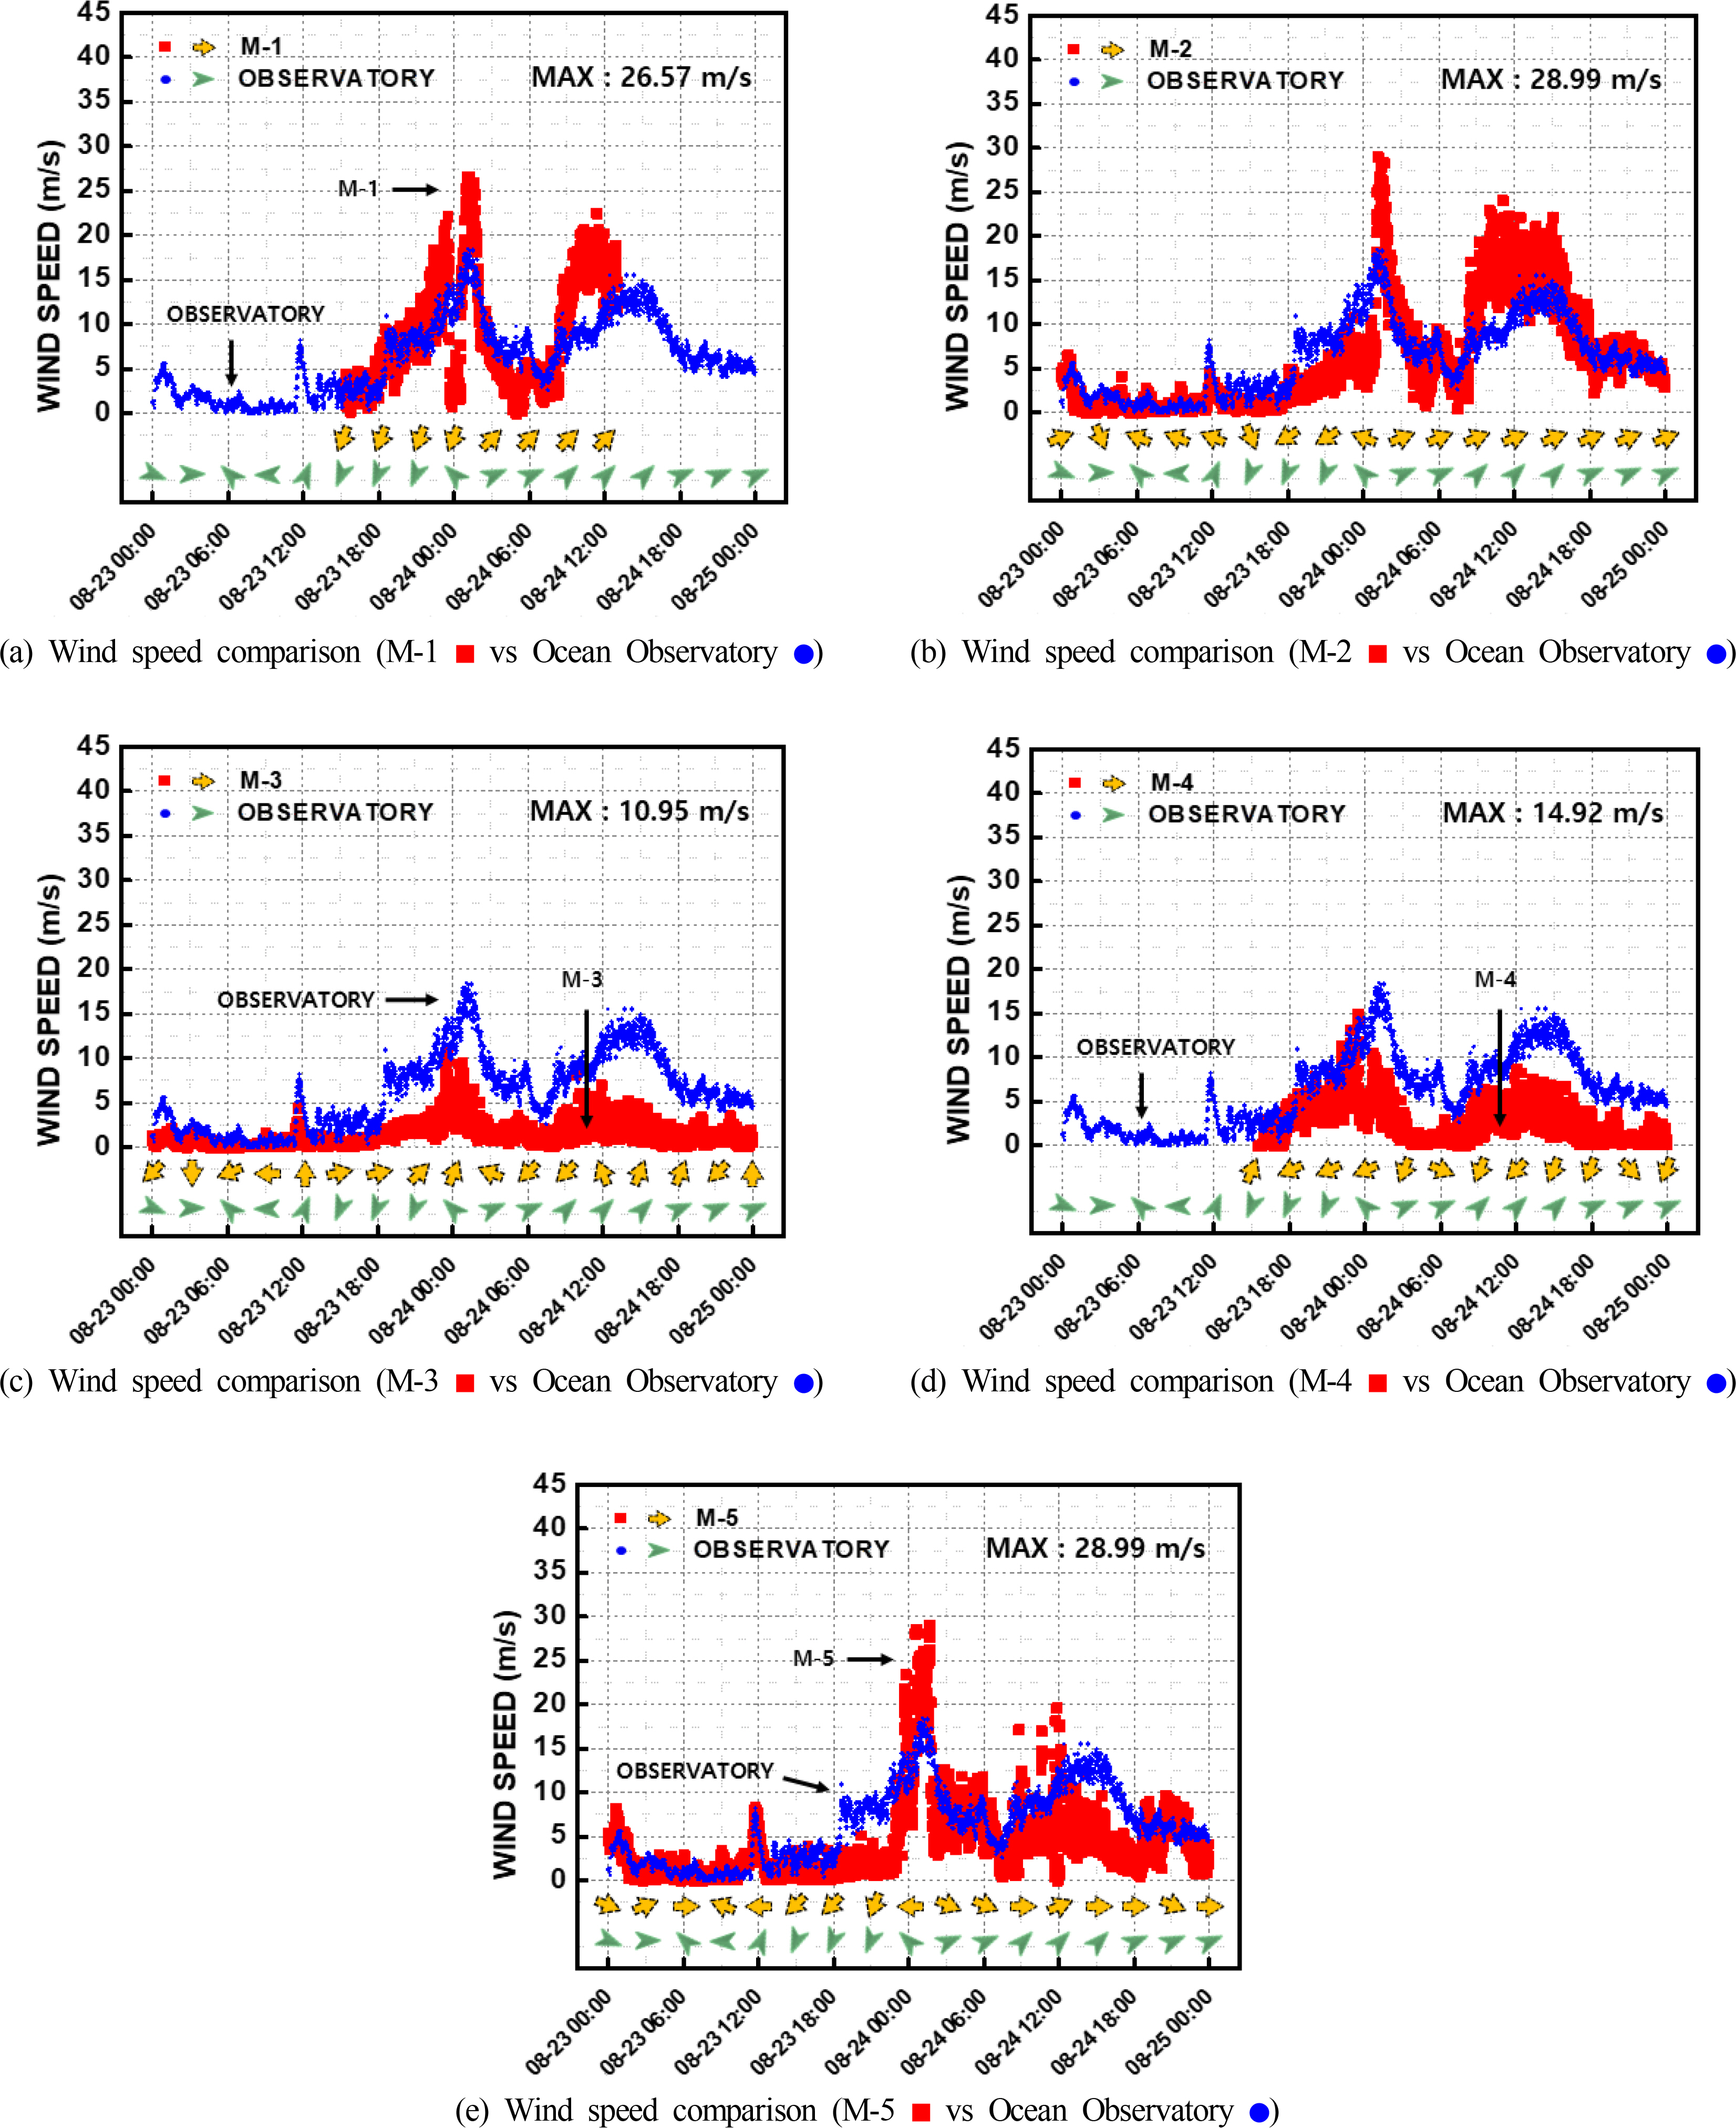
) measured at five points (M-1 to M-5) in Marine City. Fig. 7 shows the wind speed ratio at each point (ksoe-2021-079i5.jpg, ksoe-2021-079i6.jpg) by applying Eq. (1). As for the calculation of the wind speed ratio, time points at which the wind speed was not measured were excluded. Some wind speed ratios were excessive (5 to 25), and this appears to be because the wind speed measured at the ocean observatory was relatively low. Therefore, in this study, the wind speed ratio was calculated for cases where the wind speed at the ocean observatory was 2 m/s or higher to derive the wind speed ratio at significant wind speed.

4.2.1 Point M-1

Point M-1 was located on the eastern part of the Marine City coastal road. Given that it was directly in contact with the coast, the easterly sea wind could be measured without interference. As it was located on the side of a high-rise building, high wind speed caused by the separated flow and downslope wind was expected.
Fig. 6(a) shows the 1-min average wind speed at point M-1. The maximum wind speed (at 01:16 on August 24th) was measured to be 26.57 m/s (southwest) and the wind speed at the ocean observatory at the same time was 16.9 m/s (southwest), indicating that the wind speed at point M-1 was 1.57 times higher.
The wind speed ratio at point M-1 ranged from 0 to 2.62 as shown in Fig. 7(a). The maximum wind speed ratio (at 17:49 on August 23rd) was found to be 2.62 when the wind speed at point M-1 was 5.51 m/s (north-northeast) and that at the ocean observatory was 2.1 m/s (northeast). Wind speed ratios less than 1.0 accounted for 46% of the wind speeds, whereas those equal to or higher than 1.0 represented 54% of them, indicating that 54% of the wind speeds were higher than the reference wind speed due to the building wind effect.
Point M-1 was located on the side of a building (Fig. 8). Therefore, the wind direction was parallel to the direction of the outer wall of the building. The north-northeast wind direction was mostly observed when the atmospheric wind direction was north, and the southwest wind direction when it was south. The wind speed ratio tended to be high when the atmospheric wind direction was parallel to the outer wall direction as in the time periods between 18:00 and 22:00 on August 23rd and between 09:00 and 12:00 on August 24th.

4.2.2 Point M-2

At point M-2, a 10-s average wind speed of approximately 30 m/s (an instantaneous wind speed of 46 m/s) was measured through on-site observation during the invasion of 9th typhoon Maysak in 2020. Given that point M-2 was located at an intersection between high-rise buildings, high wind speed caused by valley wind was predicted.
Fig. 6(b) shows the 1-min average wind speed at point M-2. The maximum wind speed (at 01:10 on August 24th) was measured to be 28.99 m/s (southwest) and the wind speed at the ocean observatory at the same time was 17 m/s (southwest), showing that the wind speed at point M-2 was 1.70 times higher.
The wind speed ratio at point M-2 ranged from 0 to 2.92 as shown in Fig. 7(b). The maximum wind speed ratio (at 11:06 on August 24th) was found to be 2.92 when the wind speed at point M-2 was 24 m/s (southwest) and that at the ocean observatory was 8.2 m/s (southwest). Wind speed ratios less than 1.0 accounted for 59% of the wind speeds, whereas those equal to or higher than 1.0 represented 41% of them, meaning that 41% of the wind speeds were higher than the reference wind speed due to the building wind effect. At point M-2, the wind speed ratio tended to be high under the southwest wind condition (after 09:00 on August 24th). This appears to be because the wind speed was further increased by the downslope wind as high-rise buildings were densely located on the west side of point M-2.

4.2.3 Point M-3

At point M-3, large social damage occurred, including damage to many windows in shopping malls, during the invasion of 9th typhoon Maysak in 2020. In addition, as point M-3 was located at an intersection close to high-rise buildings, as was the case with point M-2, high wind speed caused by valley wind was predicted.
Fig. 6(c) shows the 1-min average wind speed at point M-3. The maximum wind speed (at 23:33 on August 23rd) was measured to be 10.95 m/s (south-southwest) and the wind speed at the ocean observatory at the same time was 12.8 m/s (southeast), showing that the wind speed at point M-3 was lower.
The wind speed ratio at point M-3 ranged from 0 to 0.87, as shown in Fig. 7(c). The maximum wind speed ratio (at 09:55 on August 24th) was found to be 0.87 when the wind speed at point M-3 was 8.64 m/s (east-southeast) and that at the ocean observatory was 9.2 m/s (southwest). Wind speed ratios less than 1.0 represented 100% of the wind speeds, indicating that all wind speeds were lower than the reference wind speed. Although point M-3 was located at an intersection close to point M-2 with a distance of approximately 230 m, the increase in wind speed caused by building wind did not occur and the wind speed rather sharply decreased. This appears to be due to the energy dissipation effect of the trees (Fig. 9) in the apartment complexes adjacent to point M-3.
Given that point M-3 was located at an intersection, as was the case with point M-2, the wind was observed in 360° directions. While point M-2 was highly correlated to the wind direction at the ocean observatory, the wind direction at point M-3 was less correlated. This appears to be due to the generation of a complex airflow pattern caused by the turbulence created in the energy dissipation process by the trees.

4.2.4 Point M-4

As point M-4 was located in the western part of the Marine City area, it was expected that the westerly sea wind could be measured. However, due to the influence of the trees (Fig. 10) planted in the Pusan Yachting Center, as was also the case with point M-3, relatively low wind speed was observed.
Fig. 6(d) shows the 1-min average wind speed at point M-4. The maximum wind speed (at 23:27 on August 23rd) was measured to be 14.92 m/s (northeast) and the wind speed at the ocean observatory at the same time was 13.3 m/s (east-southeast), indicating that the wind speed at point M-4 was 1.12 times higher.
The wind speed ratio at point M-4 ranged from 0 to 2.13 as shown in Fig. 7(d). The maximum wind speed ratio (at 18:00 on August 23rd) was found to be 2.13 when the wind speed at point M-4 was 4.26 m/s (east) and that at the ocean observatory was 2.0 m/s (northeast). Wind speed ratios of 1.0 or higher accounted for only 2.3% of the wind speeds, whereas wind speed ratios less than 1.0 represented 97.7% of them, and 79% of the cases showed a wind speed ratio less than 0.5. It appears that the low wind speed at point M-4 was also caused by the energy dissipation effect of the trees.

4.2.5 Point M-5

Point M-5 was located in the southern part of the Marine City coastal road. As it was directly in contact with the coast, the southerly sea wind could be measured. Due to the location of point M-5 at the corner of a high-rise building, high wind speed caused by the separated wind was expected.
Fig. 6(e) shows the 1-min average wind speed at point M-5. The maximum wind speed was measured to be 28.99 m/s (west-southwest) at 01:40 on August 24th. In this instance, the wind speed at the ocean observatory was 14.1 m/s (southwest), showing that the wind speed at point M-5 was 2.05 times higher.
The wind speed ratio ranged from 0 to 2.32 as shown in Fig. 7(e). The maximum wind speed ratio (at 10:38 on August 24th) was found to be 2.32 when the wind speed at point M-5 was 16.96 m/s (west) and that at the ocean observatory was 7.3 m/s (southwest). Wind speed ratios less than 1.0 accounted for 76% of the wind speeds, whereas those equal to or higher than 1.0 represented 24% of them, indicating that 24% of the wind speeds were higher than the reference wind speed due to the building wind effect.
Given that point M-5 was located on the side of a building (Fig. 11), east and west wind directions parallel to the building’s outer wall direction were mostly observed. The wind speed ratio was higher when the atmospheric wind directions were east and west than when they were south and north.

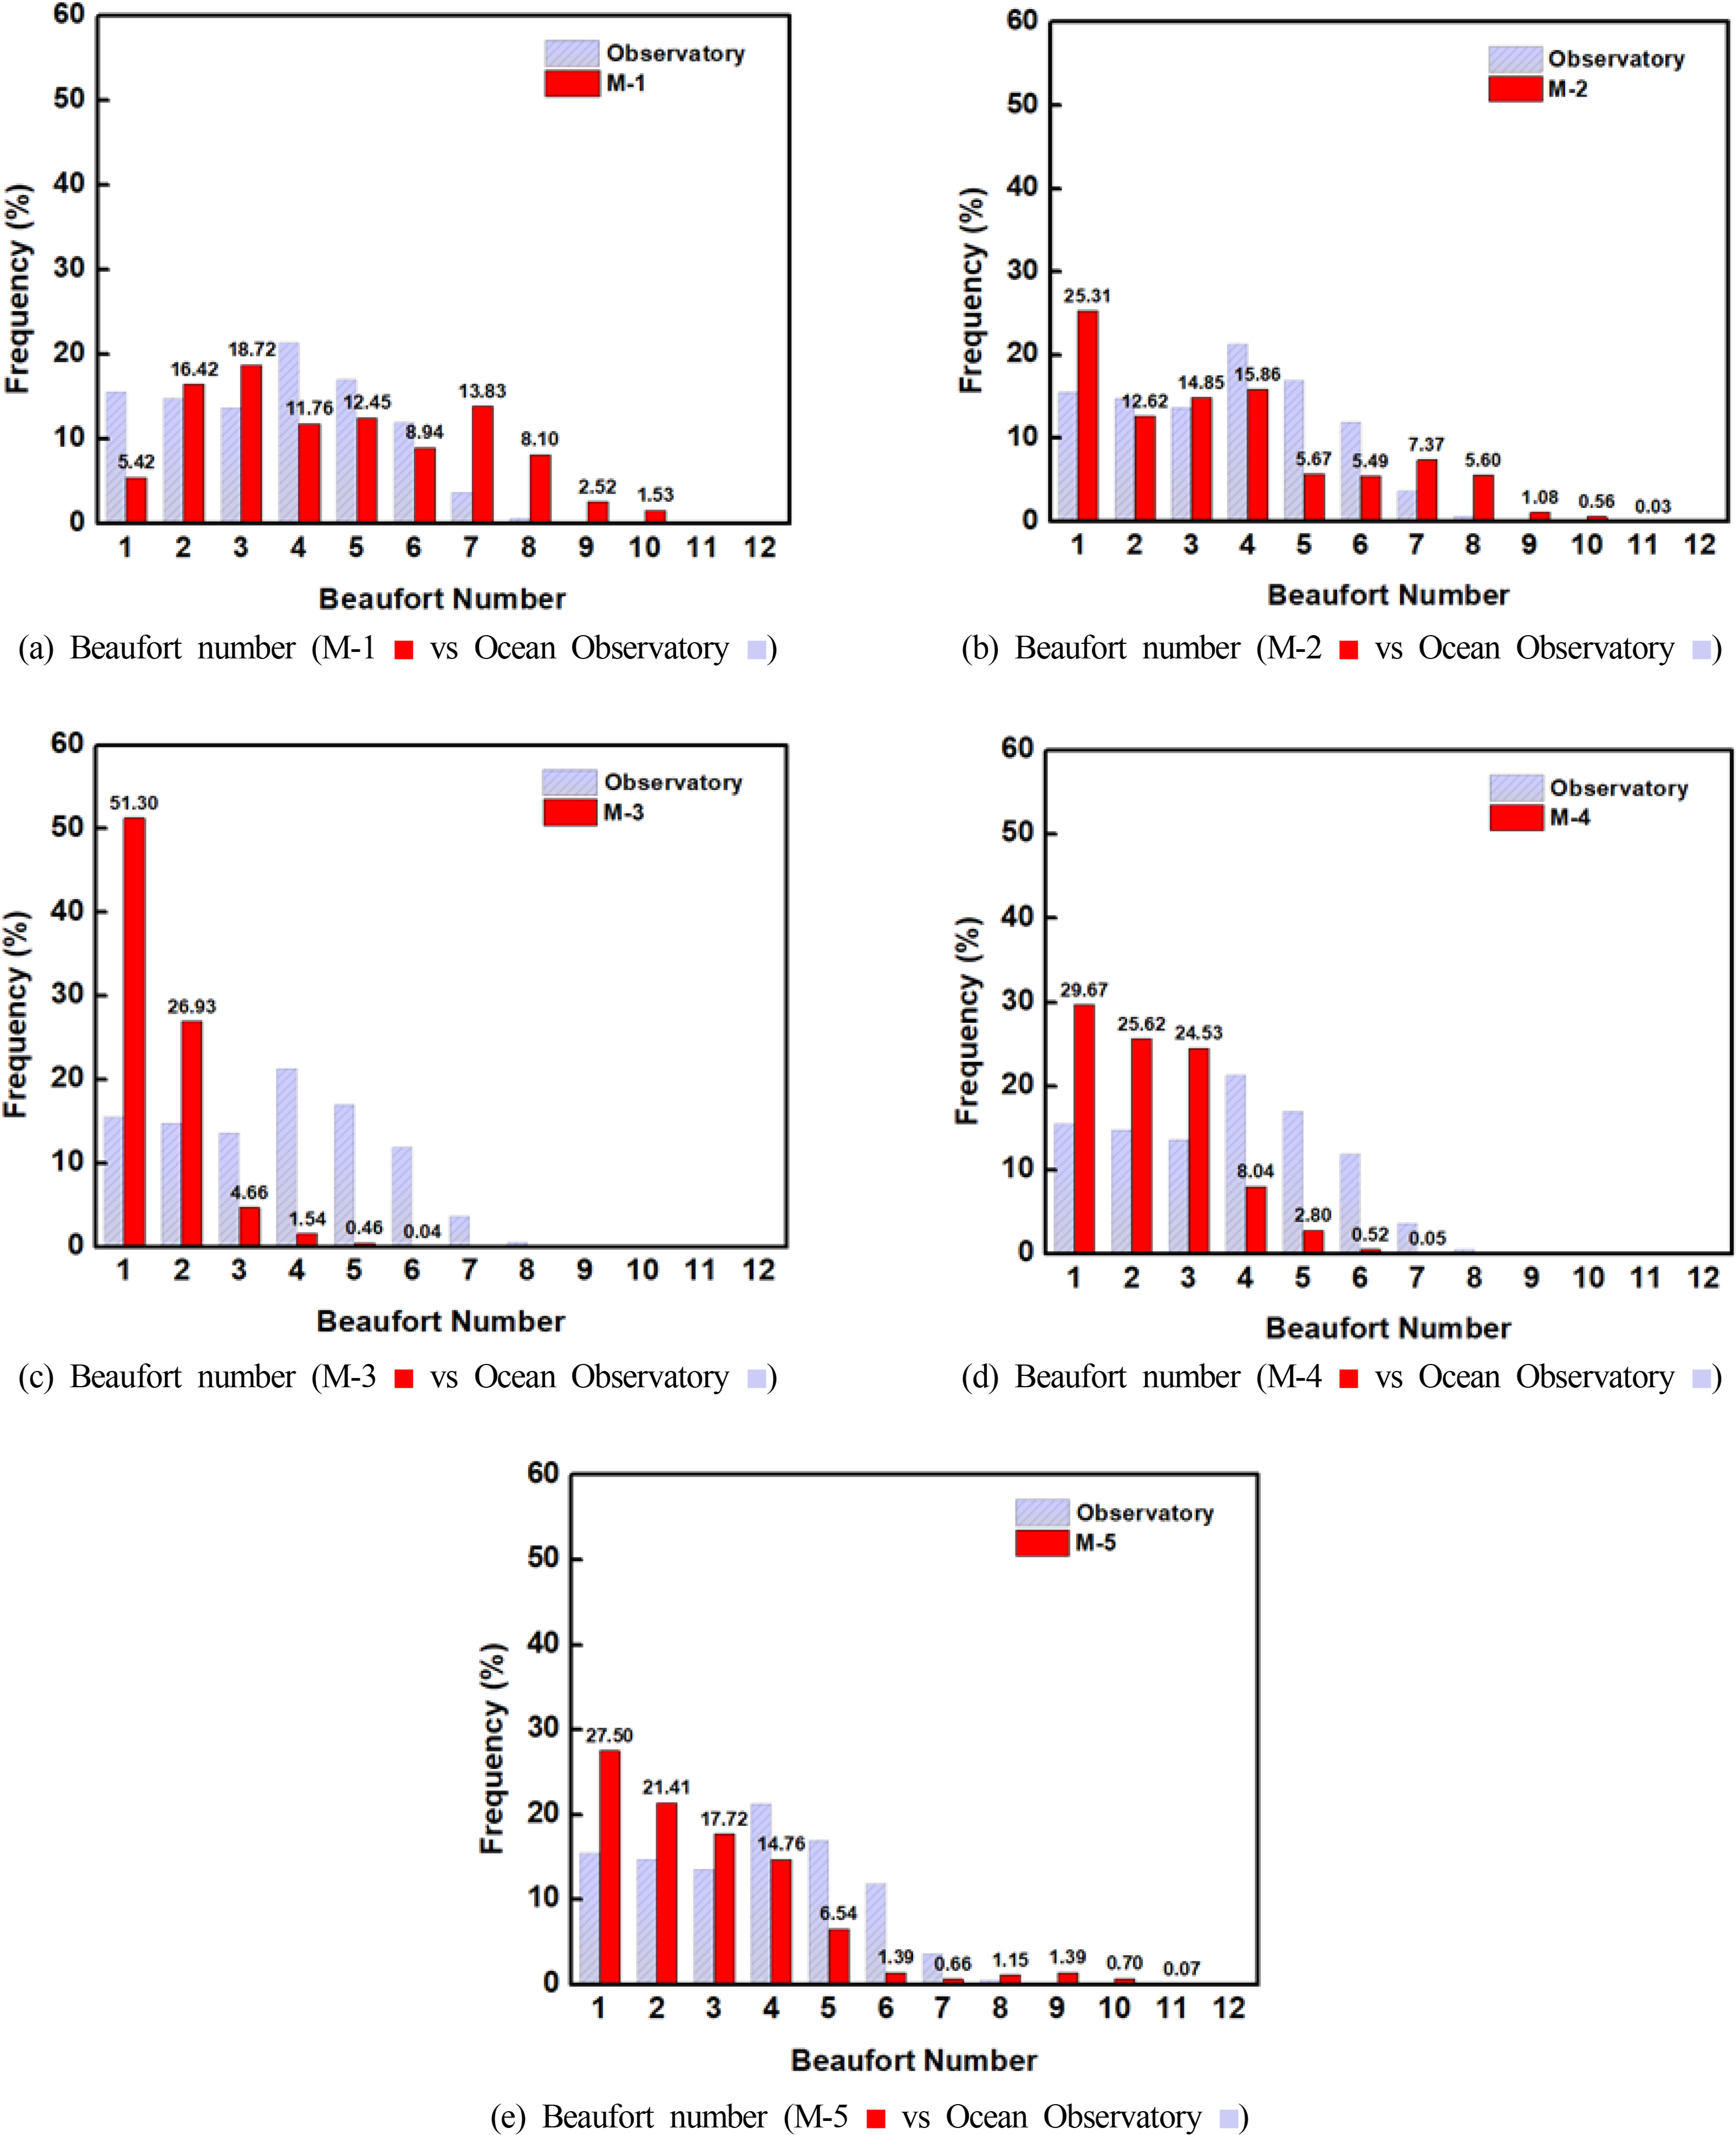
4.3 Beaufort Number at Marine City Points (Absolute Evaluation)

In Section 4.2, the wind speed increase rate was analyzed through a relative evaluation. As the damage created by wind is caused by high wind speed, it is necessary to evaluate the absolute value of the increase in wind speed generated by the building wind effect. Therefore, the Beaufort wind scale (Table 3) was applied to the wind speed data measured at the ocean observatory and five points in Marine City (M-1 to M-5), and the frequency of the Beaufort number is shown in Fig. 12. Missing data and Beaufort number 0 (calm) were excluded for the convenience of data analysis.
For the wind speed data measured at the ocean observatory, the Beaufort number ranged from 0 to 9. The proportions of Beaufort numbers from 0 to 8 were 1.88%, 15.50%, 14.74%, 13.59%, 21.29%, 16.93%, 11.88%, 3.62%, and 0.56%, respectively, indicating that the numbers were relatively evenly distributed from 1 to 6. The mode was found to be 4 (moderate breeze) and the maximum value was 8 (gale). The results at each point are shown in Figs. 12(a) to 12(e).
Fig. 12(a) shows the Beaufort numbers of wind speeds measured at point M-1( ksoe-2021-079i3.jpg). The numbers ranged from 0 to 10, and their proportions were 5.42%, 16.42%, 18.72%, 11.76%, 12.45%, 8.94%, 13.83%, 8.10%, 2.52%, and 1.53%, respectively. The mode was found to be 3 (gentle breeze) and the maximum value was 10 (storm). Compared to the wind speed data at the ocean observatory, Beaufort numbers 1, 4, 5, and 6 showed a decrease in frequency, whereas Beaufort numbers 2, 3, 7, and 8 presented an increase in frequency. Wind speeds corresponding to Beaufort numbers 9 and 10 (20.8 to 28.4 m/s), which were not observed at the ocean observatory, were observed here.
Fig. 12(b) shows the Beaufort numbers of the wind speeds measured at point M-2( ksoe-2021-079i3.jpg). The numbers ranged from 0 to 11, and their proportions were 25.31%, 12.62%, 14.85%, 15.86%, 5.67%, 5.49%, 7.37%, 5.60%, 1.08%, 0.56%, and 0.03%, respectively. The mode was found to be 1 (light air) and the maximum value was 11 (violent storm). Compared to the wind speed data at the ocean observatory, Beaufort numbers 2, 4, 5, and 6 showed a decrease in frequency, whereas numbers 1, 3, 7, and 8 presented an increase in frequency. Wind speeds corresponding to Beaufort numbers 9, 10, and 11 (20.8 to 32.6 m/s), which were not observed at the ocean observatory, were observed here.
Fig. 12(c) shows the Beaufort numbers of wind speeds measured at point M-3( ksoe-2021-079i3.jpg). The numbers ranged from 0 to 6, and their proportions were 51.30%, 26.93%, 4.66%, 1.54%, 0.46%, and 0.04%, respectively. The mode was found to be 1 (light air) and the maximum value was 6 (strong breeze). Compared to the wind speed data at the ocean observatory, Beaufort numbers from 3 to 6 showed a decrease in frequency, whereas numbers 1 and 2 had a significant increase in frequency.
Fig. 12(d) shows the Beaufort numbers of wind speeds measured at point M-4( ksoe-2021-079i3.jpg). The numbers ranged from 0 to 7, and their proportions were 29.67%, 25.62%, 24.53%, 8.04%, 2.80%, 0.52%, and 0.05%, respectively. The mode was found to be 1 (light air) and the maximum value was 7 (near gale). Compared to the wind speed data at the ocean observatory, Beaufort numbers from 4 to 7 showed a decrease in frequency, whereas numbers from 1 to 3 presented a significant increase in frequency.
Fig. 12(e) shows the Beaufort numbers of wind speeds measured at point M-5( ksoe-2021-079i3.jpg). The numbers ranged from 0 to 11, and their proportions were 27.50%, 21.41%, 17.72%, 14.76%, 6.54%, 1.39%, 0.66%, 1.15%, 1.39%, 0.70%, and 0.07%, respectively. The mode was found to be 1 (light air) and the maximum value was 11 (violent storm). Beaufort numbers from 4 to 7 showed a decrease in frequency, whereas numbers 1, 2, 3, and 8 had an increase in frequency. Wind speeds corresponding to Beaufort numbers 9, 10, and 11 (20.8 to 32.6 m/s), which were not observed at the ocean observatory, were observed at this point.
At points M-1, M-2, and M-5, where the wind speed increased, Beaufort numbers from 4 to 6 (5.5 to 13.8 m/s) tended to show a decrease in frequency, whereas numbers from 1 to 3 (0.2 to 5.4 m/s) and 7 to 11 (13.9 to 32.6 m/s) presented an increase in frequency. In other words, the wind speed corresponding to the middle classes was decreased by the blockage of buildings or increased by the building wind effect depending on the conditions. It is considered necessary to conduct further research on factors that affect building wind through long-term monitoring. Meanwhile, at points M-3 and M-4, where the wind speed decreased due to the wind-proof effect of trees, Beaufort numbers of 4 and above (over 7.9 m/s) tended to show a significant decrease in frequency, whereas Beaufort numbers from 1 to 3 (0.2 to 5.4 m/s) had a significant increase in frequency.

5. Conclusion

To evaluate the building wind effect on the approach of typhoon, we investigated the characteristics of wind profile over skyscraper towers surround the other buildings in Haeundae region, Busan, South Korea. In this study, five anemometers were installed in Haeundae Marine City where high-rise buildings are densely located and on-site monitoring of typhoon OMAIS was performed to examine the building wind phenomenon. For result analysis, a relative evaluation through the calculation of the wind speed ratio (wind speed increase rate) and an absolute evaluation based on the Beaufort wind scale were performed. The following conclusions could be drawn.
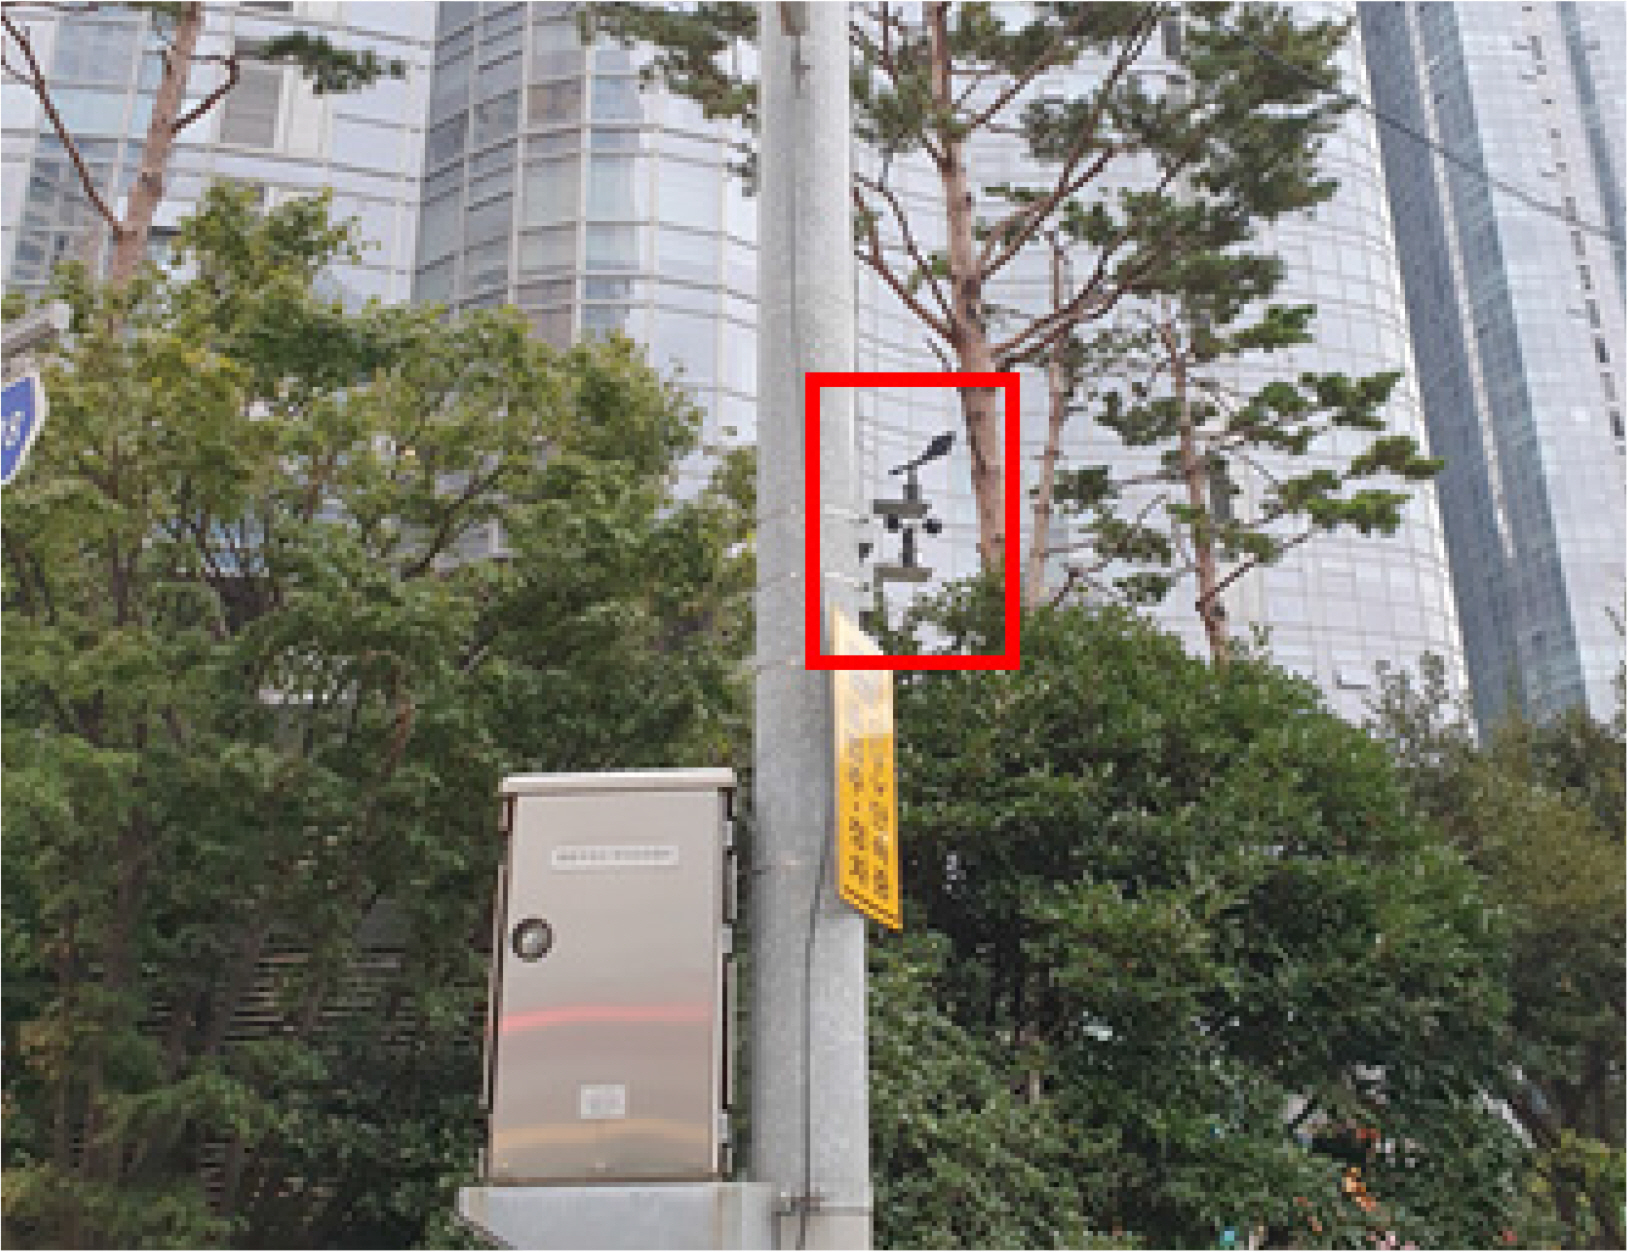
  1. Among points M-1, M-2, and M-5 at which the wind speed was significantly increased, point M-2 had the highest wind speed, showing a maximum wind speed of 28.99 m/s and a maximum wind speed ratio of 2.92. Different building wind patterns were observed depending on the location characteristics of each point. At points M-1 and M-5, which were located on the side of a high-rise building, the main wind direction was found to be parallel to the building direction and the wind speed ratio was high when the atmospheric wind direction was parallel to the building outer wall direction. The wind direction at point M-2, which was located at an intersection, was highly correlated with that at the ocean observatory located in the sea, and the wind speed ratio was high when the atmospheric wind direction was west. This appears to be because high-rise buildings were located on the west side of point M-2. At points M-3 and M-4, the wind speed ratio was found to be less than 1 and the wind speed rather decreased even though they were located in areas where high-rise buildings were densely located. This appears to be due to the influence of the trees planted near the observation equipment. A previous study (Kim et al., 2013) analyzed the wind-proof effect of planting windbreak forest through a wind tunnel test, and it confirmed that the windbreak forest has the effect of decreasing the wind speed by at least 47%. In this study, the wind-proof effect of trees could also be observed through actual monitoring data.

  2. When the absolute values of the wind speed were analyzed through the Beaufort wind scale, it was found that Beaufort numbers from 7 to 11, which belong to the dangerous wind speed range, showed an increase in frequency at points M-1, M-2, and M-5, where the wind speed was significantly increased. Beaufort numbers from 1 to 3, which correspond to low wind speeds, also showed an increase in frequency. This indicates that the wind speed was decreased by the blockage effect of buildings or increased by the building wind effect depending on the conditions. Thus, further research is required on various variables that cause building wind. At points M-3 and M-4, where the wind speed decreased due to the wind-proof effect of trees, the degree of decrease in wind speed could be quantitatively identified because Beaufort numbers of 4 and above showed a significant decrease in frequency, whereas those from 1 to 3 presented a significant increase in frequency.

  3. Based on the above results, the areas with risk due to building wind are shown in Fig. 13. As the number of measurement points is small compared to the range of the research site, it is difficult to identify the risk level for all sections in the site. It seems necessary to perform high-density monitoring by installing more monitoring points or to utilize computational fluid dynamics (CFD) to identify the risk level for the entire range of the research site. It is also considered necessary to conduct further research with high reliability through cross-analysis between monitoring and CFD.

  4. In addition, 1-min average data were used for a comparison with the wind speed data of the ocean observatory, but it is considered necessary to analyze the 3-s average (instantaneous wind speed) or 1-s average wind speed data due to the characteristics of the building wind, which may cause gusts and damage within a short period of time. As an example, at point M-2 where the highest wind speed was observed, the maximum wind speed was calculated to be 48.24 m/s when the 3-s average wind speed was used and 53.20 m/s when the 1-s average wind speed was used. These were 1.66 and 1.83 times higher than 28.99 m/s, which was the maximum average wind speed for 1 min. Given that the outer walls, windows, and glass of buildings can be damaged even by momentary strong winds, it is necessary through further research to analyze the risk level of the building wind using an average wind speed with a short period.

Conflict of Interest

No potential conflict of interest relevant to this article was reported.

Funding

This research was supported by a grant (20011068) of Regional Customized Disaster-Safety R&D Program funded by Ministry of Interior and Safety (MOIS, Korea).

Fig. 1.
Type of building wind
ksoe-2021-079f1.jpg
Fig. 2.
Location and drone photo of research site
ksoe-2021-079f2.jpg
Fig. 3.
Installation point of wind speed & wind direction observation equipment
ksoe-2021-079f3.jpg
Fig. 4.
Haeundae beach ocean observatory (Korea hydrographic and oceanographic agency)
ksoe-2021-079f4.jpg
Fig. 5.
Path of typhoon OMAIS
ksoe-2021-079f5.jpg
Fig. 6.
Comparison of wind speed at each point (Marine City vs Ocean Observatory)
ksoe-2021-079f6.jpg
Fig. 7.
Frequency distribution of wind speed ratio at each point (Marine City/Ocean Observatory)
ksoe-2021-079f7.jpg
Fig. 8.
Main wind direction (M-1)
ksoe-2021-079f8.jpg
Fig. 9.
Wind break forest around M-3
ksoe-2021-079f9.jpg
Fig. 10.
Wind break forest around M-4
ksoe-2021-079f10.jpg
Fig. 11.
Main wind direction (M-5)
ksoe-2021-079f11.jpg
Fig. 12.
Frequency of Beaufort numbers at each point (Marine City vs Ocean Observatory)
ksoe-2021-079f12.jpg
Fig. 13.
Risk analysis at each point
ksoe-2021-079f13.jpg
Table 1.
Specification of observation equipment
Windspeed (arco-serial) Range 0–70 m/s
Accuracy ± 2 %
Resolution 0.1 m/s

Wind direction (arco-serial) Range 0°–360°
Accuracy ± 1°
Resolution
Table 2.
Record of typhoon OMAIS
Period 2021.08.20. 21:00 ∼ 2021.08.24. 09:00
Intensity Tropical storm
Size Small storm (Diameter: 330 km)
Minimum air pressure 994 hPa
Maximum wind speed 26 m/s (1 min average)
Table 3.
Beaufort wind scale
Beaufort number Description Wind speed (m/s)
0 Calm 0–0.2
1 Light air 0.3–1.5
2 Light breeze 1.6–3.3
3 Gentle breeze 3.4–5.4
4 Moderate breeze 5.5–7.9
5 Fresh breeze 8.0–10.7
6 Strong breeze 10.8–13.8
7 Near gale 13.9–17.1
8 Gale 17.2–20.7
9 Severe gale 20.8–24.4
10 Storm 24.5–28.4
11 Violent storm 28.5–32.6
12 Hurricane 32.7–

References

Choi, JS., Kim, EJ., & Yoon, SH. (2019). A Study on the Comparison of Wind Pressure Coefficient and Natural Ventilation Performance According to the Layout of Apartment Complex. Journal of Korean Institute of Architectural Sustainable Environment and Building Systems, 13(5), 315-324. https://doi.org/10.22696/jkiaebs.20190027
crossref
City of London Corporation. (2019). Wind Microclimate Guidelines for Developments in the City of London. 1-15. Retrieved from https://in2.ie/wp-content/uploads/2019/11/city-of-london-wind-microclimate-guidelines.pdf

Kim, HL. (2018). Building and Wind Dynamics. Seoul, Korea. Ilgwang.

Kim, HJ., Kim, HS., Jung, SH., & Lee, SH. (2013). Analysis on Effects of Protection Against Wind According to Tree Species and Planting Methods of the Wind Break Forest Based on the Wind Tunnel Experiment. Preceedings of 2013 Forest Science Joint Conference of Korean Institute of Forest Recreation and Welfare. 791-794.

Kim, JD., & Im, JT. (2012). Wind-Resistant Design of Tall Building using CFD. Computational Structural Engineering, 25(2), 21-24.

Lawson, TV., & Penwarden, AD. (1975). The Effectss of Wind on People in the Vicinity of Buildinbg. Proceedings of 4th International Conference on Wind Effects on Buildings and Structures. Cambridge University Press: Heathrow. p 605-622.

Lee, JH., Cheon, DJ., Kim, YC., & Yoon, SW. (2021). Investigation of Peak Pressure Coefficient of Central Open Elliptical Dome Roof by Wind Tunnel Test. Journal of Architectural Institute of Korea, 37(9), 189-197. https://doi.org/10.5659/JAIK.2021.37.9.189
crossref
Oh, SH., Kwon, SC., Kim, JC., & Lee, KW. (2020). Review of Hazardous Areas Through the Field Observation of Building Wind at Pedestrian Height - Concentrated on the 2020 9th Typhoon -. Journal of the Regional Association of Architectural Institute of Korea, 22(6), 151-157.

Roh, JW. (2008). Example Study on Building Wind of Apartment Complex by Computational Fluid Dynamics - About Two apartment Complex in Cheon-An Region -. Korea Institute of Ecological Architecture and Environment, 8(4), 37-42.

Korea Meteorological Administration. (2016). Standard Specifications for Automatic Weather Observation Equipment, Korea Meteorological Administration.

You, JY., Nam, BH., Park, MW., & You, KP. (2021). Comparison for Assessment of Wind Environment in High-rise Buildings Using Wind Tunnel Test and Computational Fluid Dynamics. Journal of Architectural Institute of Korea, 37(5), 163-171. https://doi.org/10.5659/JAIK.2021.37.5.163
crossref
TOOLS
Share :
Facebook Twitter Linked In Google+ Line it
METRICS Graph View
  • 1 Crossref
  •   Scopus
  • 2,668 View
  • 66 Download


ABOUT
BROWSE ARTICLES
ARTICLE CATEGORY

Browse all articles >

PUBLICATION ETHICS
FOR CONTRIBUTORS
Editorial Office
President Office BD Rm. 1302, 13 Jungang-daero 180beon-gil, Dong-gu, Busan 48821, Republic of Korea
Tel: +82-51-759-0656    Fax: +82-51-759-0656    E-mail: ksoehj@ksoe.or.kr                

Copyright © 2024 by The Korean Society of Ocean Engineers.

Developed in M2PI

Close layer
prev next