J. Ocean Eng. Technol. Search

CLOSE


J. Ocean Eng. Technol. > Volume 35(5); 2021 > Article
Lee, Gu, Kim, and Nam: Reliability Improvement of Offshore Structural Steel F690 Using Surface Crack Nondamaging Technology

Abstract

Microcracks can rapidly grow and develop in high-strength steels used in offshore structures. It is important to render these microcracks harmless to ensure the safety and reliability of offshore structures. Here, the dependence of the aspect ratio (As) of the maximum depth of harmless crack (ahlm) was evaluated under three different conditions considering the threshold stress intensity factor (ΔKth) and residual stress of offshore structural steel F690. The threshold stress intensity factor and fatigue limit of fatigue crack propagation, dependent on crack dimensions, were evaluated using Ando’s equation, which considers the plastic behavior of fatigue and the stress ratio. ahlm by peening was analyzed using the relationship between ΔKth obtained by Ando’s equation and ΔKth obtained by the sum of applied stress and residual stress. The plate specimen had a width 2W = 12 mm and thickness t = 20 mm, and four value of As were considered: 1.0, 0.6, 0.3, and 0.1. The ahlm was larger as the compressive residual stress distribution increased. Additionally, an increase in the values of As and ΔK th (l) led to a larger ahlm . With a safety factor (N) of 2.0, the long-term safety and reliability of structures constructed using F690 can be secured with needle peening. It is necessary to apply a more sensitive non-destructive inspection technique as a non-destructive inspection method for crack detection could not be used to observe fatigue cracks that reduced the fatigue limit of smooth specimens by 50% in the three types of residual stresses considered. The usefulness of non-destructive inspection and non-damaging techniques was reviewed based on the relationship between ahlm, aNDI (minimum crack depth detectable in non-destructive inspection), acrN (crack depth that reduces the fatigue limit to 1/N), and As.

1. Introduction

Offshore construction generally refers to the installation of structures and facilities in the marine environment for the production and transportation of electricity, petroleum, gas, and other resources. The shipbuilding industry is growing globally owing to the increasing freight volume, and drilling rigs are also actively being constructed for the development of marine resources (Lee et al., 2011; Song et al., 2013; Kim and Kim, 2018). High-strength steels are used to construct these offshore structures as they are becoming increasingly large and the environments in which they are used are becoming increasingly harsh. However, the possibility of microcracks developing in high-strength steels is high in harsh environments (variable load action), and cracks that have formed can grow rapidly. Microcracks can develop when processing materials and when transporting and installing these structures. To ensure the safety and reliability of offshore structures, initial defects that lead to microcracking should be rendered harmless.
Recently, many researchers have been actively attempting to render cracks harmless using peening. Peening effectively induces a compressive residual stress in high-strength steel (Al-Hassani, 1982; Al-Obaid, 1990; Harada et al., 2007) and increases its fatigue life and strength (Lee and Kim, 1997; Benedetti et al., 2002). As the heat-affected zone of welds is prone to cracking, studies have been conducted on improving fatigue life and rendering cracks harmless by peening the weld toe (Houjou et al., 2013a; Fueki et al., 2015; Fueki et al., 2019). Furthermore, studies simulating the behavior of steels with existing microcracks have been conducted to investigate the use of peening to render cracks harmless (Takahashi et al., 2012; Houjou et al., 2013b). A crack is determined to be harmless using the relationship between the stress intensity factor and the crack size based on the acting stress and compressive residual stress (Nakagawa et al., 2014; Ando et al., 2021; Nam et al., 2021). Each stress intensity factor is evaluated using the Newman–Raju equation (Newman and Raju, 1981) and API-RP579’s equation (American Petroleum Institute, API, 2000). Equations to determine the threshold stress intensity factor of a microcrack have been proposed by El Haddad et al. (1979), Tange et al. (1991), and Ando et al. (2019). In particular, Ando et al. proposed an evaluation equation that depends on the crack size, considering the peculiar plastic behavior and stress ratio of fatigue in high-strength steels. This equation can be used to evaluate the fatigue limit and the threshold stress intensity factor of microcracks in high-strength steels (Ando et al., 2020; Ando et al., 2021; Park et al., 2020; Park et al., 2021; Kim et al., 2020).
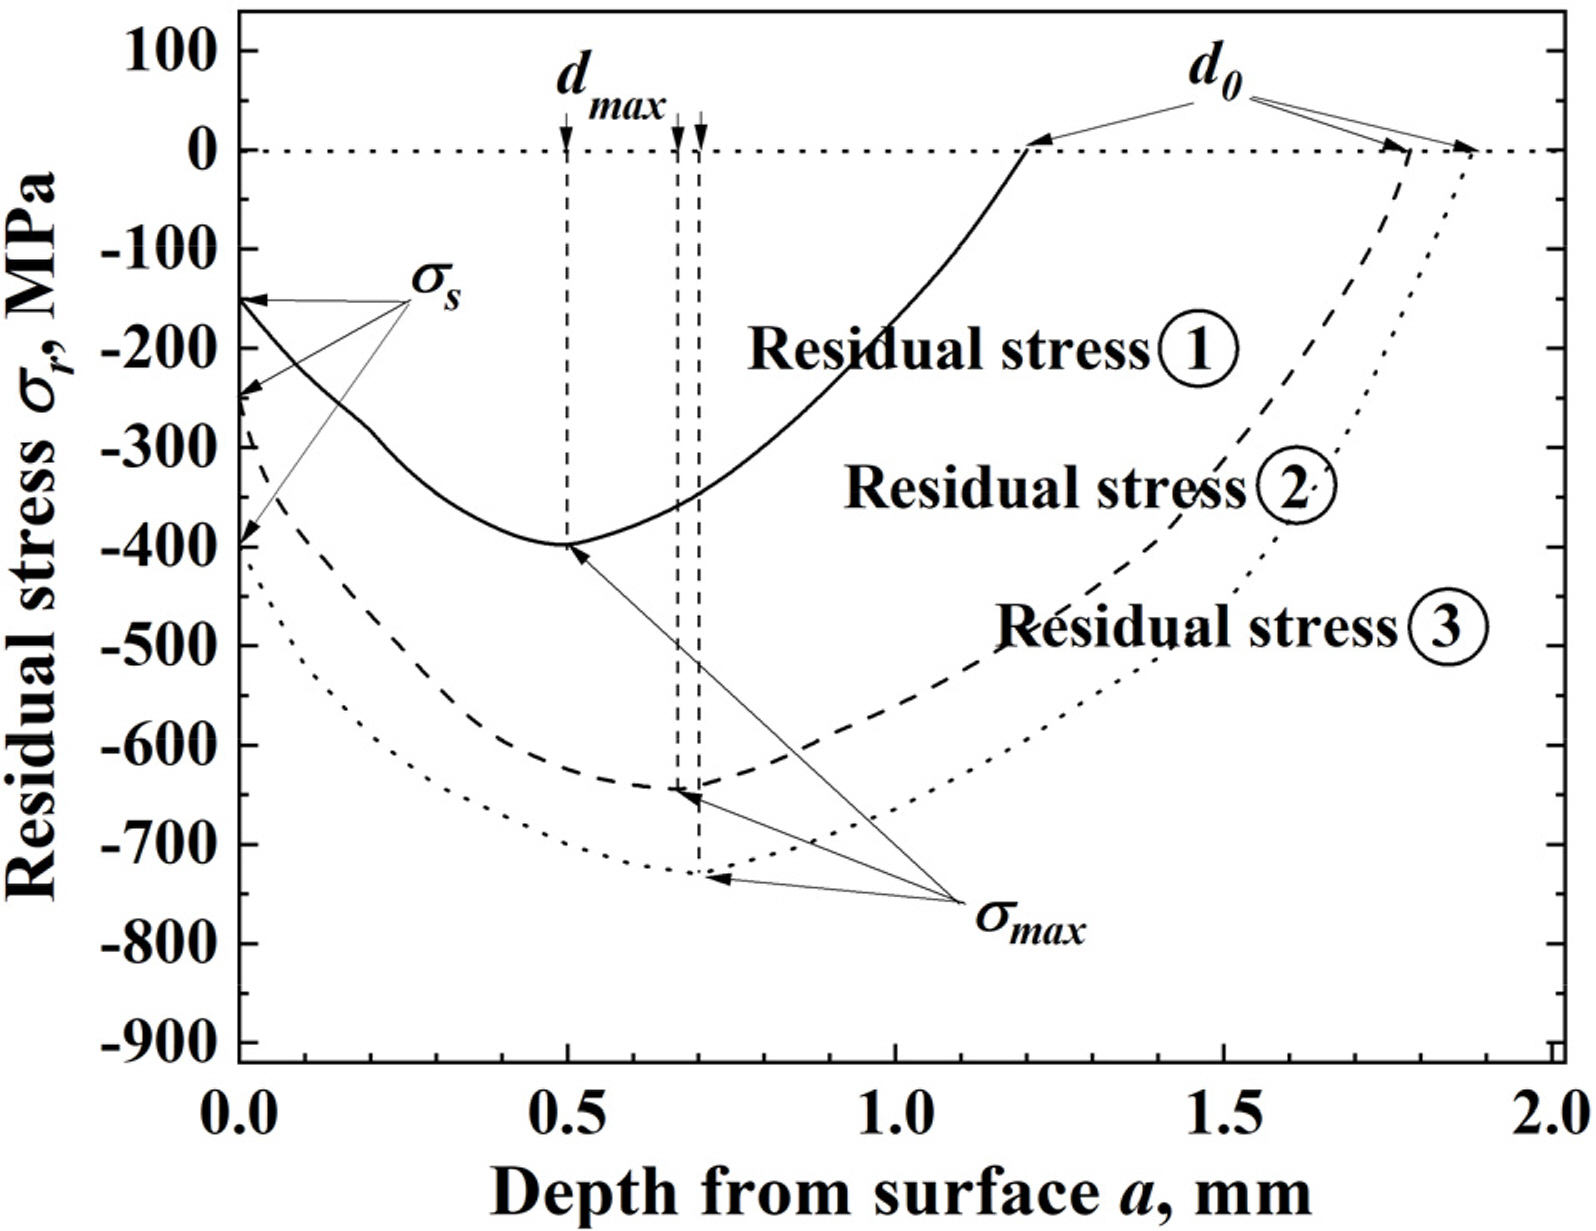
This study aimed to evaluate the dependence of the maximum depth of a harmless crack (ahlm) in needle peening (NP)-applied offshore structural steel F690 on the compressive residual stress distribution, threshold stress intensity factor range for large cracks (ΔKth (l)), and crack aspect ratio (As). Furthermore, we evaluated the maximum allowable crack depth at an assumed safety factor (N) (acrN ), the minimum detectable crack depth via nondestructive inspection and ahlm (aNDI ), and the crack aspect dependence of ahlm .

2. Materials and Experimental Methods

2.1 Materials and Model Specimens

This study investigated high-strength steel DNV F690, which is used in offshore structures. Table 1 describes the chemical composition of DNV F690 and Table 2 lists its mechanical properties. As shown in Fig. 1, the model specimen has a plate width 2W = 12 mm and a thickness t = 20 mm; a four-point bending fatigue stress with a stress ratio R = 0.1 is applied, as in a previous study (Kim et al., 2021). A semicircular crack with a surface crack length (2c) and depth (a) exists at the center of the specimen. We assumed four crack aspect ratios (As = a/c): 1.0, 0.6, 0.3, and 0.1.

2.2 Residual Stress Distribution

Three types of compressive residual stress ①, ②, and ③ induced by NP were assumed in order to evaluate their effect on ahlm, as shown in Fig. 2. Residual stress ② was obtained in an experiment (Kim et al., 2021). Residual stress ① was the surface compressive residual stress of residual stress ② + 100 MPa, and residual stress ③ was the surface compressive residual stress of residual stress ② − 150 MPa. In the figure, σs is the compressive residual stress of the surface, σmax is the maximum compressive residual stress, dmax is the depth at which the maximum compressive residual stress is observed, and d0 is the point where the compressive residual stress is 0. Table 3 summarizes these values. The fatigue limit of the smooth specimen was 740 MPa and that of the NP smooth specimen was 750 MPa (Kim et al., 2021). ΔKth (l) of the smooth specimen obtained experimentally was 6.5 MPam, but we assumed three values (3, 5, and 7 MPam) to evaluate the effect of ΔKth (l) . In general, ΔKth (l) is related to the hardness of a material, and as the hardness increases, ΔKth (l) decreases. In this study, considering that the hardness of F690 varies depending on the heat treatment applied, we selected the three values of ΔKth (l) . The fatigue limit of the NP smooth specimen depends on the residual stress distribution and ΔKth (l), but we assumed that the fatigue limit of the NP smooth specimens was identical to evaluate the dependence of ahlm on the residual stress distribution and ΔKth (l).

2.3 Evaluation Method

In this study, we used Eq. (1), which was originally proposed by Ando et al. (Ando et al., 2019). This equation describes the dependence of the threshold stress intensity factor range (ΔKth) on crack length when an existing crack in an infinite plate propagates under fatigue stress.
(1)
ΔKth=2βΔσwaπcos-1{π8β2a(ΔKth(l)Δσw)2+1}-1β=H(at,ac,cb,φ)F(at,ac,cb,φ)Q(ac)
where a is the crack length, ΔKth (l) is the threshold stress intensity factor range for large cracks, Δσw is the fatigue limit of the non-peened smooth specimen, β is a function of ϕ in Fig. 1 and a shape factor obtained by the Newman–Raju equation (Newman and Raju, 1981). In contrast, the fatigue limit of the cracked specimen (Δσwc) can be evaluated using Eq. (2).
(2)
ΔKth=Δσwcπa
Eqs. (1)(2) are used to determine ΔKth and Δσwc for the deepest part of the crack (point A) in the cracked specimen to which bending stress is applied. To determine these values on the outermost surface (point C), a can be replaced with c in Eqs. (1) and (2).
We evaluated the crack depths corresponding to fatigue limit reduction rates of 25% and 50% in the smooth specimens. These crack depths are denoted by a25 and a50. In our evaluation, the safety factor (SF) for the fatigue limit was set to 2.0, as suggested in the standard established by the American Society of Mechanical Engineers (ASME). As a25 decreases till SF reaches 1.5, these cracks can always be detected via nondestructive inspection. Furthermore, in the case of SF = 2.0, the maximum crack depth that can exist after a certain period is a50. Therefore, if there are no internal defects, surface crack nondamaging technology can ensure the safety of the cracks of a50 by peening.
a25 and a50 were evaluated using Eq. (3):
(3)
ΔKap=ΔKth(s)
where ΔKap is the stress intensity factor based on bending stress; it can be calculated using the Newman–Raju equation (Newman and Raju, 1981). In other words, ΔKap is a stress intensity factor obtained by considering a 25% and 50% lower stress than the fatigue limit of the smooth specimen. In this case, ΔKap was evaluated at points A and C in Fig. 1, and a small crack size was used.
In contrast, the stress intensity factor of the NP specimen was evaluated using Eq. (4):
(4)
ΔKTr=ΔKap+Kr
where the stress intensity factor Kr based on the compressive residual stress was calculated using a stress intensity factor evaluation equation for surface cracks, considering the stress distribution shown in a four-order polynomial provided by API-RP579 (API, 2000). The stress intensity factor of a semi-circular crack existing in a plate is represented by Eq. (5):
(5)
Kr=[G0σ0+G1σ1(at)+G2σ2(at)2+G3σ3(at)3+G4σ4(at)4]πaQfwQ=1.0+1.464(ac)1.65fw={sec(πc2Wat)}0.5
where G0G4 are the shape correction factors of the stress intensity factor determined by API-RP579. a and c represent the depth and surface length of the semi-circular crack, respectively.W and t are the width and thickness of the plate, respectively. σ0σ4 are the factors obtained from the fourth-order polynomial approximation of the residual stress distribution.
(6)
σ(x)+σ0+σ1(xt)+σ2(xt)2+σ3(xt)3+σt(xt)4
where x is the distance along the depth direction from the surface to the crack. In this study, the fourth-order polynomial approximation was used for the three types of compressive residual stress distributions shown in Fig. 2 to evaluate Kr . Table 4 lists the factors σ0σ4 obtained from the fourth-order polynomial approximation of residual stress distribution.
Eq. (7) expresses the determining condition of ahlm of the NP specimen:
(7)
ΔKTr=ΔKth(s)
Eq. (7) was reviewed at points A and C, in Fig. 1, and a small crack size was determined with ahlm .
The detection probability of a semi-circular fatigue crack was studied by Rummel et al. (1974). They reported that the ultrasonic detection method showed the best detection probability of fatigue cracks. According to them, cracks with a 100% detection probability in the optimal conditions of the laboratory using this method had 2c = 12 mm and a = 4 mm. Moreover, cracks with a 50% detection probability had 2c = 1.2 mm and a = 0.26 mm. The minimum crack dimensions were c = a = 0.17 mm. Recently, other researchers detected stress corrosion cracking with a depth (a) of 0.4 mm (Ochiai et al., 2006); however, since they did not mention the length, it was assumed to be a semi-circular crack. In this study, based on the above literature, we assumed that the ultrasonic detection method can sufficiently detect a semi-circular crack of 2c = 0.6 mm and a = 0.3 mm. Among ultrasonic testing methods, the echo reflection method’s echo intensity depends on the crack area. The area (S) of a semi-circular crack can be represented by Eq. (8):
(8)
S=πac/2
In other words, if the area of a semi-circular crack (S) is the same, even if the crack aspect ratio (As) changes, the crack detection probability remains the same. Therefore, if the area of a semi-circular crack of 2c = 0.6 mm and a = 0.3 mm is SNDI, then the relationship between the maximum crack size aNDI that can be detected from SNDI and As can be expressed by Eq. (9):
(9)
SNDI=πaNDI2/2As

3. Results and Discussion

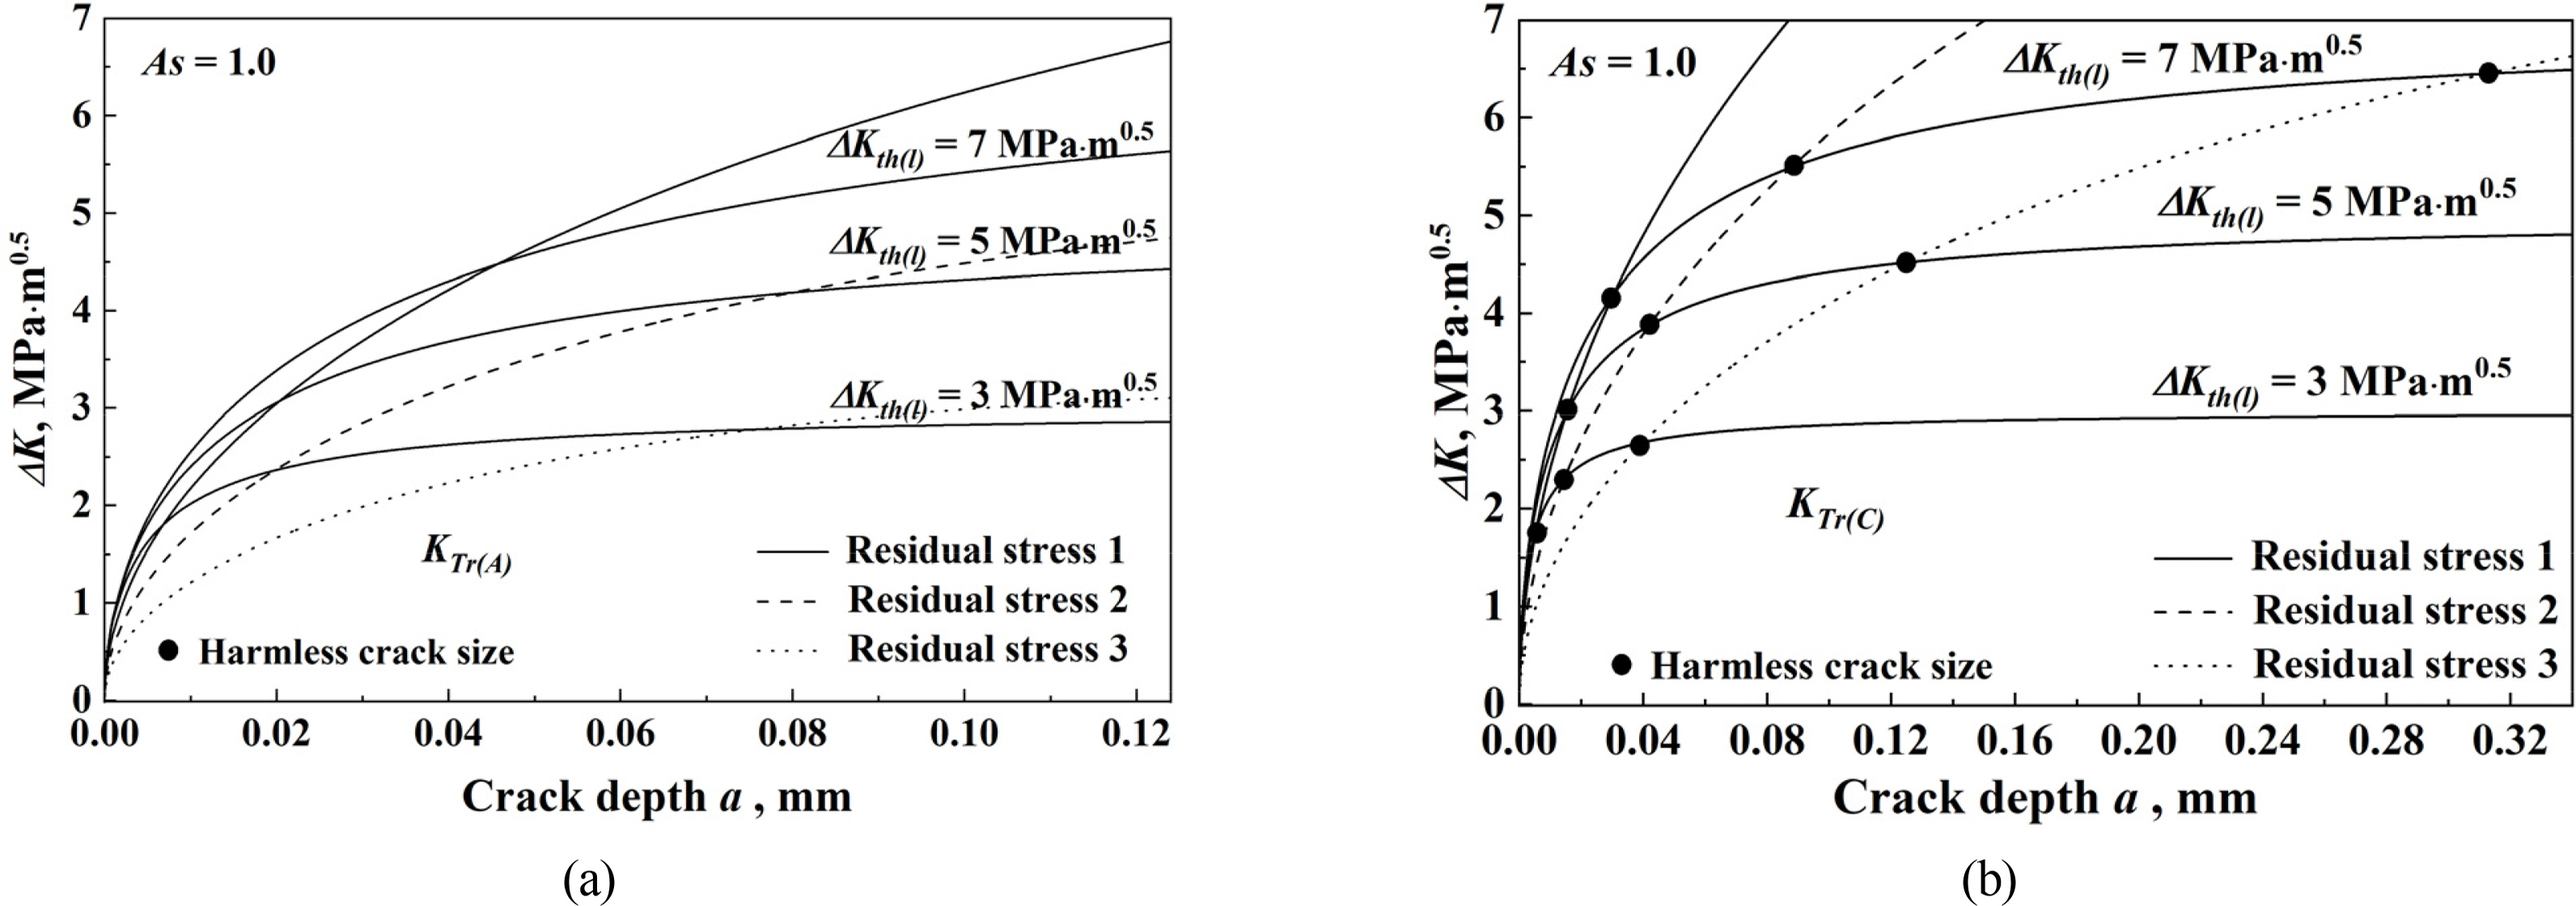
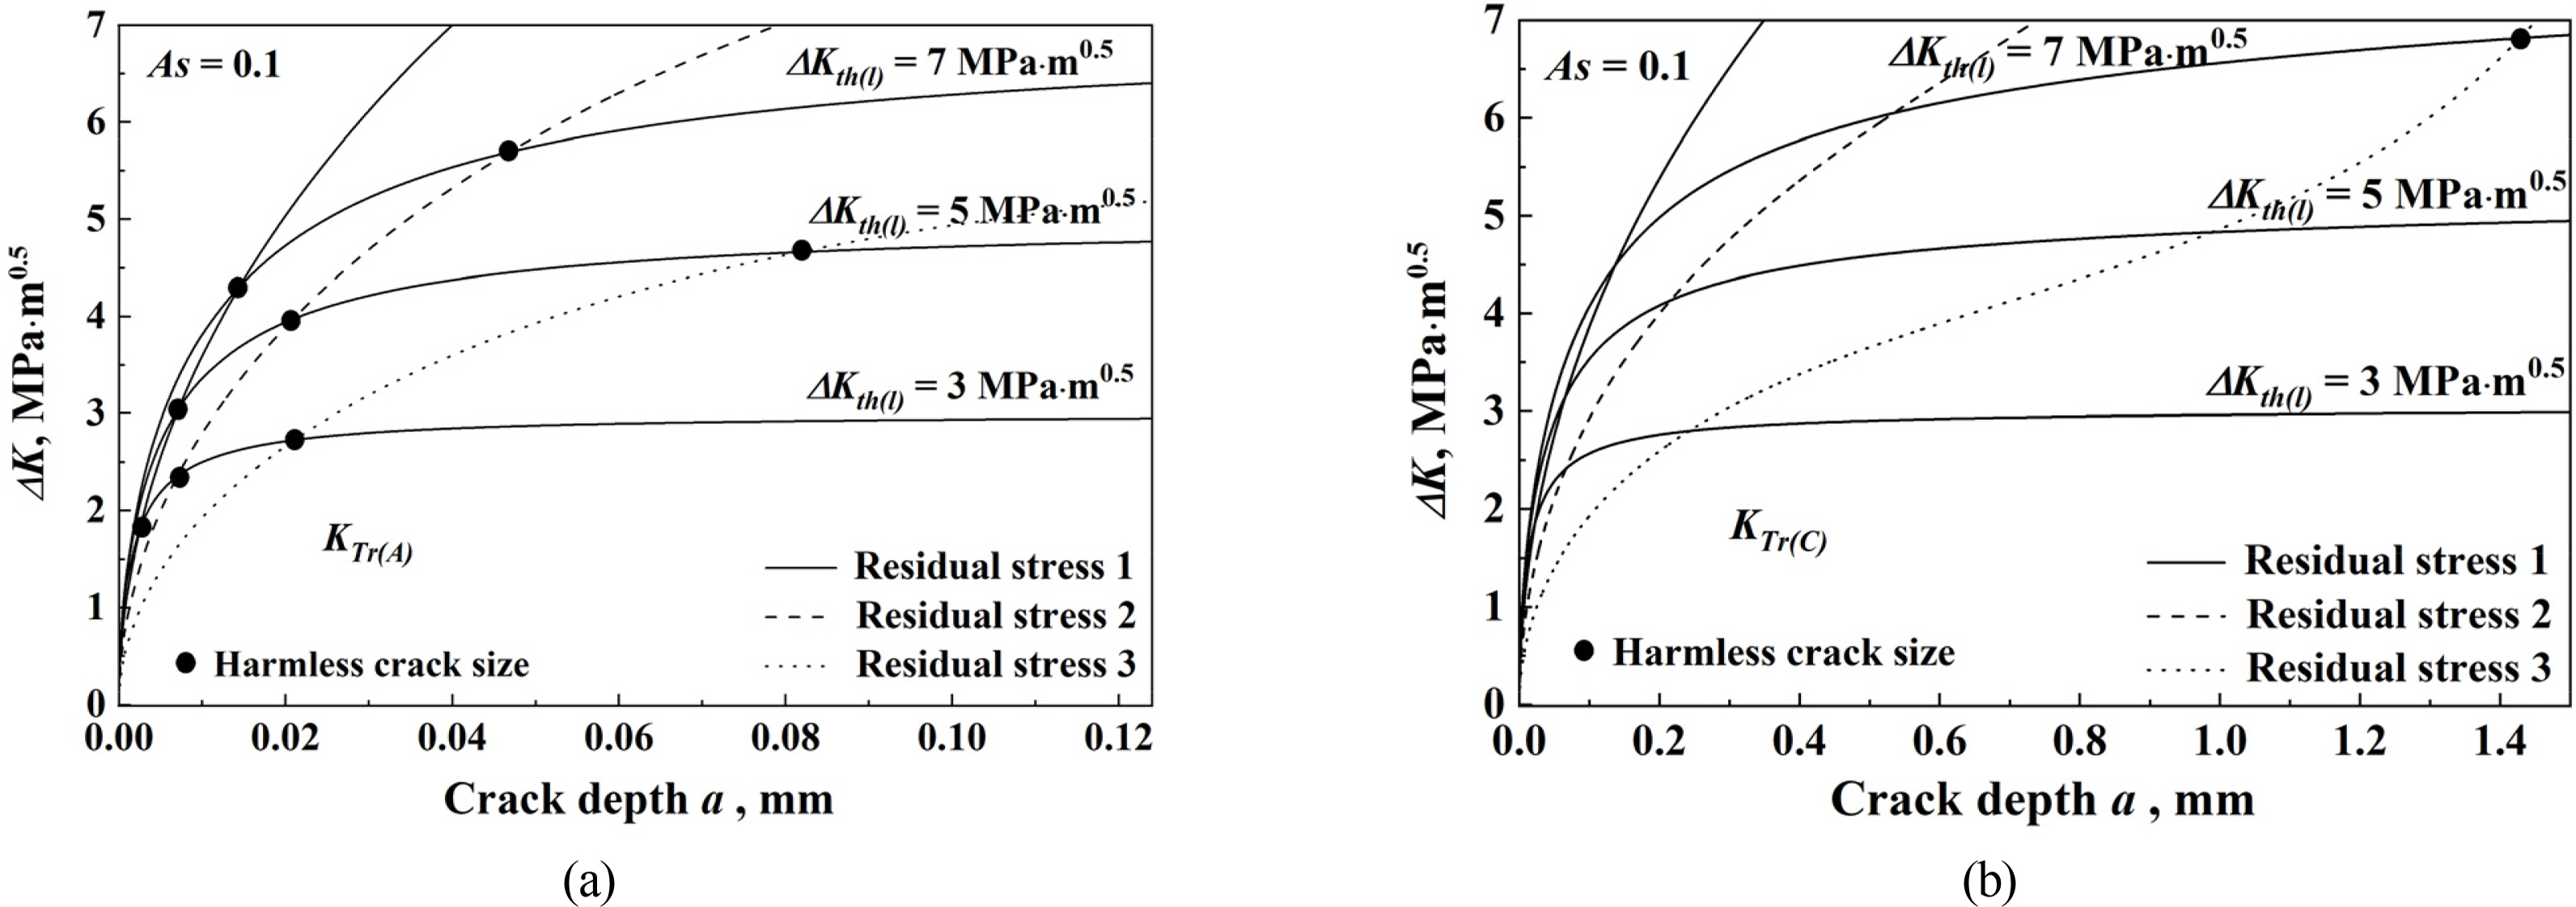
Fig. 3 shows the crack depth (a) dependence of ΔKth and ΔKTr for residual stresses ①, ②, and ③ in the case of As = 1.0. Fig. 3(a) shows the results at point A, and Fig. 3(b) shows the results at point C. Eq. (7) expresses the condition for determining the maximum harmless crack dimensions using NP, and the small crack dimensions of point A and point C are selected. These crack dimensions are marked with ●. In the case of As = 1.0, ahlm values of residual stresses ①, ②, and ③ were determined at point C for all ΔKth (l) .
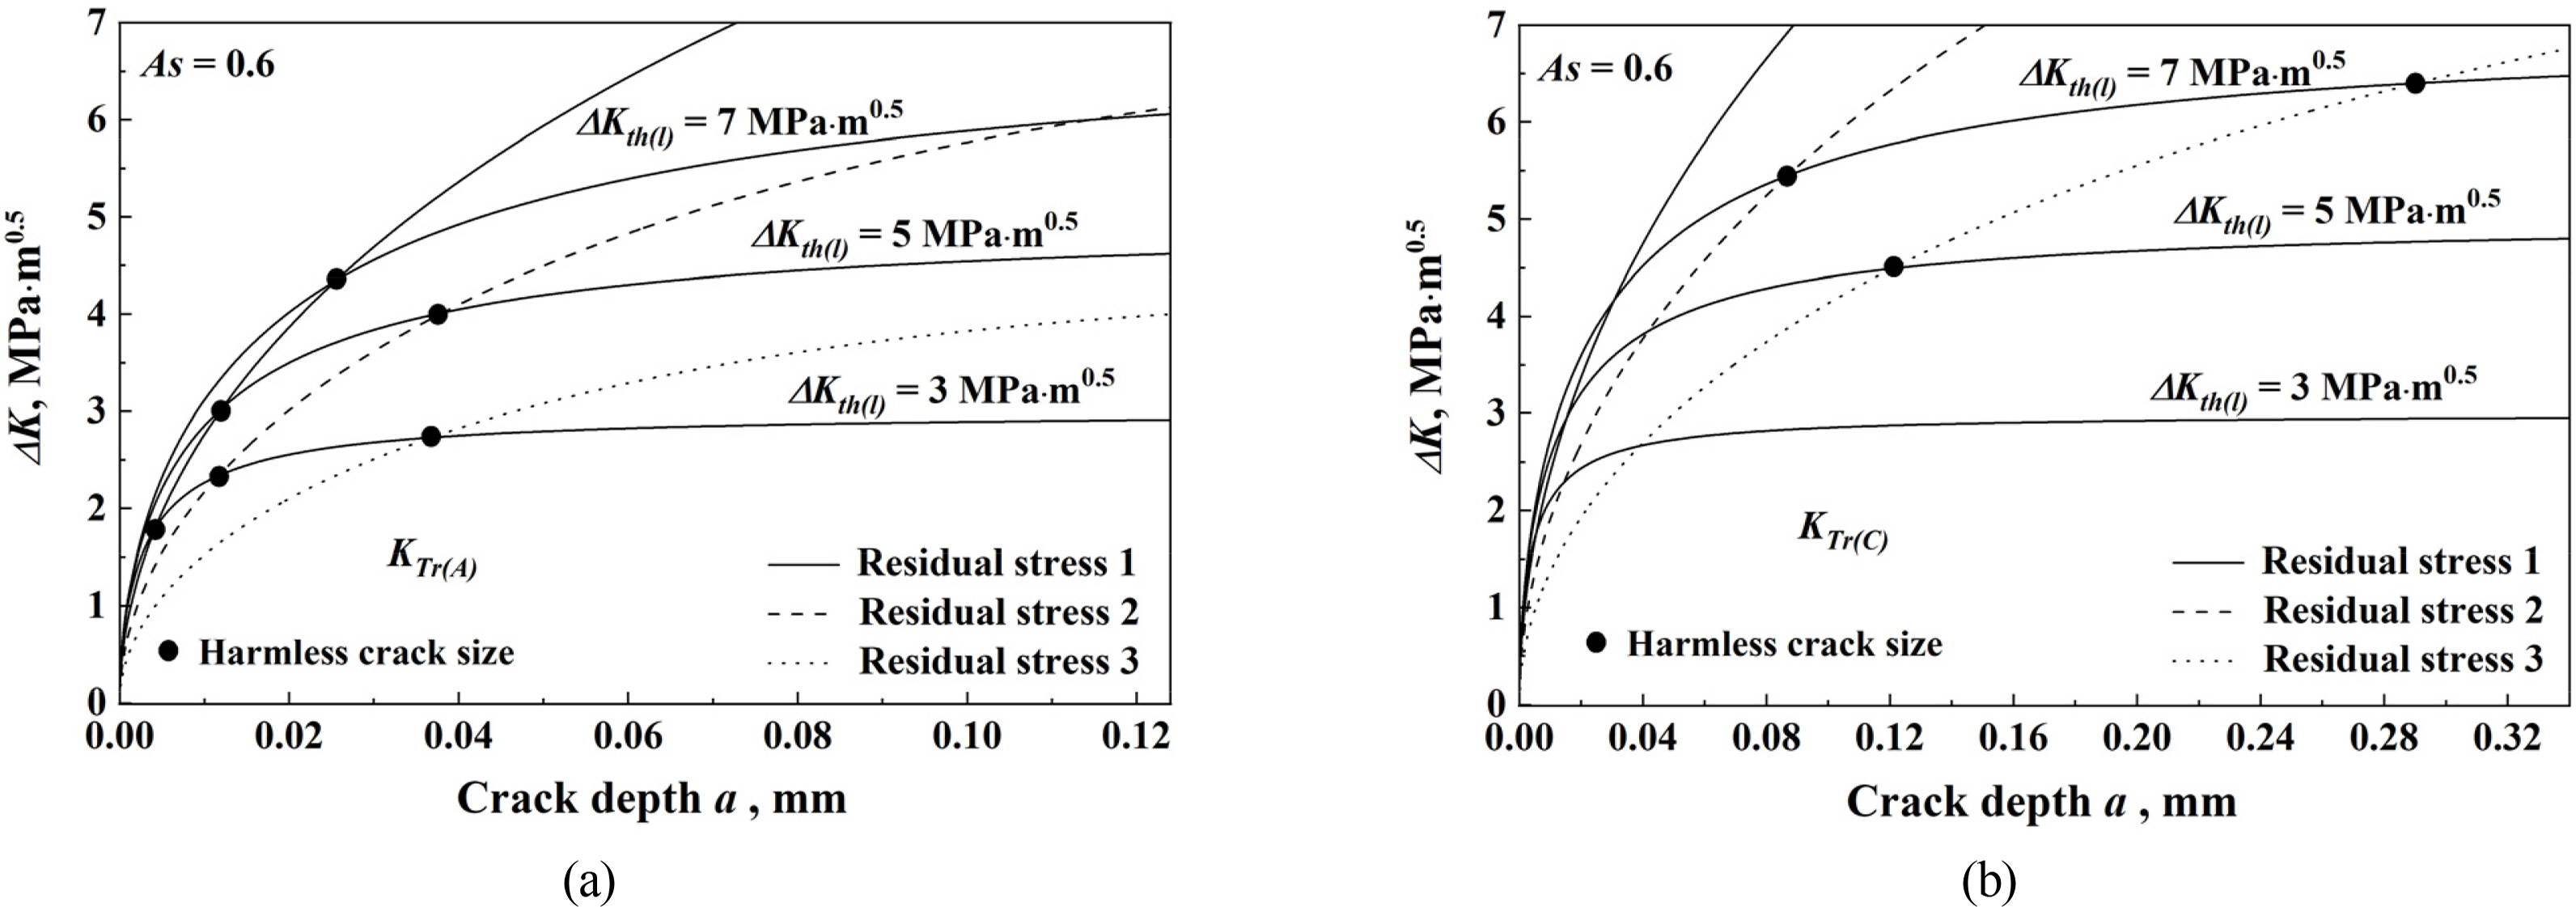
Fig. 4 shows the crack depth (a) dependence of ΔKth and ΔKTr for residual stresses ①, ②, and ③ in the case of As = 0.6. Fig. 4(a) shows the results at point A, and Fig. 4(b) shows the results at point C. In this case also, the crack dimensions that determine the maximum harmless crack dimensions are marked with ●. In the case of As = 0.6, ahlm of residual stress ① was determined at point A for all ΔKth (l) . While ahlm of residual stress ② was determined at point A in the cases of ΔKth (l) = 3 MPam and ΔKth (l) = 5 MPam, it was determined at point C in the case of . In contrast, of residual stress ③ was determined at point A in the case of ΔKth (l) = 3 MPam and at point C in the cases of ΔKth (l) = 5 MPamand ΔKth (l) = 7 MPam.
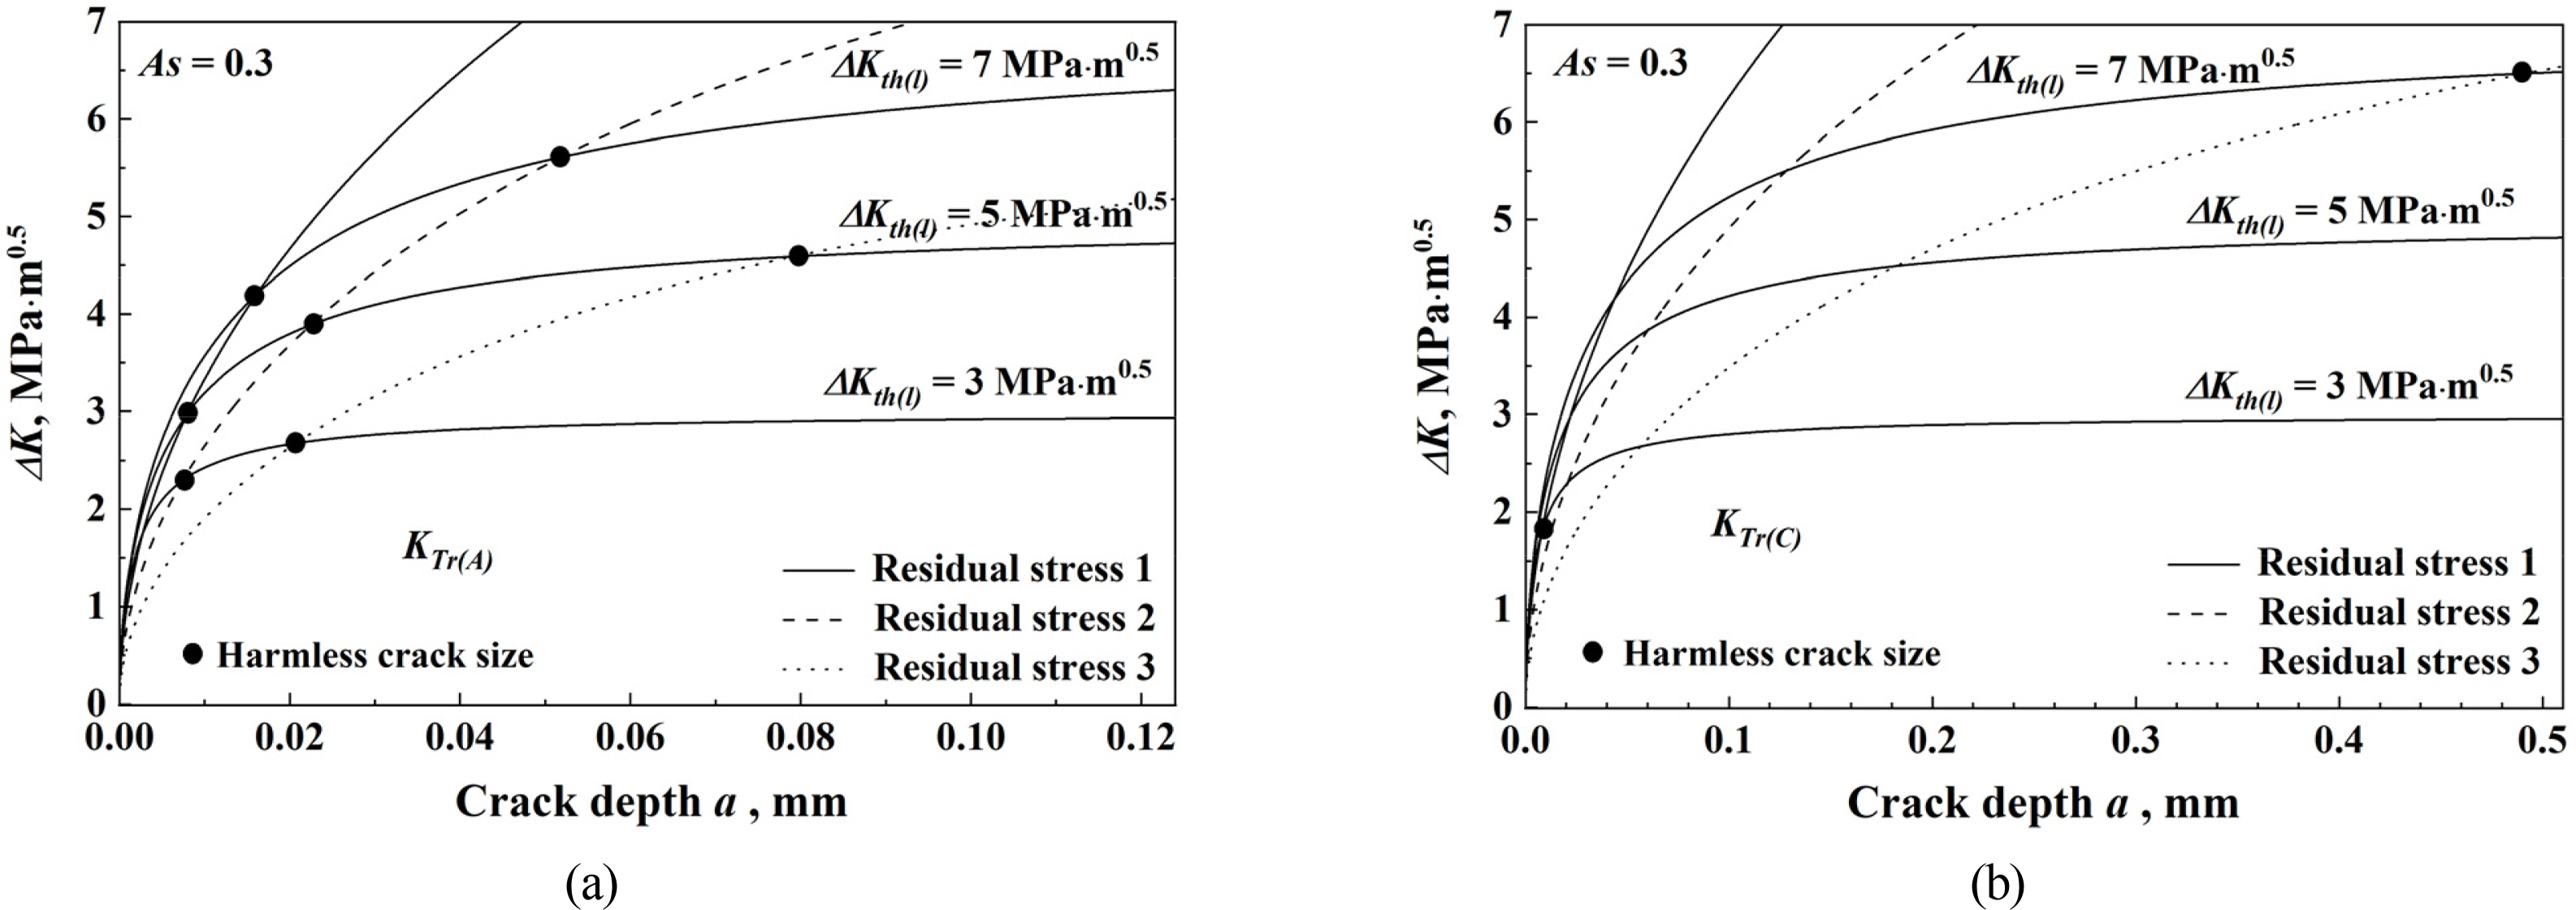
Fig. 5 shows the crack depth (a) dependence of ΔKth and ΔKTr in the case of As = 0.3 for residual stresses ①, ②, and ③. Fig. 5(a) shows the results at point A, Fig. 5(b) shows the results at point C. In this case also, the crack dimensions that determine the maximum harmless crack dimensions are marked with ●. In the case of As = 0.3, of residual stress ① was determined at point A when ΔKth (l) = 5 MPam and ΔKth (l) = 7 MPam, but it was determined at point C when ΔKth (l) = 3 MPam. ahlm of residual stress ② was determined at point A for all ΔKth (l) . In contrast, ahlm of residual stress ③ was determined at point A when ΔKth (l) = 3 MPam and ΔKth (l) = 5 MPam and at point C when ΔKth (l) = 7 MPam.
Fig. 6 shows the crack depth (a) dependence of ΔKth and ΔKTr in the case of As = 0.1 for residual stresses ①, ②, and ③. Fig. 6(a) shows the results at point A, and Fig. 6(b) shows the results at point C. In this case also, the crack dimensions that determine the maximum harmless crack dimensions are marked with ●. In the case ofAs = 0.1, ahlm values of residual stresses ① and ② were determined at point A for all ΔKth (l) . However, ahlm of residual stress ③ was determined at point A in the cases of ΔKth (l) = 3 MPam and ΔKth (l) = 5 MPam and at point C in the case of ΔKth (l) = 7 MPam.
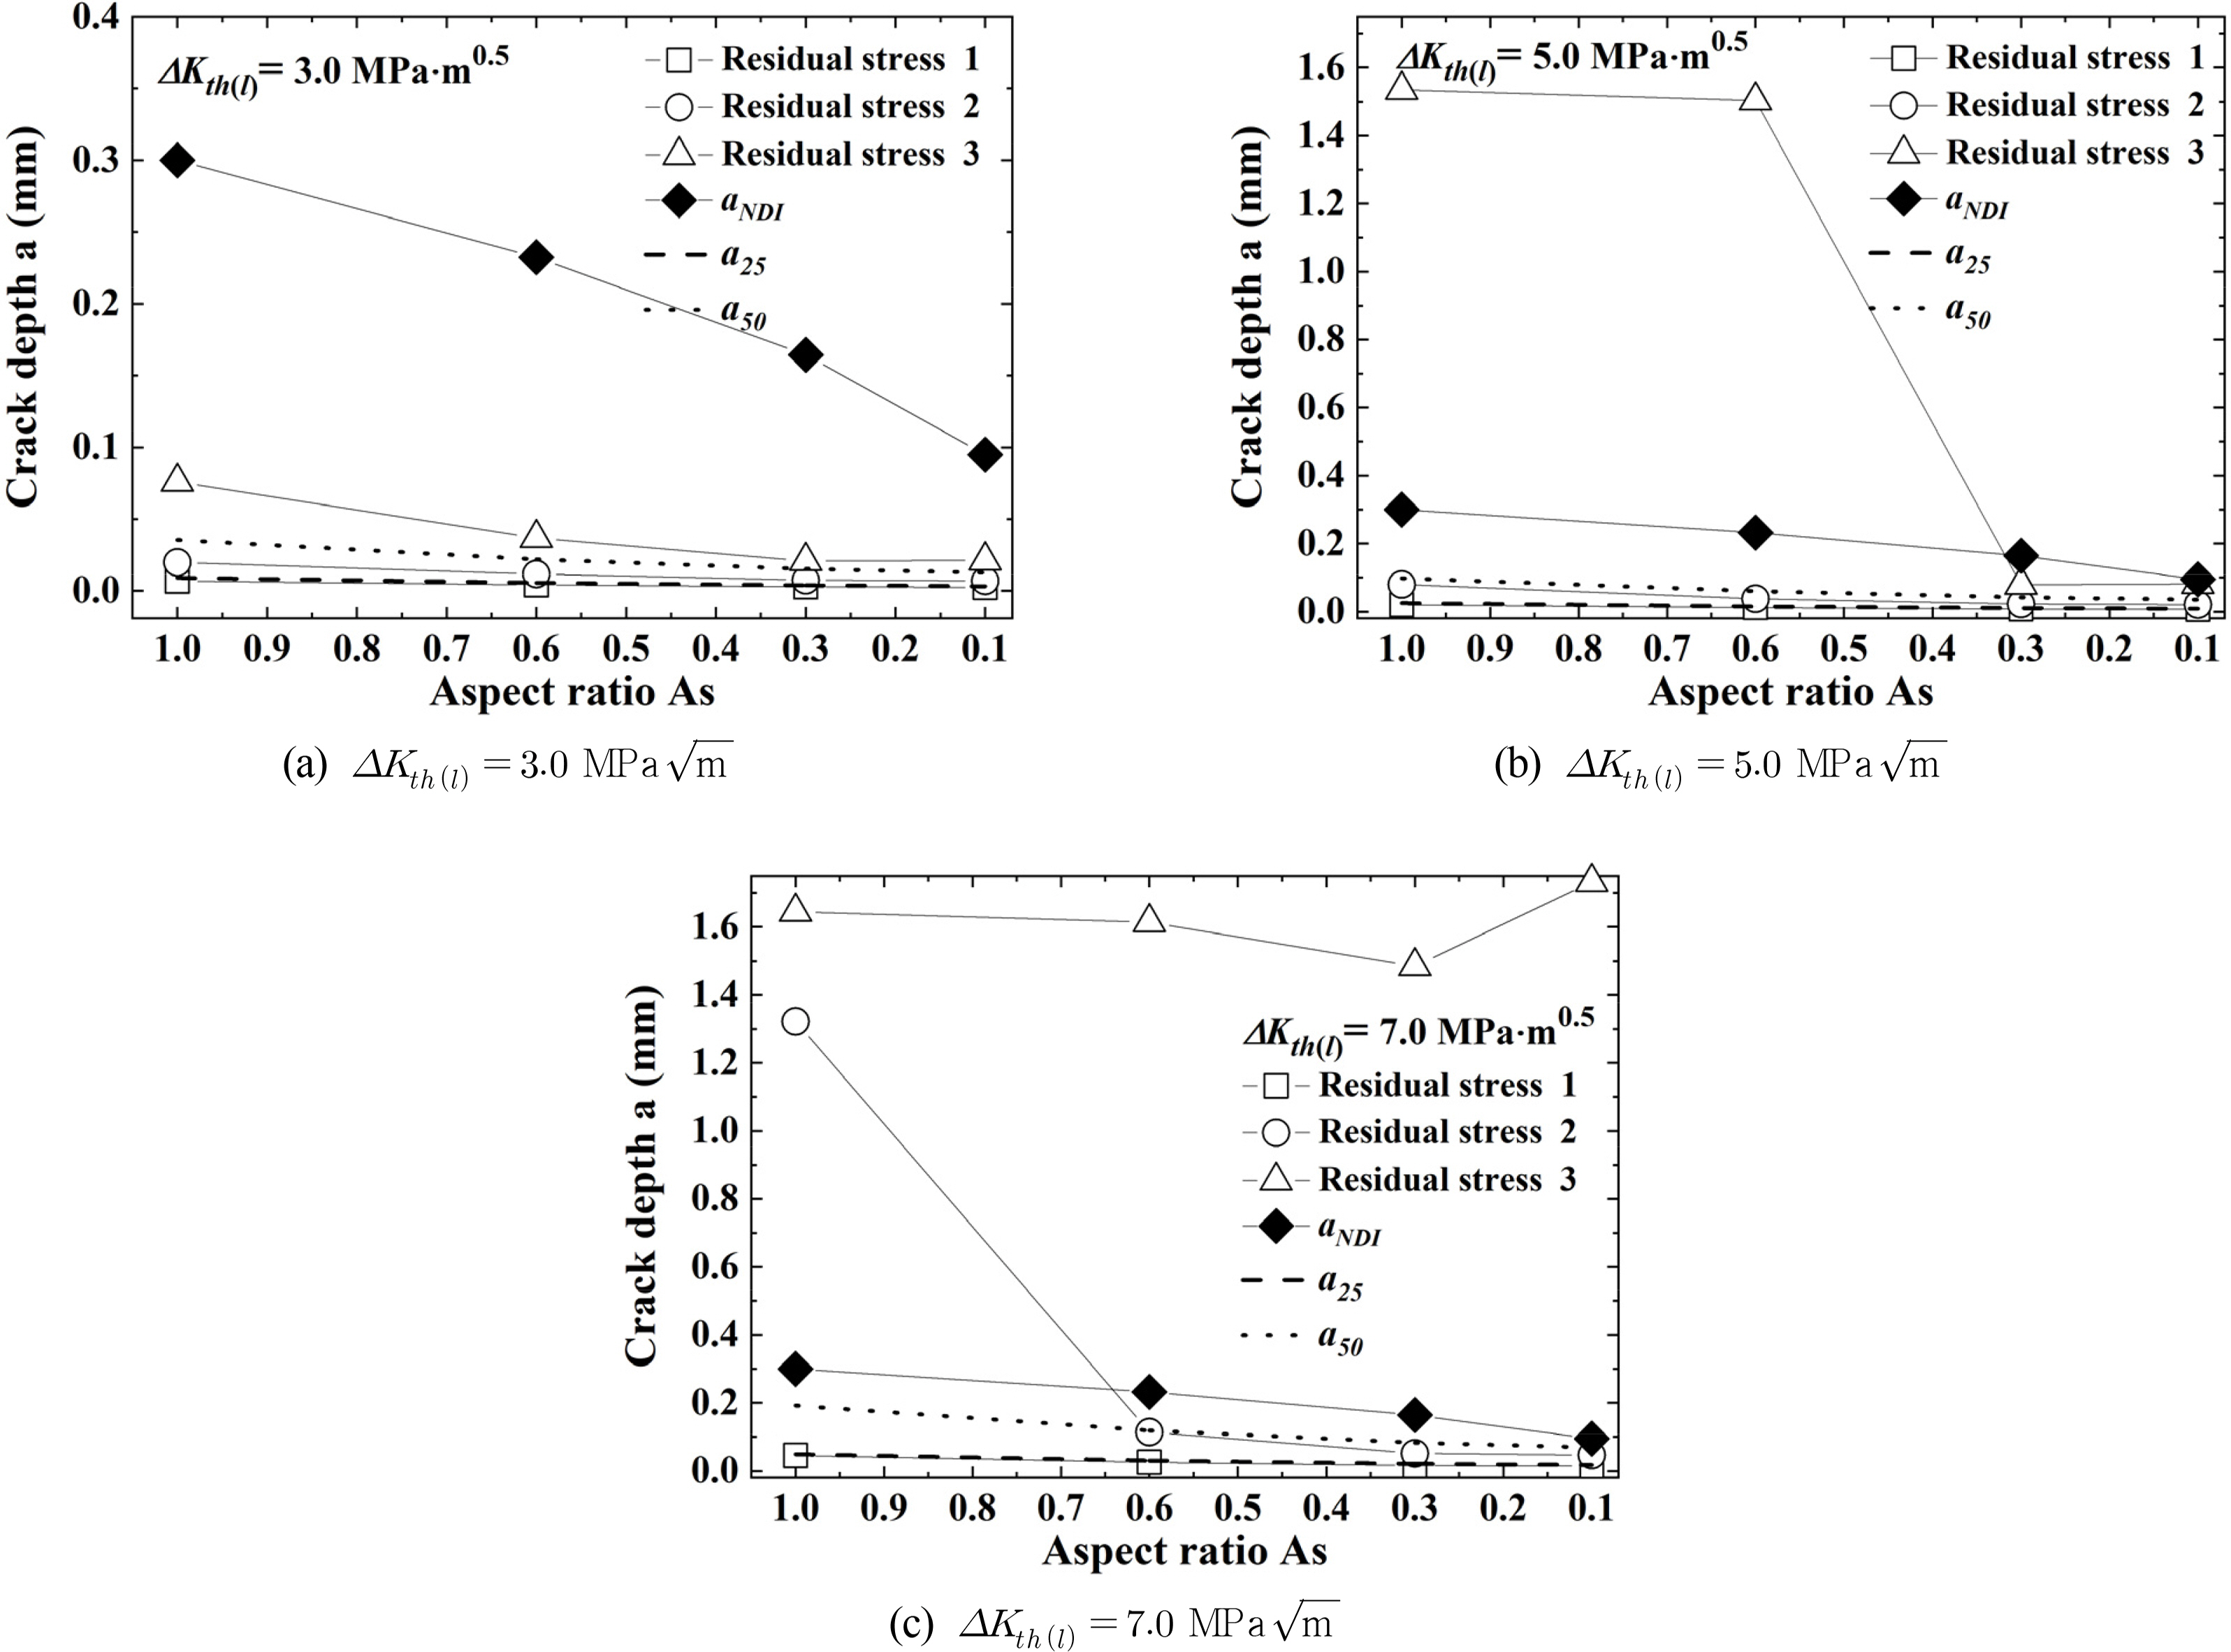
The surface crack nondamaging technology using NP is employed to ensure safety of structures. Fig. 7 shows the crack aspect ratio dependence of ahlm when using NP. In Figs. 7(a), 7(b), and 7(c), ΔKth (l) values are 3, 5, and 7 MPam, respectively. ahlm was larger when the residual stress distribution was larger and deeper, indicating that ahlm was considerably affected by the residual stress distribution. Furthermore, As and ΔKth (l) increased, ahlm increased.
Fig. 7 shows the crack depths corresponding to fatigue limit reduction rates of 25 % and 50% (a25, a50) in the non-NP specimens. The crack depth showed a decreasing tendency As decreased. Furthermore, the figure shows the relationship between aNDI and As, which was evaluated using Eq. (9).
In Fig. 7(a), since ahlm of residual stress ① is below a50, it cannot be rendered harmless. Since ahlm of residual stress ② is below a50, it can not be rendered harmless; however, since it is above a25, it can be rendered harmless. Meanwhile, since ahlm of residual stress ③ is above a50, it can be rendered harmless. Based on this, residual stress ③ can ensure the safety of structures that use this material via the surface crack nondamaging technology. In contrast, the crack detection ability (◆) determined by the above-assumed non-destructive inspection is above a50. Therefore, it is difficult to detect cracks of a50 by using this non-destructive inspection, and it is necessary to apply a more sensitive non-destructive inspection technique.
In Fig. 7(b), since ahlm of residual stress ① is below a25, it can not be rendered harmless. Since ahlm of residual stress ② is above a25, it can be rendered harmless. However, since it is below a50, it cannot be rendered harmless. ahlm of residual stress ③ can be rendered harmless since it is above a50. Based on this, residual stress ③, determined using the surface crack nondamaging technology, can ensure the safety of structures that use this material. In contrast, the crack detection ability (◆) determined by the above-assumed non-destructive inspection is above a50. Therefore, it is difficult to detect cracks of a50 by using this non-destructive inspection, and it is necessary to apply a more sensitive non-destructive inspection technique.
In Fig. 7(c), since ahlm of residual stress ① is below a25, it cannot be rendered harmless. Furthermore, since ahlm of residual stress ② is above a25, it can be rendered harmless; however, since it is below a50 except for ahlm of As = 1.0, it cannot be rendered harmless. ahlm of residual stress ③ can be rendered harmless since it is above a50. Based on this, residual stress ③ can ensure the safety of structures that use this material via the surface crack nondamaging technology. In contrast, the crack detection ability (◆) determined by the above-assumed non-destructive inspection is above a50. Therefore, it is difficult to detect cracks of a50 by using this non-destructive inspection, and it is necessary to apply a more sensitive non-destructive inspection technique.
Based on this, residual stress ①, determined by the surface crack nondamaging technology, cannot ensure the safety of structures that use this material; however, residual stress ② with As = 1.0 and residual stress ③ can ensure the safety of structures. In contrast, since the crack detection ability (◆) determined by the non-destructive inspection assumed for residual stresses ② and ③ is above a50, this non-destructive inspection cannot detect cracks of a50.
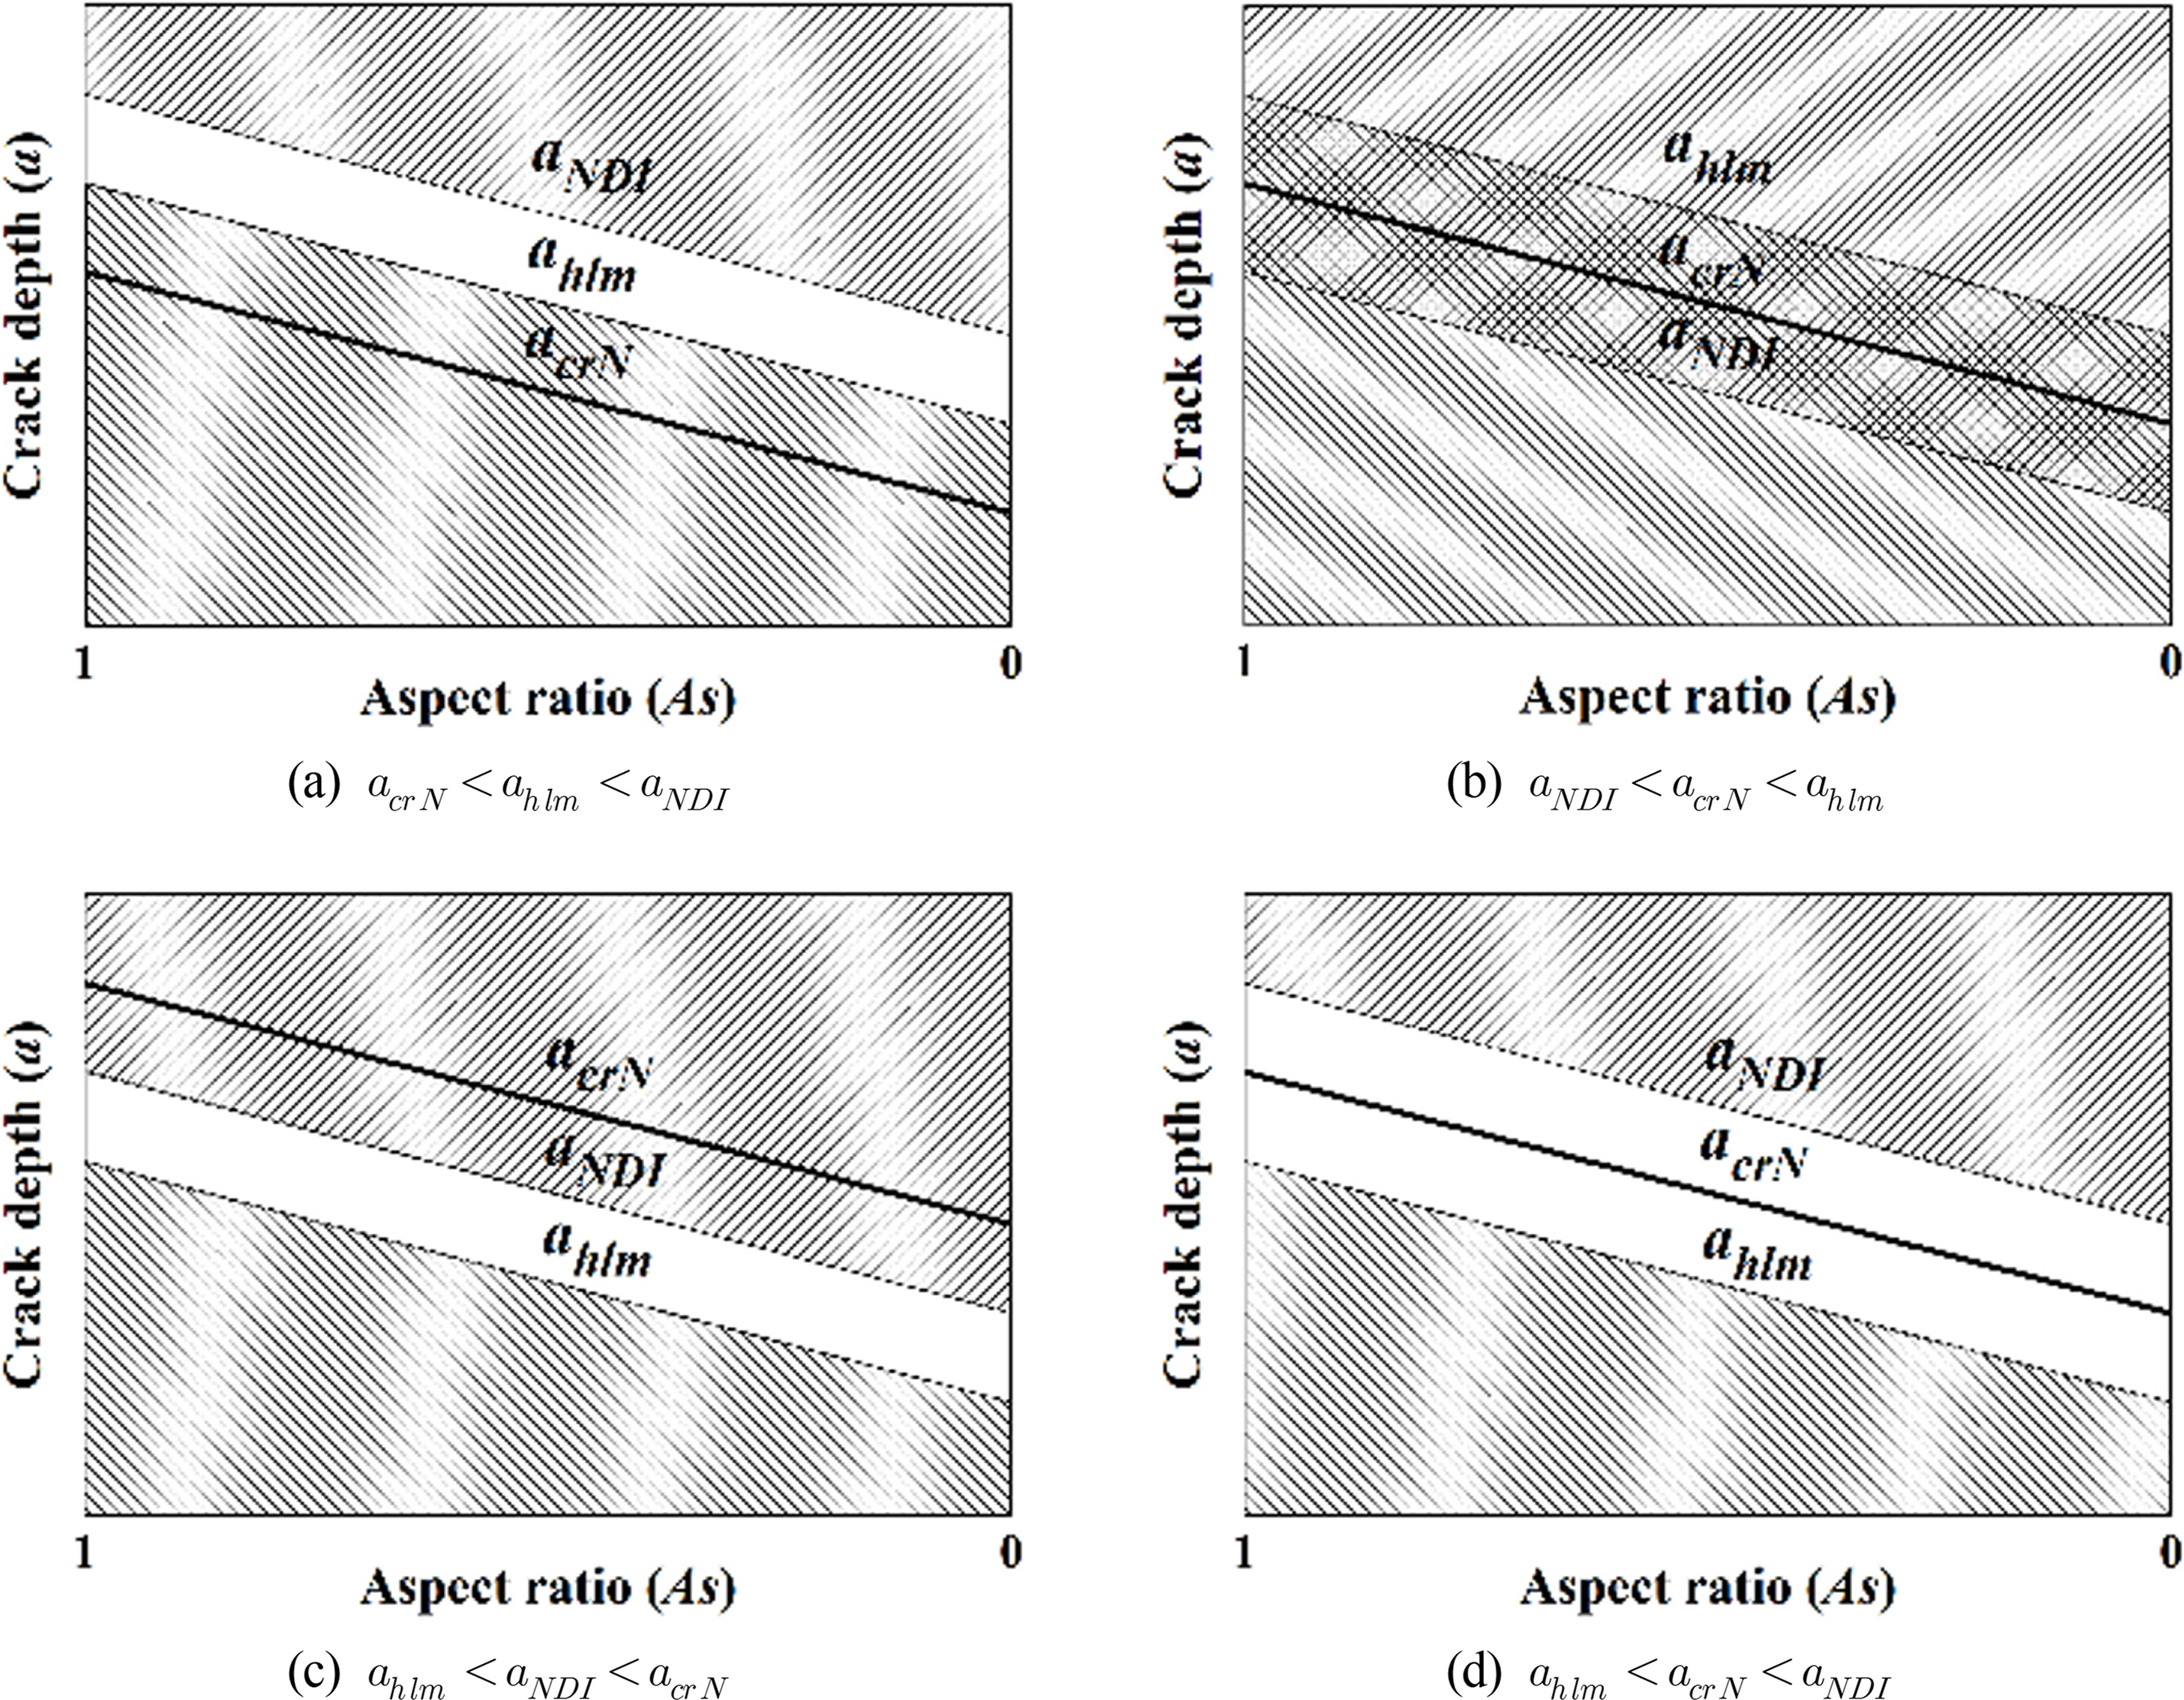
In Fig. 8, examination results of the maintenance and reliability of fatigue failure using non-destructive inspection and surface crack nondamaging technology (Nam et al., 2021) are shown. The schematic diagrams in Figs. 8(a)–8(d) show ahlm and aNDI determined when using NP and the relationship between the crack depth (acrN ), which reduces the fatigue limit to 1/N, and the crack aspect ratio (As) when the safety factor is N . In Fig. 8(a), the condition is acrN <ahlm <aNDI . Under this condition, the surface crack nondamaging technology can facilitate appropriate maintenance, but the non-destructive inspection cannot facilitate appropriate maintenance. In Fig. 8(b), the condition is aNDI <acrN <ahlm . Under this condition, both non-destructive inspection and the surface crack nondamaging technology can facilitate appropriate maintenance. If NP is performed after non-destructive inspection to ensure complete safety, it can contribute greatly to the shortening of the periodic inspection period because it is required to detect only cracks that are deeper than the crack depth corresponding to ahlm . In Fig. 8(c), the condition is ahlm <aNDI <acrN . Under this condition, non-destructive inspection alone can facilitate appropriate maintenance, and the surface crack nondamaging technology cannot facilitate appropriate maintenance. In Fig. 8(d), the condition is ahlm <acrN <aNDI . Under this condition, since acrN is very small, it pertains to structural ceramics, and appropriate maintenance is impossible with non-destructive inspection and the surface crack nondamaging technology. However, peening forms significant residual stress in structural ceramics. Quality assurance can be provided for cracks caused by peening after self-healing.

4. Conclusion

In the case of varying ΔKth (l) and three types of residual stresses of offshore structural high-strength steel F690, we evaluated As dependence of ΔKth (l) and As dependence of crack depths (a25 and a50) corresponding to fatigue limit reduction rates of 25 % and 50% in Non-NP specimens. Furthermore, in the case where the fatigue crack surface is the same irrespective of As, we evaluated the As dependence of aNDI using high-performance non-destructive inspection. Based on the results, we examined how the surface crack nondamaging technology will contribute to the longevity of F690 and the reliability of maintenance. The conclusions drawn are as follows.
  1. ahlm was larger when the residual stress distribution was larger and deeper, indicating that ahlm was considerably affected by the residual stress distribution. Furthermore, as As and ΔKth (l) increased, ahlm increased.

  2. At ΔKth (l) = 3, 5, and 7  MPam, ahlm of residual stress ③ is above a50, and at ΔKth (l) = 7 MPam in the case of residual stress ②, ahlm of As = 1.0 is above a50. Therefore, in the case of N = 2.0, the safety and reliability of F690 used for a long time can be ensured when using NP.

  3. Since the crack detection ability (◆) determined by the assumed non-destructive inspection cannot detect a50 at residual stresses ①, ②, and ③, it is necessary to apply a more sensitive non-destructive inspection technique.

  4. With the relationship of ahlm, aNDI, and acrN with As, we examined the usefulness of non-destructive inspection and the crack nondamaging technology.

Funding

This work was supported by a Research Grant of Pukyong National University (2021).

Fig. 1
Schematic of a finite plate containing a semicircular crack
KSOE-2021-022f1.jpg
Fig. 2
Three types of residual stresses considered in this study
KSOE-2021-022f2.jpg
Fig. 3
Crack depth dependence of ΔKth and ΔKTr at (a) point A and (b) point C in the case of As = 1.0
KSOE-2021-022f3.jpg
Fig. 4
Crack depth dependence of ΔKth and ΔKTr at (a) point A and (b) point C in the case of As = 0.6
KSOE-2021-022f4.jpg
Fig. 5
Crack depth dependence of ΔKth and ΔKTr at (a) point A and (b) point C in the case of As = 0.3
KSOE-2021-022f5.jpg
Fig. 6
Crack depth dependence of ΔKth and ΔKTr at (a) point A and (b) point C in the case of As = 0.1.
KSOE-2021-022f6.jpg
Fig. 7
Effect of As on the rendered harmless crack depth (ahlm), a25 and a50
KSOE-2021-022f7.jpg
Fig. 8
Schematic diagram of the application of surface crack nondamaging techniques and nondestructive inspection to material integrity
KSOE-2021-022f8.jpg
Table 1
Chemical compositions of DNV F690 (wt.%)
C Si Mn P S Cr Ni Mo Al Cu Nb V Ti
0.18 0.46 1.6 0.025 0.025 0.18 0.36 0.05 0.045 0.28 0.038 0.03 0.02
Table 2
Mechanical properties of DNV F690
Yield strength (MPa) Tensile strength (MPa) Elongation (%)
851 876 15.2
Table 3
Parameters of considered residual stresses
σs (MPa) σmax (MPa) dmax (mm) d0 (mm)
RS1 −150 −400 0.5 1.2
RS2 −250 −647 0.676 1.784
RS3 −400 −731 0.697 2.150
Table 4
Factors obtained from fourth-order polynomial of residual stress distribution
σ4 σ3 σ2 σ1 σ0
RS1 −8.46E+07 8.56E+06 1.03E+05 −1.64E+04 −1.48E+02
RS2 −1.75E+07 −8.74E+05 4.82E+05 −2.56E+04 −2.69E+02
RS3 2.89E+07 −6.04E+06 5.98E+05 −2.36E+04 −4.05E+02

References

Al-Hassani, STS. (1982). The Shot Peening of Metals — Mechanics and Structures. SAE Transactions, 91(4), 4513-4525. Retrieved July 27, 2021, from http://www.jstor.org/stable/44634444
crossref
Al-Obaid, YF. (1990). A Rudimentary Analysis of Improving Fatigue Life of Metals by Shot-Peening. Journal of Applied Mechanics, 57(2), 307-312. https://doi.org/10.1115/1.2891990
crossref
Ando, K., Fueki, R., Nam, KW., Matsui, K., & Takahashi, K. (2019). A Study on the Unification of the Threshold Stress Itensity Factor for Micro Crack Growth. Transactions of Japan Society for Spring Engineers, 2019(64), 39-44. https://doi.org/10.5346/trbane.2019.39
crossref
Ando, K., Nam, KW., Kim, MH., Ishii, T., & Takahashi, K. (2020). Analysis of Peculiar Fatigue Fracture Behavior of Shot Peened Steels Focusing on Threshold Stress Intensity Factor Range. Transactions of Japan Society for Spring Engineers, 2020(65), 35-41. https://doi.org/10.5346/trbane.2020.35
crossref
Ando, K., Kim, MH., & Nam, KW. (2021). Analysis on Peculiar Fatigue Fracture Behavior of Shot Peened Metal Using New Threshold Stress Intensity Range Equation. Fatigue & Fracture of Engineering Materials & Structures, 44(2), 306-316. https://doi.org/10.1111/ffe.13356
crossref
American Petroleum Institute (API). (2000). Recommended Practice 579, Fitness for Service. American Petroleum Institute, C3-C10.

Benedetti, M., Fontanari, V., Höhn, BR., Oster, P., & Tobie, T. (2002). Influence of Shot Peening on Bending Tooth Fatigue Limit of Case Hardened Gears. International Journal of Fatigue, 24(11), 1127-1136. https://doi.org/10.1016/S0142-1123(02)00034-8
crossref
EI Haddad, MH., Topper, TH., & Smith, KN. (1979). Prediction of non Propagating Cracks. Engineering Fracture Mechanics, 11(3), 573-584. https://doi.org/10.1016/0013-7944(79)90081-X
crossref
Fueki, R., Takahashi, K., & Houjou, K. (2015). Fatigue Limit Prediction and Estimation for the Crack Size Rendered Harmless by Peening for Welded Joint Containing a Surface Crack. Materials Sciences and Applications, 6(6), 500-510. https://doi.org/10.4236/msa.2015.66053
crossref
Fueki, R., Takahashi, K., & Handa, M. (2019). Fatigue Limit Improvement and Rendering Defects Harmless by Needle Peening for High Tensile Steel Welded Joint. Metals, 9(2), 143. https://doi.org/10.3390/met9020143
crossref
Harada, Y., Fukaura, K., & Haga, S. (2007). Influence of Microshot Peening on Surface Layer Characteristics of Structural Steel. Journal of Materials Processing Technology, 191(1–3), 297-301. https://doi.org/10.1016/j.jmatprotec.2007.03.026
crossref
Houjou, K., Takahashi, K., Ando, K., & Sekiguchi, Y. (2013a). Improvement of Fatigue Limit and Rendering Crack Harmless by Peening for Rolled Steel Containing a Crack at the Weld Toe Zone. Transactions of the Japan Society of Mechanical Engineers A, 79(797), 110-114. https://doi.org/10.1299/kikaia.79.110
crossref
Houjou, K., Takahashi, K., & Ando, K. (2013b). Improvement of Fatigue Limit by Shot Peening for High-Tensile Strength Steel Containing a Crack in the Stress Concentration Zone. International Journal of Structural Integrity, 4(2), 258-266. https://doi.org/10.1108/17579861311321726
crossref
Kim, JH., & Kim, YI. (2018). Numerical Simulation on the Response of Moored Semi-submersible Under Ice Load. Journal of Ocean Engineering and Technology, 32(3), 177-183. https://doi.org/10.26748/KSOE.2018.6.32.3.177
crossref
Kim, MH., Hyun, JY., & Nam, KW. (2020). Evaluation of Harmless Crack Size using Ando’s Equation. Journal of Mechanical Science and Technology, 34, 1971-1977. https://doi.org/10.1007/s12206-020-0418-7
crossref
Kim, MH., Lee, WG., Kim, CS., Takahashi, K., Handa, M., & Nam, KW. (2021). Evaluation of Fatigue Limit and Harmless Crack Size of Needle Peened Offshore Structure Steel F690. Journal of Mechanical Science and Technology, 35(9), 3855-3862. https://doi.org/10.1007/s12206-021-2109-4
crossref
Lee, JG., & Kim, JK. (1997). Influence of Residual Stress Due to Shot Peening on Fatigue Strength and Life. Transactions of the Korean Society of Mechanical Engineers A, 21(9), 1498-1506. https://doi.org/10.22634/KSME-A.1997.21.9.1498
crossref
Lee, KY., Choi, HS., Lee, EJ., & Yoon, TS. (2011). Future Vision Through NL Tensioner Technology Development and Domestic Equipment Fabrication. Journal of Ocean Engineering and Technology, 25(2), 127-133. https://doi.org/10.5574/KSOE.2011.25.2.127
crossref
Nakagawa, M., Takahashi, K., Osada, T., Okada, H., & Koike, H. (2014). Improvement in Fatigue Limit by Shot Peening for High-Strength Steel Containing Crack-like Surface Defect (Influence of Surface Crack Aspect Ratio). Japan Society of Spring Engineers, 2014(59), 13-18. https://doi.org/10.5346/trbane.2014.13
crossref
Nam, KW., Ando, K., Kim, MH., & Takahashi, K. (2021). Improving Reliability of High Strength Steel Designed Against Fatigue Limit using Surface Crack Nondamaging Technology by Shot Peening. Fatigue & Fracture of Engineering Materials & Structures, 44(6), 1062-1610. https://doi.org/10.1111/ffe.13460
crossref
Newman, JC Jr., & Raju, IS. (1981). An Empirical Stress-Intensity Factor Equation for the Surface Crack. Engineering Fracture Mechanics, 15(1–2), 185-192. https://doi.org/10.1016/0013-7944(81)90116-8
crossref
Ochiai, M., Miura, T., & Yamamoto, S. (2006). Laser-Ultrasonic Nondestructive Testing and Its Application to Nuclear Industry. Toshiba Review, 61(1), 44-47.

Park, HS., Kim, MH., & Nam, KW. (2020). A Study on the Threshold Stress Intensity Factor and Fatigue Limit of Short Crack Growth. Transactions of the Korean Society of Mechanical Engineers A, 44(11), 781-786. https://doi.org/10.3795/KSME-A.2020.44.11.781
crossref
Park, HS., Kim, MH., & Nam, KW. (2021). Study of Threshold Stress Intensity Factor and Fatigue Limit for Through Crack in Infinite Plate and Semi-Elliptical Surface Crack in Finite Plate. Transactions of the Korean Society of Mechanical Engineers A, 45(2), 133-139. https://doi.org/10.3795/KSME-A.2021.45.2.133
crossref
Rummel, WD., Todd, PH Jr., Frecska, SA., & Rathke, RA. (1974). The Detection of Fatigue Cracks by Nondestructive Testing Methods (Report NASA-CR-2369). NASA Contractor.

Song, CY., Choi, HY., & Shim, SH. (2013). Structural Safety Evaluation of Marine Loading Arm Using Finite Element Analysis. JJournal of Ocean Engineering and Technology, 27(1), 43-50. https://doi.org/10.5574/KSOE.2013.27.1.043
crossref
Takahashi, K., Okada, H., & Ando, K. (2012). Effects of Shot Peening on the Torsional Fatigue Limit of High-Strength Steel Containing an Artificial Surface Defect. International Journal of Structural Integrity, 3(3), 274-284. https://doi.org/10.1108/17579861211264389
crossref
Tange, A., Akutu, T., & Takamura, N. (1991). Relation Between Shot-Peening Residual Stress Distribution and Fatigue Crack Propagation Life in Spring Steel. Transactions of Japan Society for Spring Engineers, 1991(36), 47-53. https://doi.org/10.5346/trbane.1991.47
crossref


ABOUT
BROWSE ARTICLES
ARTICLE CATEGORY

Browse all articles >

PUBLICATION ETHICS
FOR CONTRIBUTORS
Editorial Office
President Office BD Rm. 1302, 13 Jungang-daero 180beon-gil, Dong-gu, Busan 48821, Republic of Korea
Tel: +82-51-759-0656    Fax: +82-51-759-0656    E-mail: ksoehj@ksoe.or.kr                

Copyright © 2024 by The Korean Society of Ocean Engineers.

Developed in M2PI

Close layer
prev next